The ISDA-Clarus RFR Adoption Indicator has been published for August 2020. The headlines are:
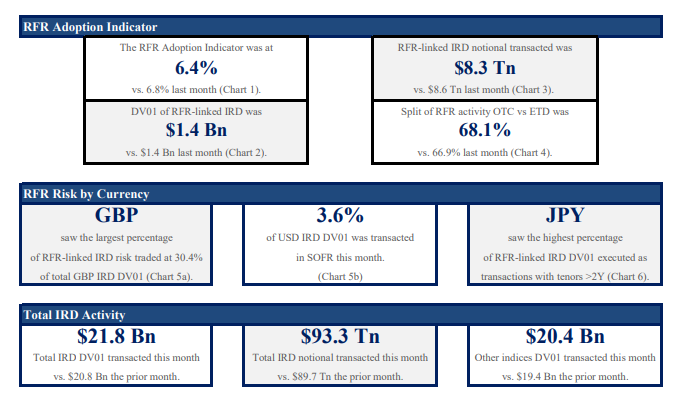
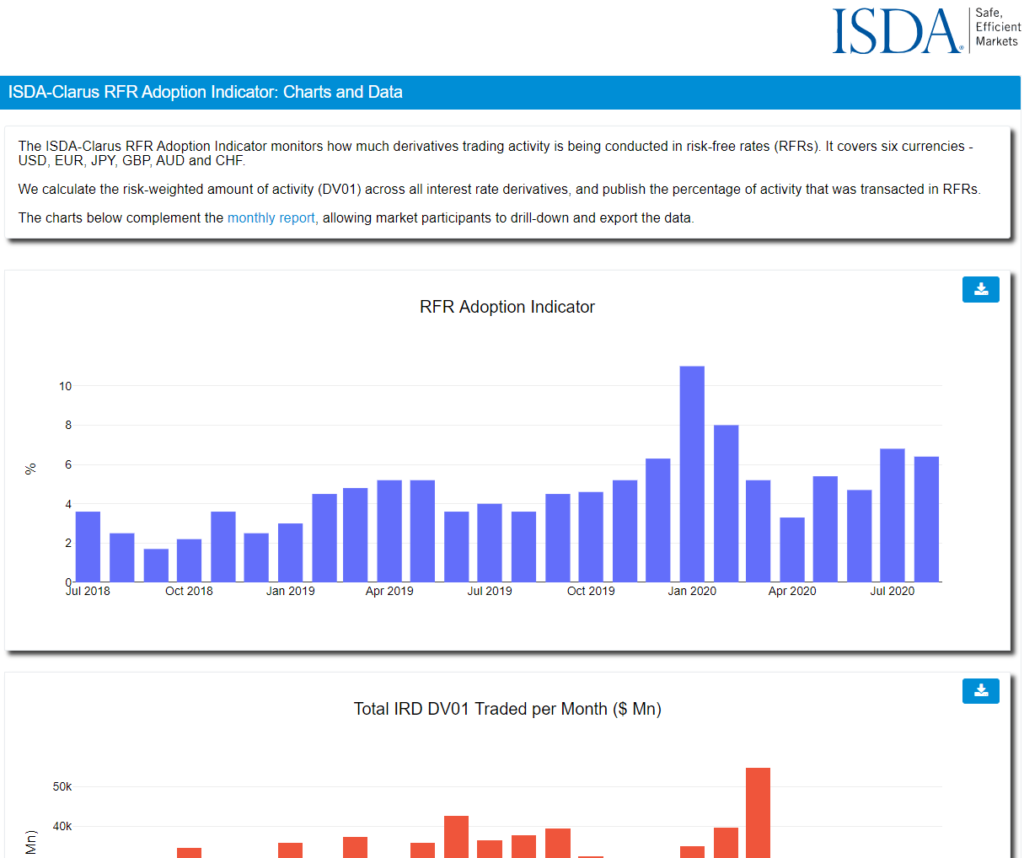
- The RFR Adoption Indicator was at 6.4% in August 2020.
- This was pretty unchanged from 6.8% the prior month, and short of the highs hit in January 2020.
- 3.6% of all USD risk was traded in SOFR vs 3.8% last month, so no great change there.
- The discounting switch to €STR at CCPs occurred in the final days of July, so we were expecting this to have an impact on the amount of €STR risk traded during August.
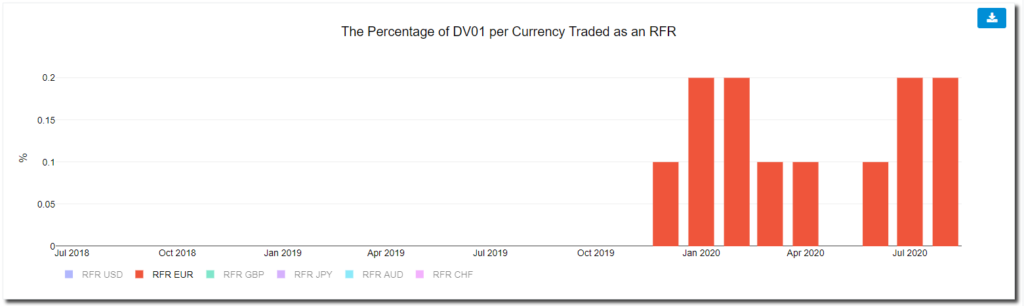
- However, €STR accounted for just 0.2% of total EUR risk traded, unchanged from the prior month.
- Indeed, even looking at the LCH €STR volumes in August, they were actually lower than in July (in notional terms).
Please see rfr.clarusft.com for interactive charts (and data downloads) covering all of the measures in the ISDA-Clarus RFR Adoption Indicator:
€STR waiting to Take-off
The discounting switch in July seems to have done little for the appetite of €STR risk. Even from SDR data alone, we see that EONIA risk continues to dominate trading:
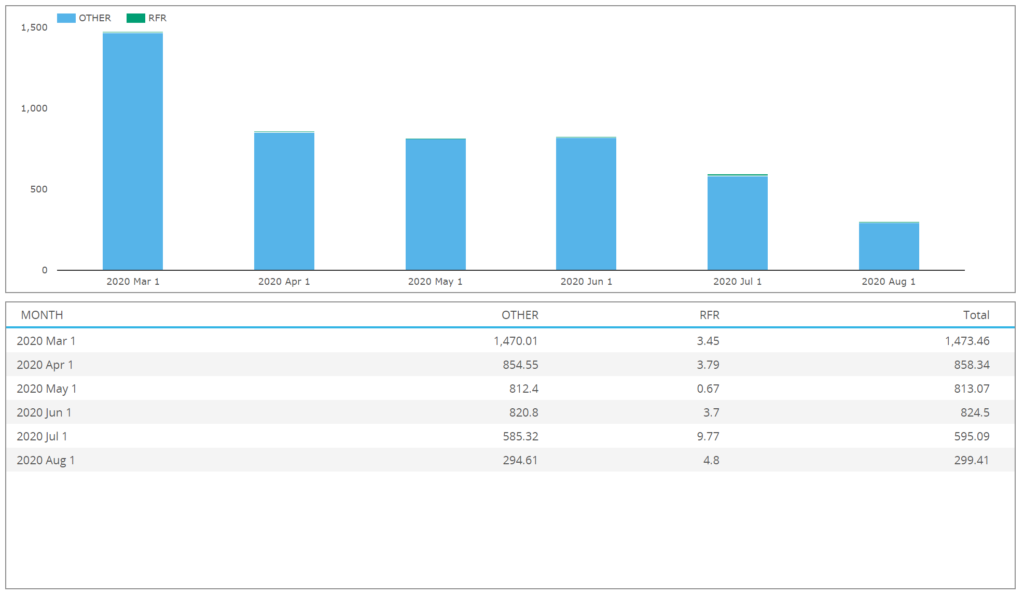
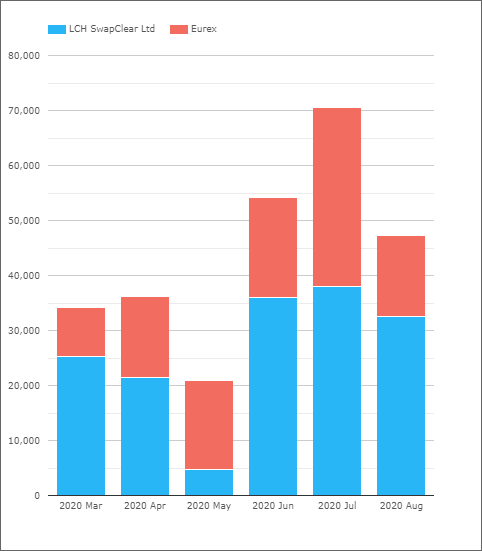
And CCPView shows that total notional amounts across both LCH and Eurex were lower for €STR products during August than July:
Whilst it might be easy to write this off as a result of “quiet” summer markets, the transition to RFRs should really be working on a different schedule to typical market behaviour.
Unfortunately, even as a proportion of the overall risk traded, there was no substantial increase in €STR activity:
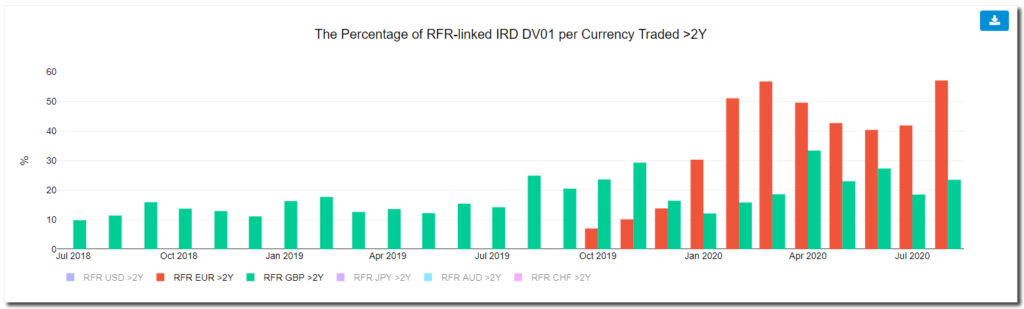
One area where things look relatively rosy for €STR is the amount of long-dated risk traded. Okay, they are small amounts, but at least 50%+ of €STR risk tends to be longer than 2 year maturities. This is considerably more than e.g. GBP SONIA:
What About SOFR?
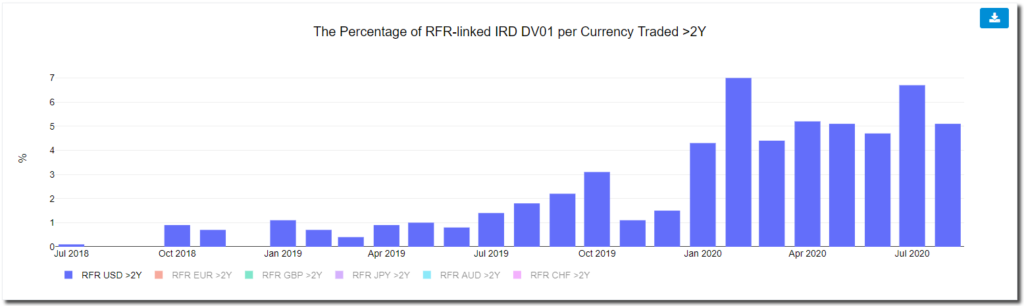
Most SOFR risk continues to be traded in futures, rather than OTC. This means that across the whole market, 95% of risk tends to be less than one year maturities:
However, that doesn’t chime with the picture from OTC markets alone, where August certainly saw some interesting activity (SDR data only);
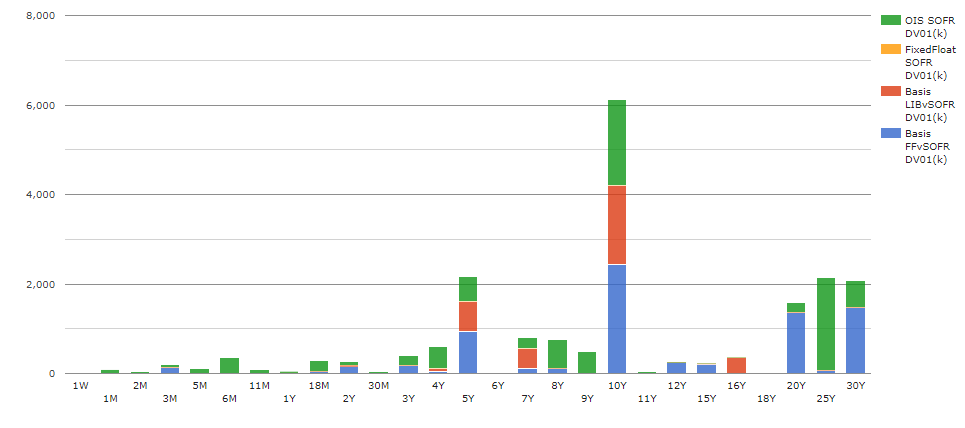
From the chart, we can see that on a DV01-basis, there was more activity in 10Y SOFR than any other area of the curve. This activity was comprised of outright OIS as well as basis trades versus both Fed Funds (EFFR) and USD LIBOR.
My guess would be that given EONIA is a slave rate to ESTR with the fixed spot spread, market participants are happy to continue trading EONIA even though that does seem to have some fallback risk associated (although even if it goes to calculation agent or litigation one has to assume ESTR + 8.5bps would be the only meaningful fallback to assume for EONIA after end of 2021). One also wonders whether participants with large EONIA exposure (which might well be directionally shared across major dealers) dont want to end up potentially moving the longer dated EONIA-ESTR spreads from the theoretical 8.5bps. There is no reason why forced hedging of longer dated EONIA-ESTR basis couldn’t push these spreads away from theoretical levels which could cause some MTM pain in the short term.
It will be very interesting to monitor the pick up in SOFR liquidity after Oct-17 given the free-floating spread to see if this theory is supported.
Thanks Ben – you pretty much echo my thoughts exactly. Why not just trade €STR now and remove any risk of a basis emerging (for whatever reason that may be?). SOFR switch is what, six weeks away now? I would have thought people wanted to be through the €STR transition before tackling that one….