Welcome to my 250th blog for Clarus! That is quite a milestone – I’ve now inflicted nearly a quarter of a million words on our readers. I hope the vast majority have been useful.
To celebrate, you will have to suffer a bit of true geekiness. Today we’ll take a look at Regulatory Capital, which I fully admit is not everyone’s cup of tea….still, I will give you some easy to remember sound-bites at the end.
SACCR is Coming
If you need a refresher on SACCR and CEM, then please check out our comprehensive coverage below:
- CURRENT EXPOSURE METHODOLOGY – WHAT YOU NEED TO KNOW
- SA-CCR: STANDARDISED APPROACH COUNTERPARTY CREDIT RISK
- SA-CCR FOR US BANKS
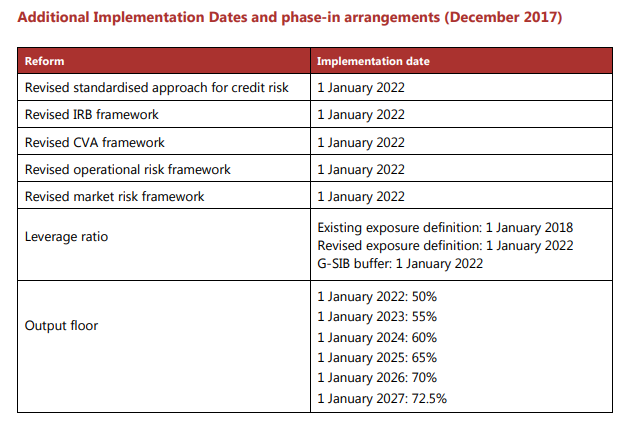
Suffice to say that we expect SACCR to be live by January 2022 at the very latest across all jurisdictions and even earlier for leverage ratio calculations:
SACCR for Rates Products
When we delved into the SACCR calculations, we found that it is necessary to start from the bottom-up when calculating Risk Weighted Assets under SACCR. However, I realise that not all of our readers want the absolute detail. Fortunately we provide a simple Excel add-in that calculates Exposure at Default under SACCR.
SACCR for Excel has free trials available here.
SACCR for Excel
I will use our SACCR for Excel tool to demonstrate some simple portfolios. Alongside the calculations I will do some manual comparisons to what the equivalent CEM number would have been.
SACCR for Rates
It is useful to use some simple examples in Interest Rate Swaps to illustrate the main parts of SACCR.
Let’s start with 3 interest rate swaps with 3 different counterparties. They are all uncleared but subject to the Uncleared Margin Rules. They therefore operate under a daily CSA with a zero threshold:
Showing;
- For each swap, the SACCR “Exposure at Default” is shown. For CEM, the “Potential Future Exposure” is shown. These are the two key measures that dictate the Risk Weighted Assets (RWAs) under each methodology.
- You can see that the CEM calculations are very simple. It is a given percentage of notional, which varies by asset class and maturity. For Rates, these vary from 0% (sub 1 year) to 1.5% (5y+).
- For SACCR, there are more variables to consider. Check out Section 52.51 of BCBS CRE52 here, which I summarise below:
- Is the trade cleared?
- If not, what are the details of the bilateral CSA?
- Does it have daily, weekly, monthly margining?
- Are there any disputes across the CSA?
- Are there any “difficult to replace” derivatives in the CSA?
The answer to those questions dictate the variable in SACCR known as the “Margin Period of Risk”. There is not an equivalent to compare to under the Current Exposure Methodology.
Margin Period of Risk
What we can do for SACCR is try to demystify what the Margin Period of Risk really does. If you think of a SACCR exposure as being approximately calculated as:
\( \tag {1} EAD = 1.4 \times NetNotional \times 0.005 \times \dfrac{3}{2}. \sqrt{ \dfrac{M POR}{250}} \)where;
1.4 is the regulatory defined value of “alpha” (α). This multiplier was completely absent from CEM.
0.005 is the Supervisory Factor (“risk weighting”) for Rates of 0.5%. If we were looking at FX, this would be 0.04 (4%).
\( \sqrt{ \dfrac{3}{2}.\dfrac{M POR}{250}} \) is the “Maturity Factor” which can change depending on how the trade is margined/cleared.
To understand the implication, it is therefore useful to keep a handy reference of the Maturity Factors that can apply to your trades depending on the CSA in place. The values range from:
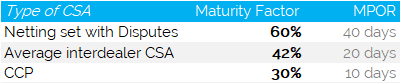
Optimising the terms of CSAs will therefore have a significant impact on regulatory capital. Disputes and “hard to replace” derivatives are bad, daily margining and clearing are good!
Clearing
Away from the intricacies of the margin period of risk, the biggest single difference for dealer banks will be the use of net notional when calculating SACCR exposures. Previously, CEM was always based on gross notional and only allowed for a limited amount of netting – up to 40% based on the mark to market of the derivative, not the direction (bizarre!).
The impact of netting is going to be most evident for cleared trades. If we take our 3 swaps above and move them to LCH SwapClear (other CCPs are available!) we see the following SACCR and CEM exposures:
Cleared USD IRS
Showing;
- For a portfolio where I have payer swaps in 6 months and 10years and a receiver swap in 4 years the amount of netting is significant.
- The SACCR exposure reduces from $328k down to $119k a reduction of 64%!
- Note that the CEM number doesn’t change.
- This is significant for leverage ratio. Under SACCR, clearing will be far more capital efficient than it currently is. This is mainly thanks to a clearing house being recognised as a single “netting set” under SACCR.
As an interesting note, “BCBS279” in 2014 set out the original parameters for SACCR. This originally included a Margin Period of Risk as short as five days for exposures to CCPs:
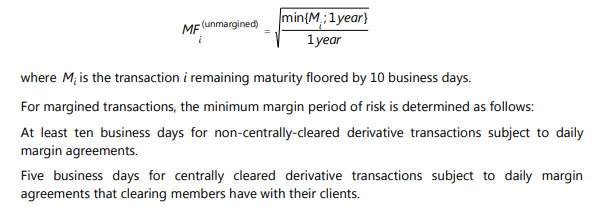
However, now that SACCR has been finalised and published in HTML on the BIS website as “CRE52“, I can no longer find this reference. So it looks like the floor on the MPOR is now indeed 10 business days.
With SACCR being rolled out for leverage ratio calculations already across a number of jurisdictions (see SACCR for US Banks) this means that dealers should be ever more motivated to move as much risk into clearing as possible. As well as benefiting from a substantial reduction in exposures for their current portfolios.
Directional Portfolios
What I find interesting under SACCR is the impact to directional portfolios. SACCR is intended to be a more risk-sensitive measure than CEM.
For our simple portfolio, let us assume that all swaps are now payers, and that we move them to clearing. We see the following exposures under SACCR and CEM:
Showing;
- The SACCR exposure reduces from $328k to $298k in clearing, a reduction of 9%.
- SACCR still therefore promotes clearing.
- However, the SACCR exposure is higher than the CEM exposure by 19%.
If you have a directional portfolio, it is likely that moving from CEM to SACCR will actually increase your exposures and hence result in an increase in regulatory capital requirements.
Collateral or Settlement, FX or Rates?
I am going to leave it there for now so that we do not get lost in too many intricacies today. However, if this was useful, please add comments below and tell us what else you would like to see. We can:
- Repeat the above process for FX portfolios.
- Demonstrate the impact of STM (Settle to Market) under SACCR.
Let us know what you want to see next!
In Summary
Finally, I promised some SACCR soundbites. Here goes:
- SACCR will reduce exposure measures for typical dealer portfolios.
- SACCR can increase exposures for directional portfolios when compared to previous methodologies (CEM).
- SACCR is sensitive to the Margin Period of Risk for collateralised trades. This can range from 10 business days to much longer (even 40!).
- Clearing substantially increases netting, which in turn substantially lowers SACCR exposures – both compared to bilateral markets and to the previous CEM measures.
Hi, thanks for doing this up! In equation (1), shouldn’t there be a [square root] applied on [MPOR/250]?
Great spot! Now updated. Many thanks for reaching out.
Would like to take up the offer to see the process repeated but for FX!
Would be great with a deep dive on SACCR and STM.