Following on from my article SEF MAT Week 5, USD IRS SEF Vols Hit Record High and a New Leader, this week I will look at:
- Figures for Week 6 (Mar 24-28)
- 27 March, Forwards Volumes
- Market share in USD IRD by SEF
- Curve Trades and Butterflys
- MAC Swaps
Week 6
Lets start with a chart from SDRView Researcher of weekly volumes for all USD Interest Rate Swaps in the eight week period starting February 3, 2014.
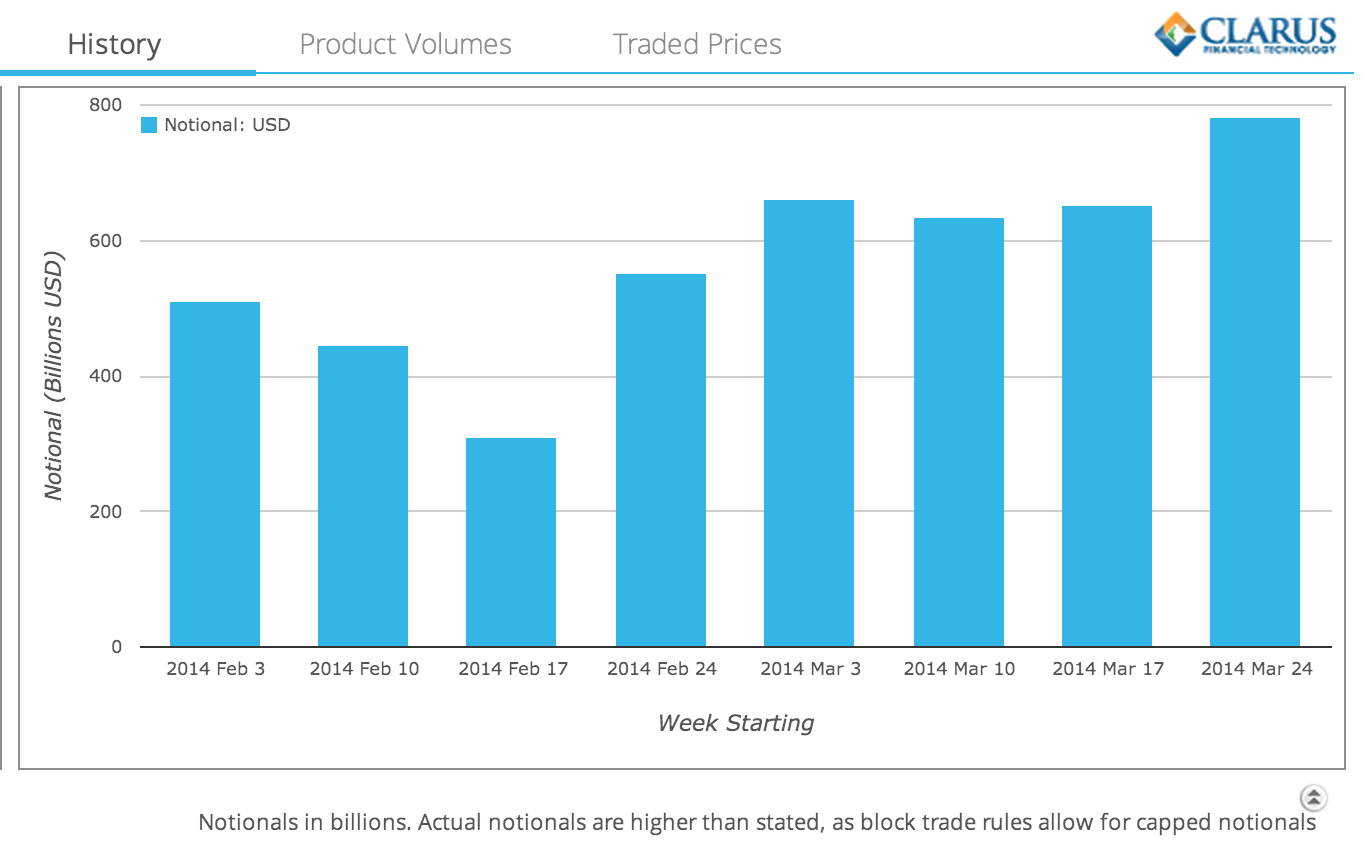
Which shows that Week 6 (Mar 24-28) was a record week for volume in 2014, with around $800 billion.
Perhaps not surprising given that it is the end of the quarter and the March one is a common financial year end for many firms.
Lets also look at just the On SEF USD IRS Volumes.
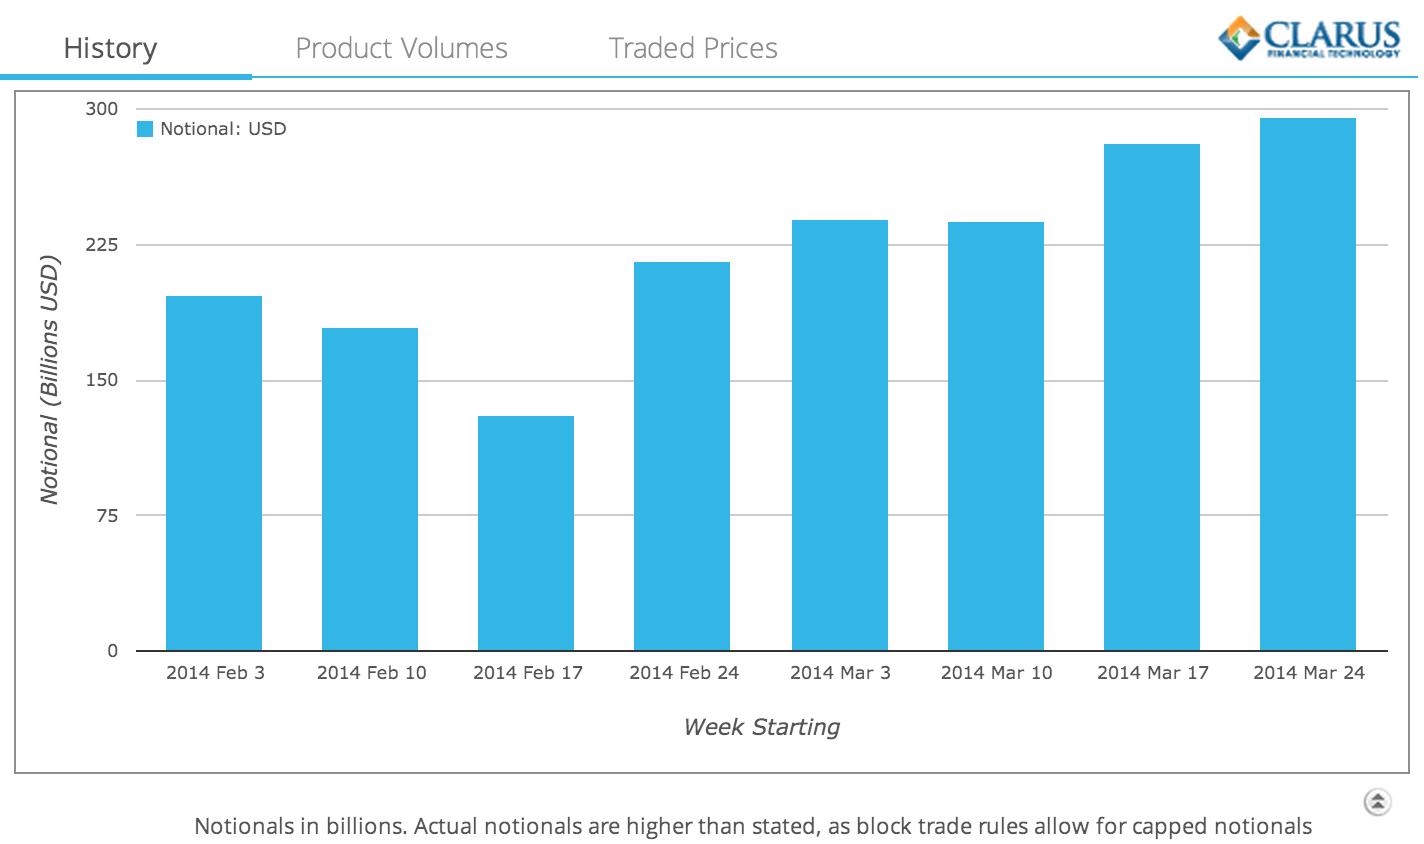
Again this shows Week 6 as a record week, however without the same size jump from Week 5 as in the prior chart.
Lets explore further by looking at daily volumes for last week.
The chart for On SEF does not show anything interesting, but the one for Off SEF certainly does.
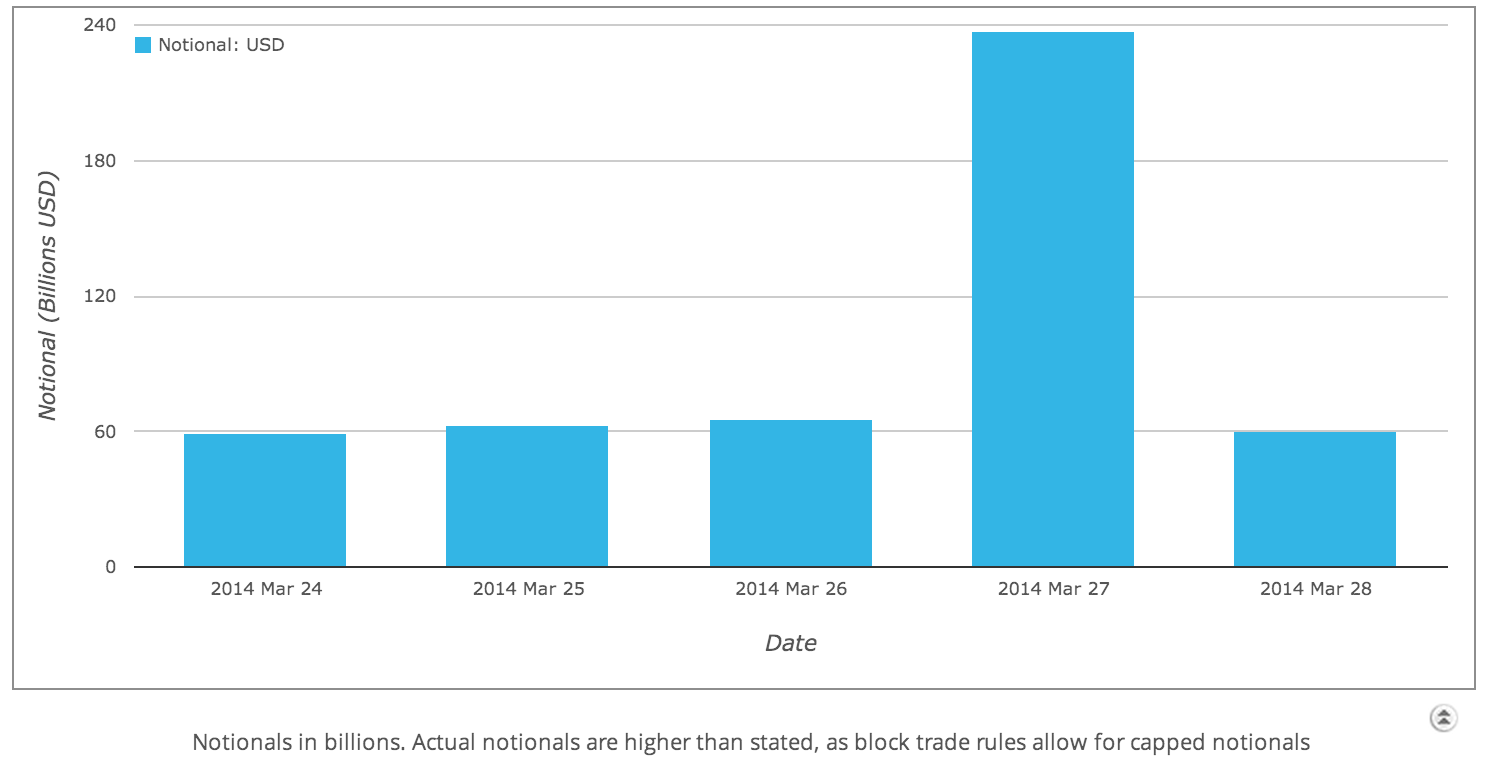
We can clearly see that March 27 was a very big day, for Non MAT Swaps.
27 March, Forward Volumes
Now we know that Forwards that start on the first 2 IMM dates and are 2y, 3Y, 5Y, 7Y, §0Y, 12Y, 15Y, 20Y, 30Y are MAT.
However this means that Forwards on other dates and tenors are not MAT and on some days there could be lots of these.
That indeed is what we find on the 27 March.
Of the $240 billion volume, at least $115 billion is Forwards.
While we are working on providing a view in SDRView Professional specifically for Forwards, lets for the moment create a table of Forward Start period as rows and Swap Tenor as Columns and just for those with large numbers.
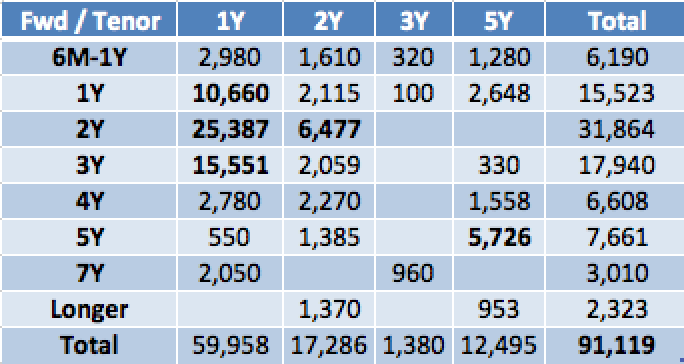
This makes interesting viewing:
- 2Y into 1Y is > $25 billion, 3Y into 1Y > $15 billion, 1Y into 1Y has > $10 billion
- 2Y into 2Y has > $6 billion
- 5Y into 5Y has > $5 billion
- The periods and tenors we have selected total to > $91 billion
- There is $23 billion spread (thinly) over other periods and tenors
- I don’t know the reason for this volume
- Surely something to do with financial year end
- Or Swaption hedging (as look like common Swaption periods)
- Or … your guess is as good as mine
There were certainly many large trades (> $1billion), as the screen shot below shows.
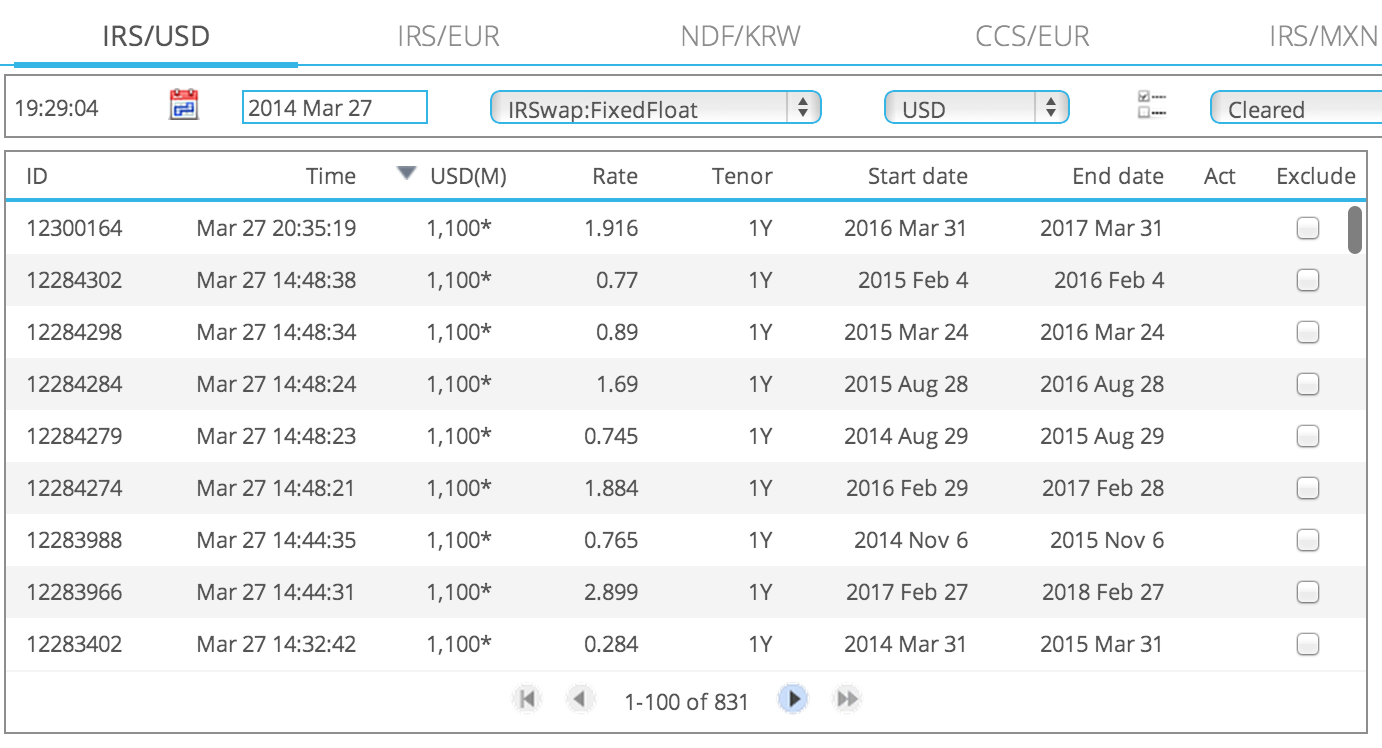
All very interesting in terms of what the data shows.
SEF Market Share
Now onto volumes reported by SEFs using SEFView.
Lets start with a table for the last two weeks (amounts in $ millions).
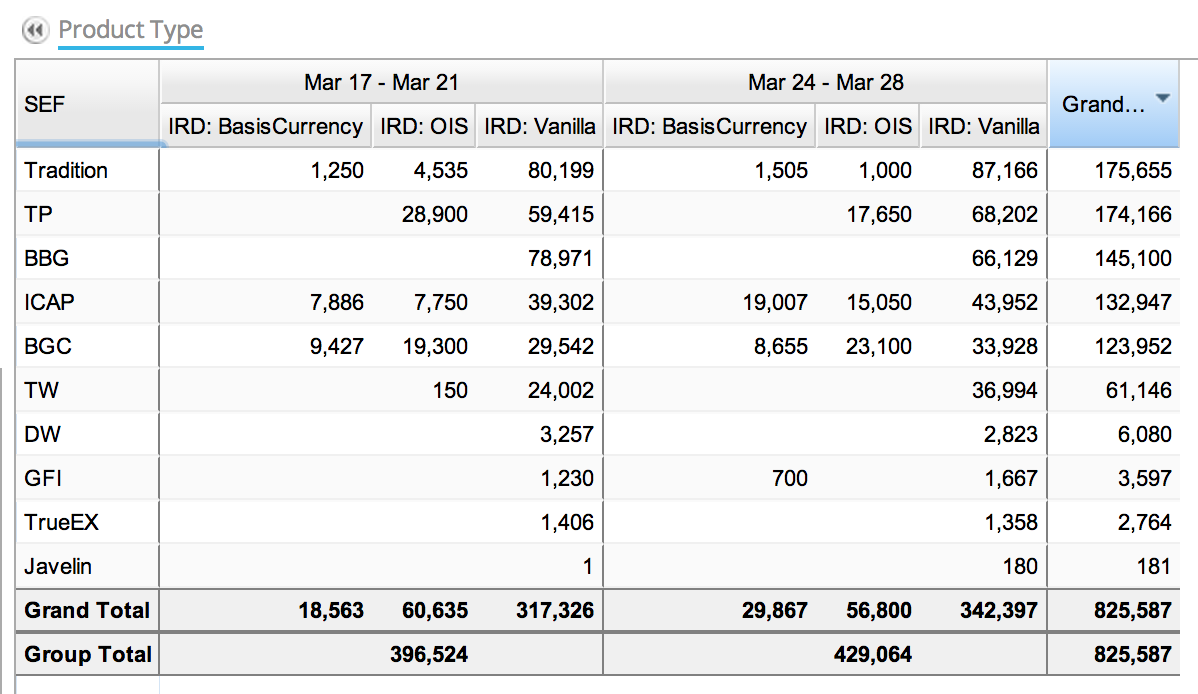
From which we can see:
- Volumes for Basis, OIS and Vanilla Swaps trades for each week.
- Unlike last week, I have included Basis & OIS Swaps.
- Two reasons; one as both are Interest Rate Swaps and two the product types overlap
- So for TP we are showing Zero for Basis, as these are being aggregated into Vanilla
- We do plan to change this, but if you drill-down on these numbers, you will see that the descriptions do not make our life easy in automating the correct categorisation
- Onto the numbers.
- The week of 24-28 March was a higher volume week
- Higher by $32 billion
- Ranking Order is similar to the prior week
- The four IDBs split by Bloomberg
- TradeWeb (TW) showing a good increase to $37b from $24b in each of its prior 3 weeks
- Not much else of significance
Curve Trades and Butterflies
Those of you that read Week5 will know that I showed some work we have in progress on risk weighted market share.
I received a number of comments on this, in that while a step forward it did not consider an important element.
Namely that in the Dealer market Swaps are often executed as Strategies.
So Curve Trades like Steepeners or Flatteners, pay fixed 2Y, receive fixed 10Y.
Or Butterflys, 2s/5s/10s.
These are designed to take a view on the relative spread between Swap tenors or changes to the Curve shape.
And the DV01 or Duration of such strategies is not the sum of each legs DV01 (or Duration) but a DV01 (or Duration) allowing for direction.
Unfortunately each SEF reports these split into legs, so the 2s in a Butterfly would be aggregated with any standard 2Y Swap volume.
Which means it is impossible using the SEF reported figures to determine this risk adjustment.
By nature as such trades are designed to capture small relative changes in spreads and not outright rate changes, they are likely to be executed in larger size than standard trades.
Making the risk adjustment more significant in impact than that I showed in last weeks blog.
One solution would be to get the SEFs to change their reporting for Swaps to distinguish Strategy.
Another would be to look in the SDR for trades with the same execution time-stamp and re-construct the strategy from these.
We intend to research both approaches, so more on this in a future blog.
Anecdotally we hear that some SEFs do a larger portion of these than others and so their relative position will change significantly. Until we can crunch the numbers the jury is out.
MAC Swaps
And what of the Market Agreed Coupon (MAC) Swaps that I looked at in Week 4?
A quick look at BBG shows $3.8 billion of MAC Swaps in the week of Mar 24-28 out of $66 billion.
While TW shows $478 million out of $37 billion.
So little change from the week of 10-14 March.
Summary
The Week of Mar 24-28 was the highest volume week in 2014 for USD IRS.
On SEF Volumes increased.
The big increase was in Off SEF Volumes.
Driven by a huge day on March 27, with more than $115 billion of Forwards traded.
Possibly to do with the end of the March quarter and financial year end.
SEF Market Share order was little changed from the prior week.
Risk weighting of volumes should account for Strategies (Curve trades/Butterflys).
As this is likely to change the relative rankings.
However as SEFs report legs, aggregated with all trades for that tenor, as a single eod number, this is a tricky task.
MAC Swap volumes are un-changed from Mar 10-14.
Thats it for Week 6.