Week 10 is in the books. Javelin and Tradeweb modified their MAT filings (streamlining them), Bloomberg filed their MAT, and ICAP had its annual celebrity day. Clients have now been exposed to SEF’s for 10 weeks. So whats happening with the numbers?
THE NUMBERS
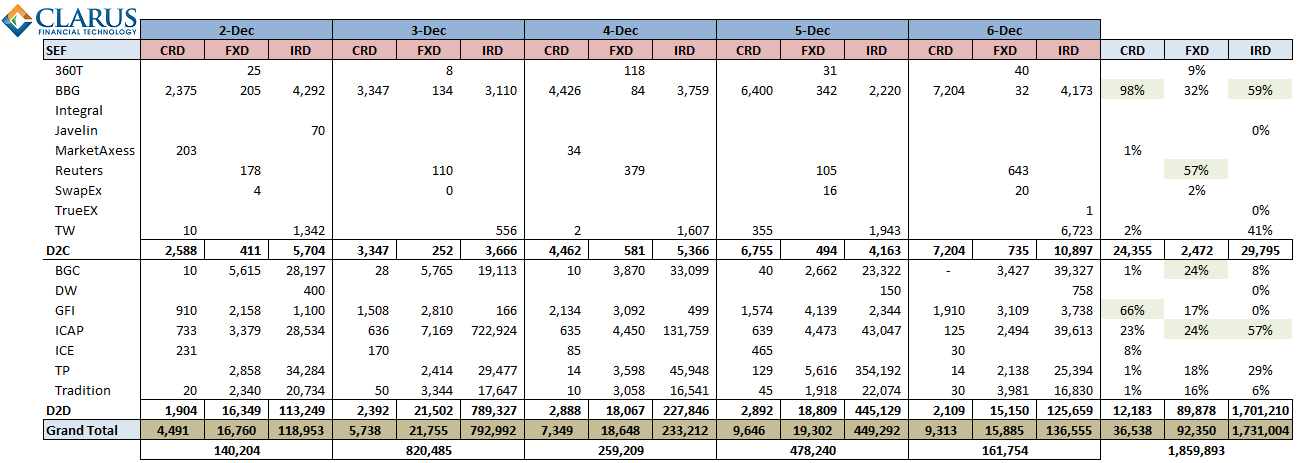
First the raw numbers. These are all products within Credit, FX, and Rates asset classes. USD equivalents, in millions. The percentage numbers are modified this week, such that they reflect the percentage for the SEF type. Hence its more clear the business each SEF has within their group (D2C vs D2D).
As we normally do, we try to normalize the data by removing the FRA activity:
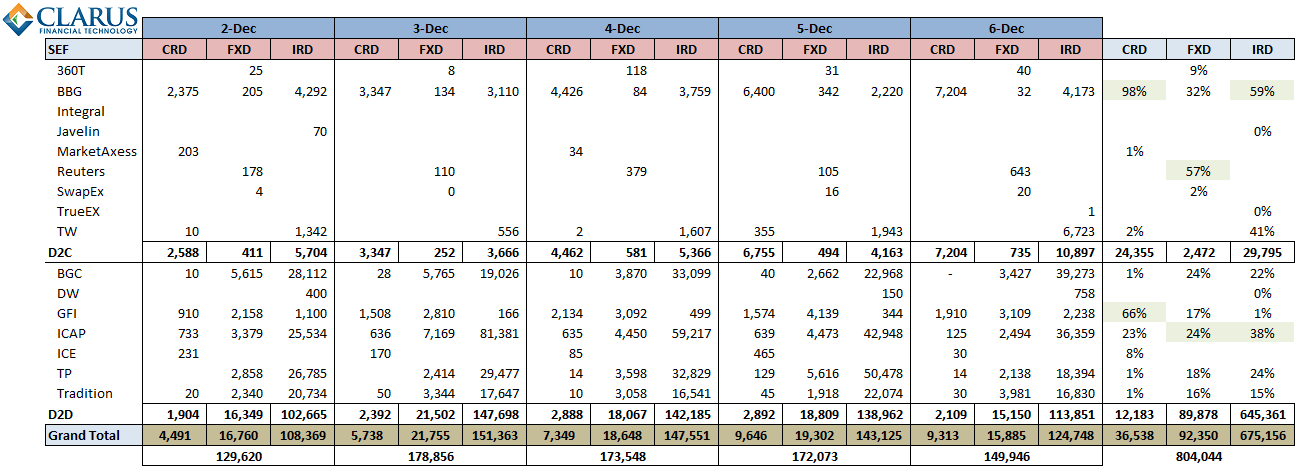
As usual the largest dropoffs due to FRA’s come from ICAP and Tullet.
D2?
Gensler has been very clear on impartial access as I explained in last weeks post. However, I plan to continue to separate each SEF by these classifications as its not clear to me how quickly an IDB will be signing up regional banks, and likewise how many dealers will be transacting over an electronic RFQ platform. It took a while to get rulebooks written in the first place (and read!), you cant imagine a massive shift in a couple weeks.
PHONE A FRIEND DUCHESS
ICAP had their annual celebrity day on Tuesday December 3 where various celebrities manned the phones. From the numbers, it would seem Camilla Parker Bowles was brokering FRA’s.
WEEK ON WEEK CHANGES
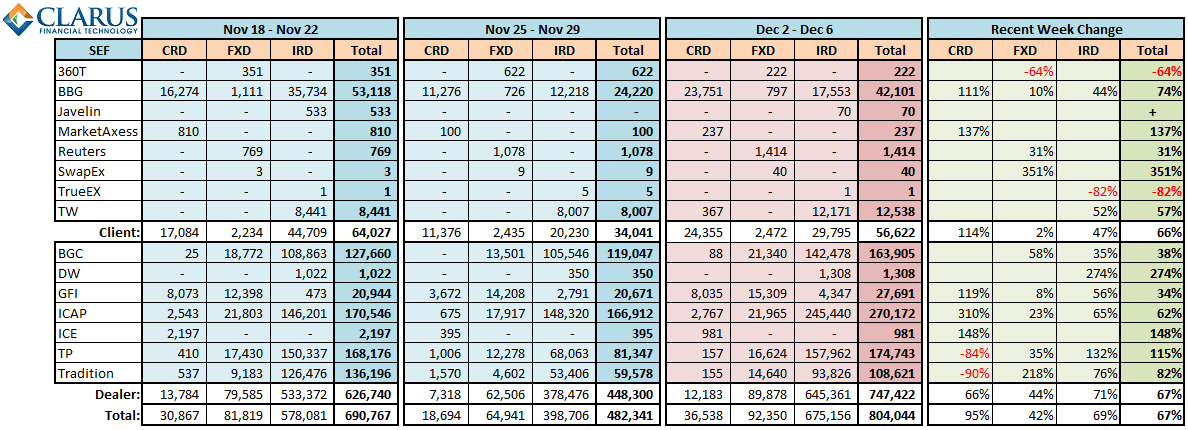
I’ve limited the history here for just the past 3 weeks, and am showing the changes from week 9 (Nov 25 week) to week 10 (Dec 2 week):
ANALYSIS
- Week-on-week changes can at least be in part be attributed to the holiday week prior
- Credit trading continues to be lobsided with roughly 2/3 of the activity coming from BBG
- Comparing week 10 to week 8 (skipping Thanksgiving) shows a slight uptick in D2D, and a slight downtick in D2C
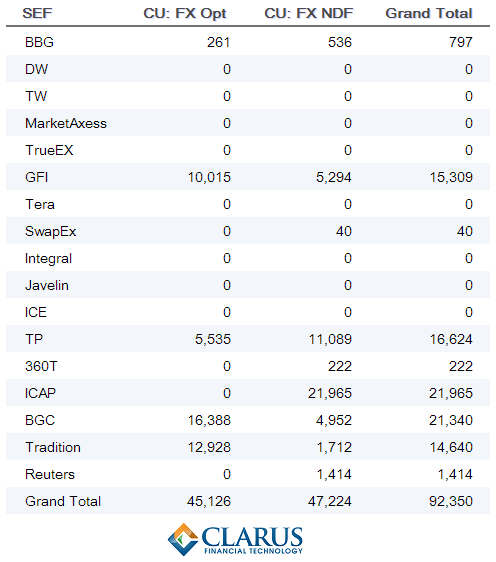
WHATS HAPPENING IN FX?
Now that we are breaking out the asset classes into the product types, we’re able to slice and dice to the product type level. The table below is breaking down the FX asset class. I find it interesting to see roughly the same overall activity in Options as there is in NDF:
WRAPUP
At what point are we going to see large increases in activity? We’re creeping up to the holiday season, so unlikely to happen until the new year. At which point the MAT will be just around the corner for rates and credit. Might get interesting soon!
UPDATE
This weekly issue of SEF updates is not the most current. To see all SEF posts, including the most recent, please click through to the SEF Category.