Continuing with our Swaps review series, let’s look at volumes in September 2017.
Summary:
- USD IRS volumes similar to prior months
- USD IRS SEF Compression and Rolls with much higher volumes
- USD OIS volume subdued and down to similar gross notional to IRS
- Our new Daily Briefing for USD Swaps is now available
- EUR IRS and OIS volume up from prior months
- D2C SEFs are up with Tradeweb the largest
- D2D SEFs are down with IGDL the largest
- CME–LCH Switch volumes down but Basis Spreads are up
- Global Cleared Volumes in Q3 much lower than Q2
- LCH SwapClear up 48% from a year earlier in major ccys
- In Asia, LCH SwapClear volume is up
- In LatAm, CME volume is up
- NDFs at LCH ForexClear with a second consecutive record month
Onto the charts, data and details.
USD IRS ON/OFF SEF
Using SDRView the gross-notional volume of On and Off SEF USD IRS Fixed vs Float price forming trades (Outrights, SpreadOvers, Curve/Flys).
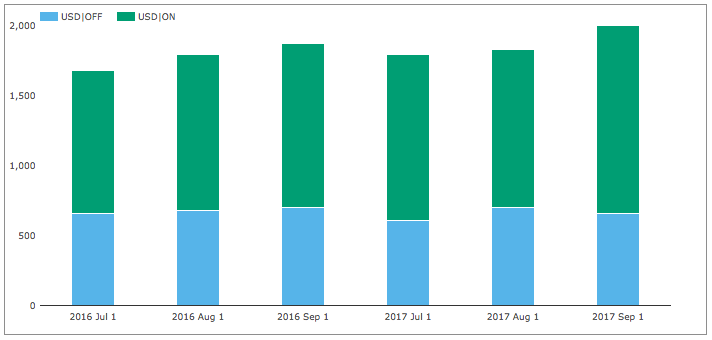
- Sep 2017 On SEF gross notional is > $1.34 trillion
- (recall capped trade rules mean this is understated as the full size of block trades is not disclosed)
- Sep 2017 is 15% higher than Sep 2016
- Sep 2017 Off SEF gross notional is > $654 billion, 7% lower than Sep 2016
- Overall gross notional was > $2 trillion, 7% higher than a year earlier
- And On SEF vs Off SEF is 67% to 33%, a little higher than average
Next On SEF non-price forming trades; SEF Compression and Rolls.
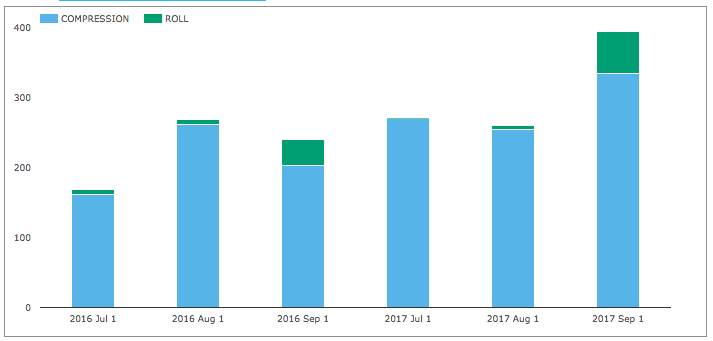
- SEF Compression in Sep 2017 was > $335 billion
- This is 65% higher than Sep 2016
- The highest month in 2017 and second highest ever (after Dec 2016)
- IMM Rolls were > $60 billion
- 59% higher than a year earlier
A decent month for USD IRS in price forming and a great one for portfolio maintenance trades.
USD Swaps Daily Briefing
We now offer a Daily Briefing on USD Swaps price and volume.
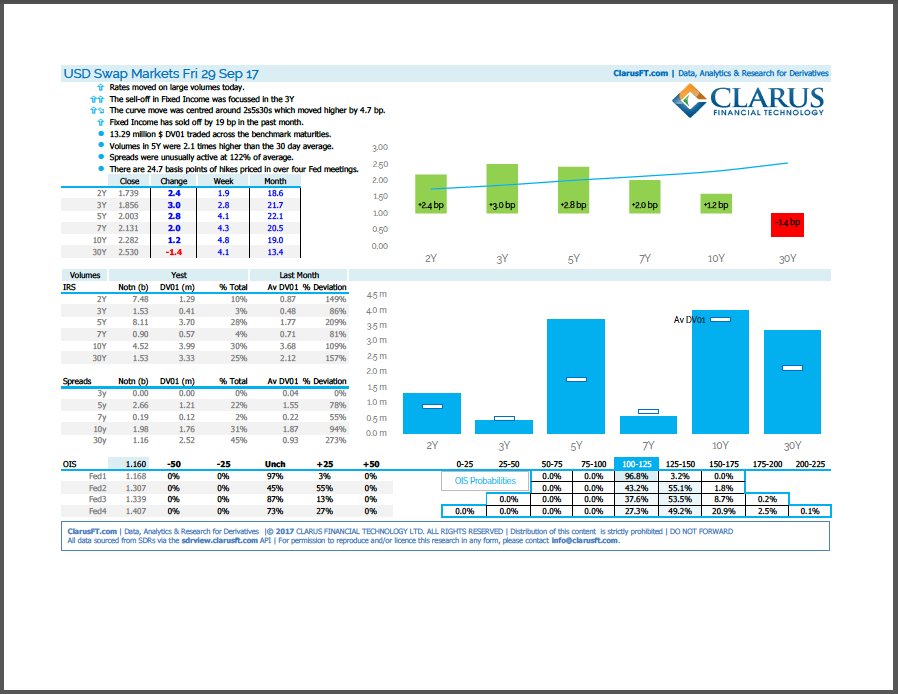
The 29th September 2017 briefing shows:
- USD Swap rates were up in the month
- Volume vs the Monthly Average for major tenors in DV01 terms
- SpreadOver Volumes
- Fed rate forecast
All in an easy to understand format; read and digest a days activity in a few minutes.
You can sign up for a free 14-day trial here.
USD OIS Swaps
Next USD OIS Swaps volumes for outright trades.
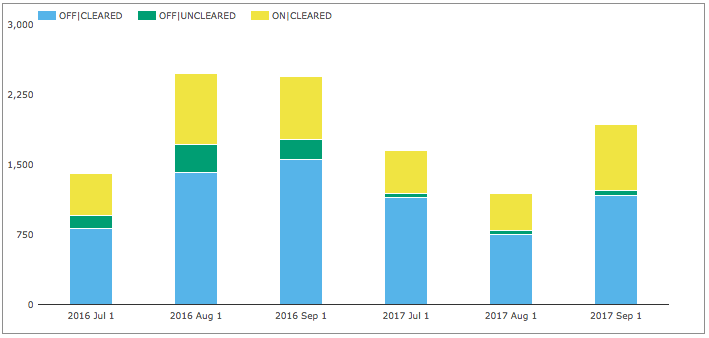
- Sep 2017 Off SEF Cleared gross notional is > $1.16 trillion
- (recall capped trade rules mean these are understated as the full size of block trades is not disclosed)
- This is 25% lower than Sep 2016
- Sep 2017 Off SEF Uncleared is > $60 billion, 72% lower than Sep 2016
- Sep 2017 On SEF Cleared is > $700 billion, 5% higher than Sep 2016
- An overall gross notional of > $1.93 trillion
- Which while higher than July and August is much lower than earlier months this year
Next Roll trade volumes for the six months to Sep 2017.
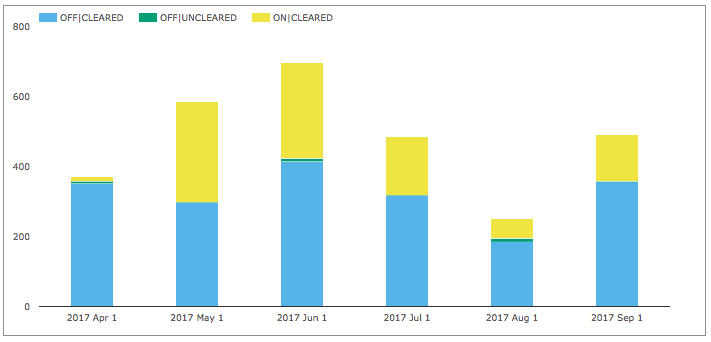
- Off SEF Cleared is the largest in Sep 2017 with > $356 billion
- On SEF Cleared with > $135 billion
- Overall volume is > $490 billion
- Up from August, but below earlier months
Overall Sep 2017 USD OIS gross notional of > $2.4 trillion, very similar to the USD IRS total.
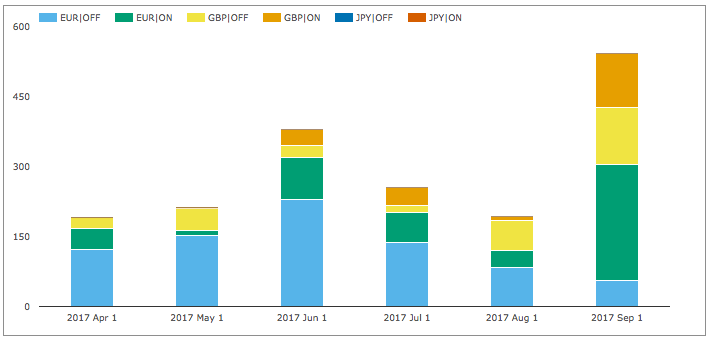
EUR, GBP, JPY Swaps
Next On and Off SEF volumes of IRS in the other three major currencies.
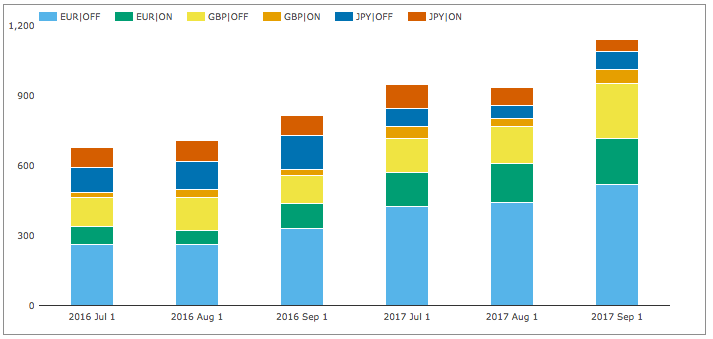
- Volume in Sep 2017 was > $1,140 billion
- 40% higher than Sep 2016
- Large increases in EUR & GBP from a year earlier
- EUR Off SEF is the largest at > $520 billion
- GBP Off SEF is the next at > $234 billion
- EUR ON SEF next with $196 billion
- Overall On SEF at > $310 billion is 23% of the USD IRS On SEF
A much higher portion of EUR, GBP, JPY IRS is transacted Off SEF than USD IRS.
Next SEF Compression activity.
- EUR volume in Sep 2017 is > $107 billion, 174% higher than Sep 2016
- Overall volume in Sep 2017 is > $148 billion
- This is 44% of the USD IRS Compression volume
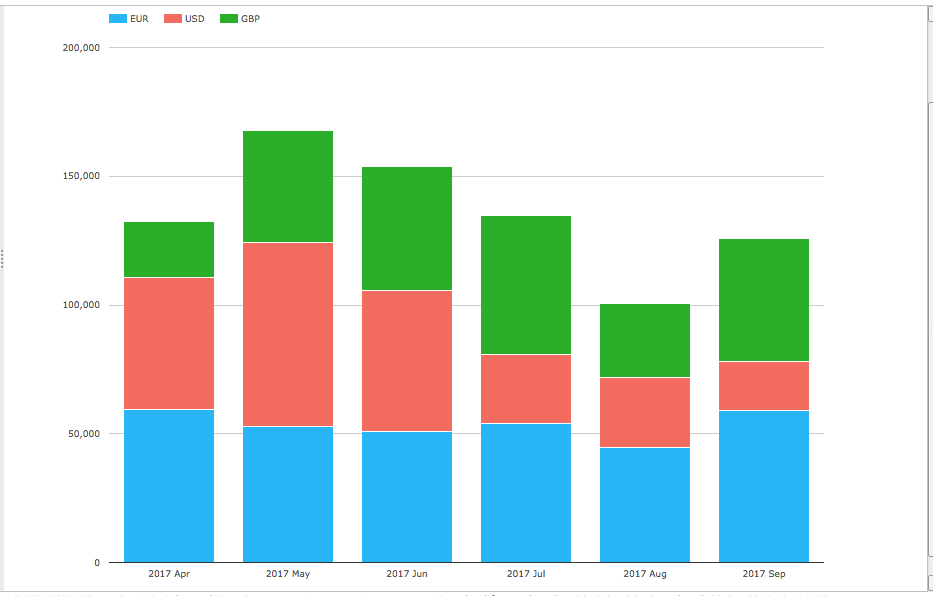
EONIA, SONIA, TONAR
Next lets check how volumes in EONIA, SONIA and TONAR have performed.
First for outright trades.
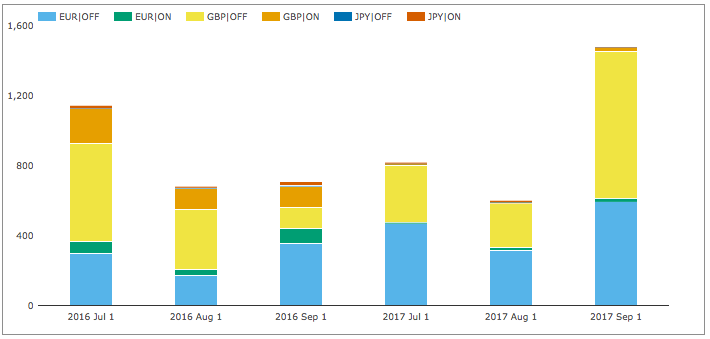
- Overall Volume in Sep 2017 was > $1.5 trillion, 108% up from Sep 2016
- GBP Off SEF with > $840 billion is massively up
- EUR Off SEF with > $600 billion is also up
- On SEF volumes are tiny compared to Off SEF
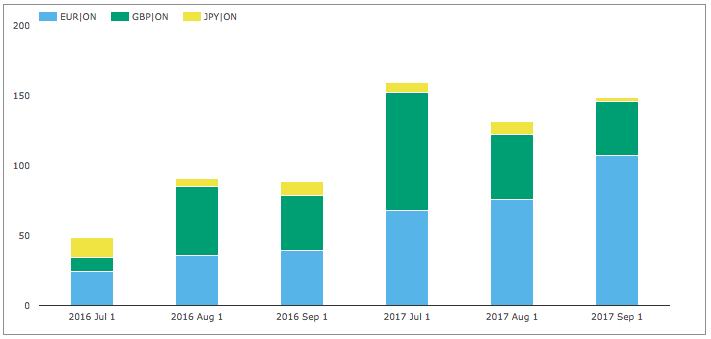
Second Roll trade volumes for the six months to Sep 2017.
- Sep 2017 is by far the highest month with > $540 billion
- EUR On SEF is by far the largest at > $248 billion
- GBP On SEF and Off SEF with similar amounts of $120 billion
In Sep 2017, total OIS volume in EUR, GBP, JPY was < $2 trillion, higher than the $1.3 trillion in IRS.
SEF Market Share
Lets turn to SEFView and SEF Market Share in IRS including Vanilla, Basis and OIS Swaps.
DV01 (in USD millions) by month for USD, EUR, GBP and by each SEF, including SEF Compression trades for the six months up to Sep 2017.
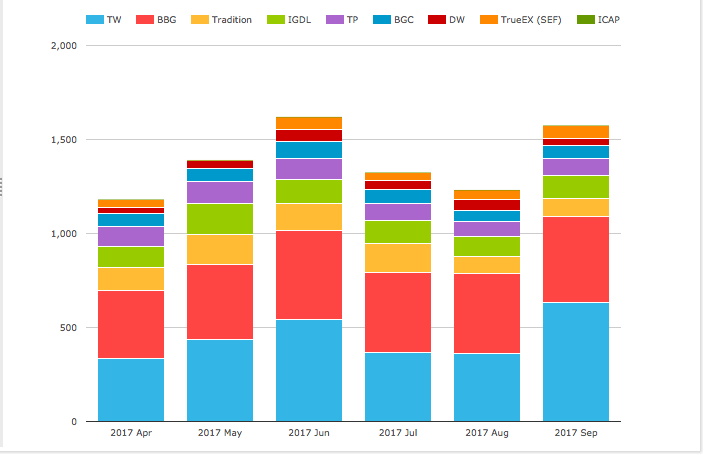
- Sep 2017 volume at $1.58 billion DV01 is up and just below the $1.62b in Jun 2017
- Sep 2017 is the third highest month this year, after March and June (all IMM months)
- Tradeweb the biggest in Sep 2017 with $633 million
- Bloomberg is next with $447 million
- TrueEx has $70 million
- The D2C total of $1.16 billion is similar to the June figure
- Bolstered by strong Compression and IMM Roll volumes
- The D2D total is $416 million and down from $535 million in June
- IGDL the largest D2D with $121 million
- Tradition with $95m is down in particular from $150m in July
- TP with $92m, similar to July but down from June
- BGC with $67 million and Dealerweb with $39 million
CCP Basis Spreads and Volumes
In SEFView CME Cleared Swap volume at the D2D SEFs is CME–LCH Switch trade activity.
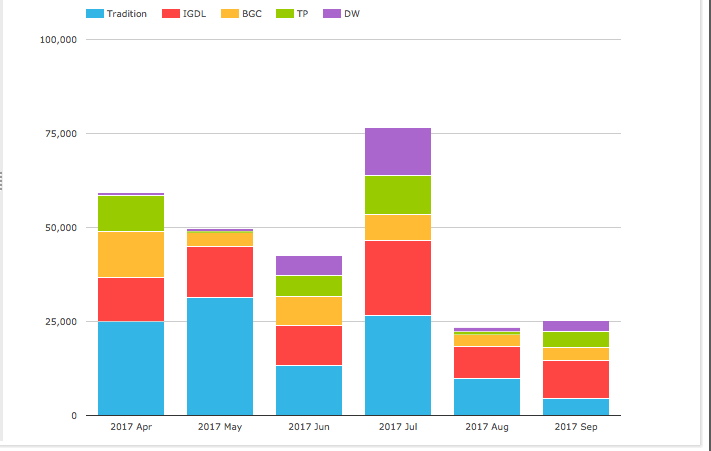
- Overall volume in Sep 2017 was $25 billion, compared to $23.5 b in August
- These two months are much lower than the average of prior months
- Continuing the downward trend since the peak of $96 billion in March 2017
- With July being the exception
- IGDL the largest in Sep 2017 with $10 billion
- Tradition at $4.5 billion is much lower than usual
- Explaining its showing in the SEF Market Share stats (previous section)
CME-LCH Basis Spreads ended the month with 10Y at 2.90bps and 30Y at 3.75 bps, up from 2.40 bps and 3.20 bps on 31st July. The higher spreads not resulting in higher volumes in August and September.
Global Cleared Volumes
Next CCPView and Global Cleared Swap Volumes of EUR, GBP, JPY & USD Swaps (IRS, OIS, Basis, ZC, VNS).
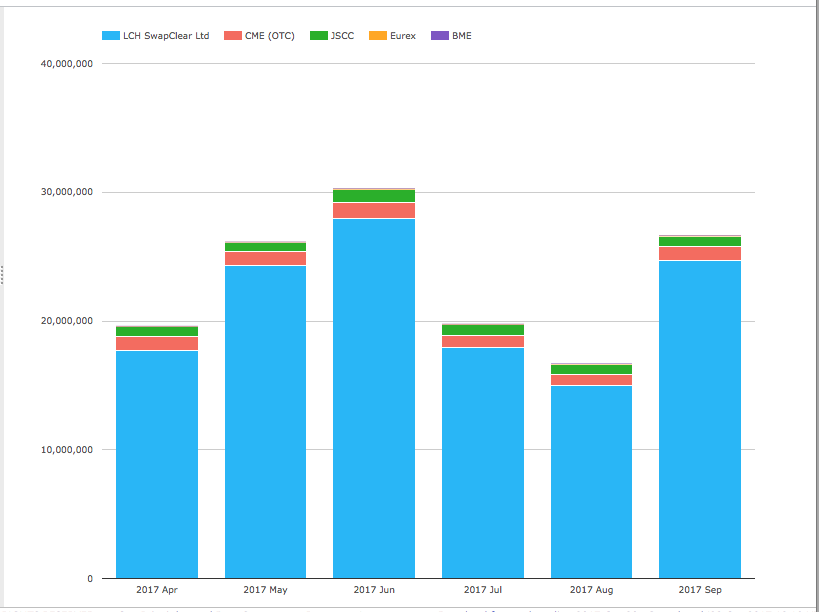
- Overall Global Cleared Volumes in Sep 2017 of $26.6 trillion
- 3Q volumes, much lower than 2Q
- LCH SwapClear volume at $24.7 trillion in Sep 2017, is up 48% from a year earlier
- CME volume at $1 trillion, is down 20% from a year earlier
- JSCC volume at $800 billion is down 20% from a year earlier (in USD terms)
- Eurex with $71 billion, similar to prior months in 2017
- BME with $238 million in Sep 2017
Overall volumes back up after the summer, but still subdued compared to June and March.
Asia and LatAm
Next the volume of AUD, HKD, SGD Swaps (including Vanilla, OIS, Basis, Zero Coupon).
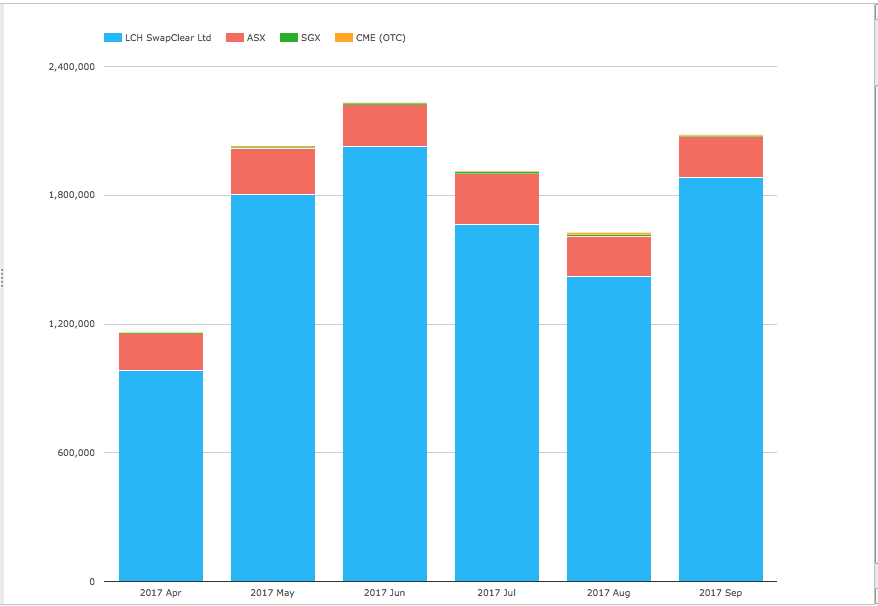
- LCH SwapClear at $1.88 trillion in Sep 2017 is up 68% from a year earlier
- ASX at $192 billion in Sep 2017 is up 14% from a year earlier
- CME at $4.5billion down from $20 billion in Sep 2016
- SGX at $4.5 billion, down from $6.8 billion in Sep 2016
And next the volume of MXN and BRL Swaps.
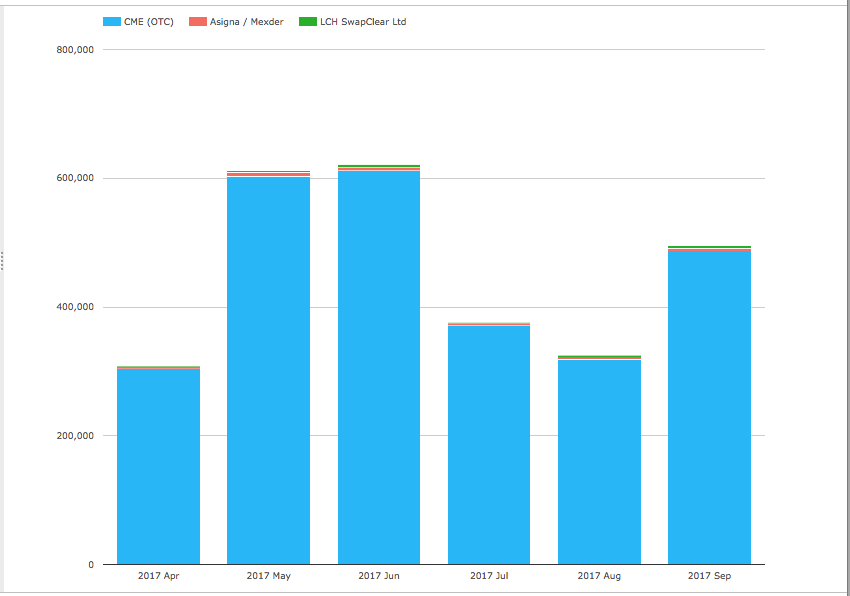
- CME at $487 billion in Sep 2017, up from $316 billion a year earlier
- Asigna/Mexder with $4 billion, down from $4.7 billion a year earlier
- LCH SwapClear with $3.8 billion
Inflation Swaps
Finally lets look at the two products that have gained the most cleared volume from the Uncleared Margin Rules (UMR), starting with Inflation Swaps.
All the volume at LCH SwapClear with $126 billion in Sep 2017, EUR the largest, followed by GBP.
Non-Deliverable Forwards
And last but by no means least, NDFs.
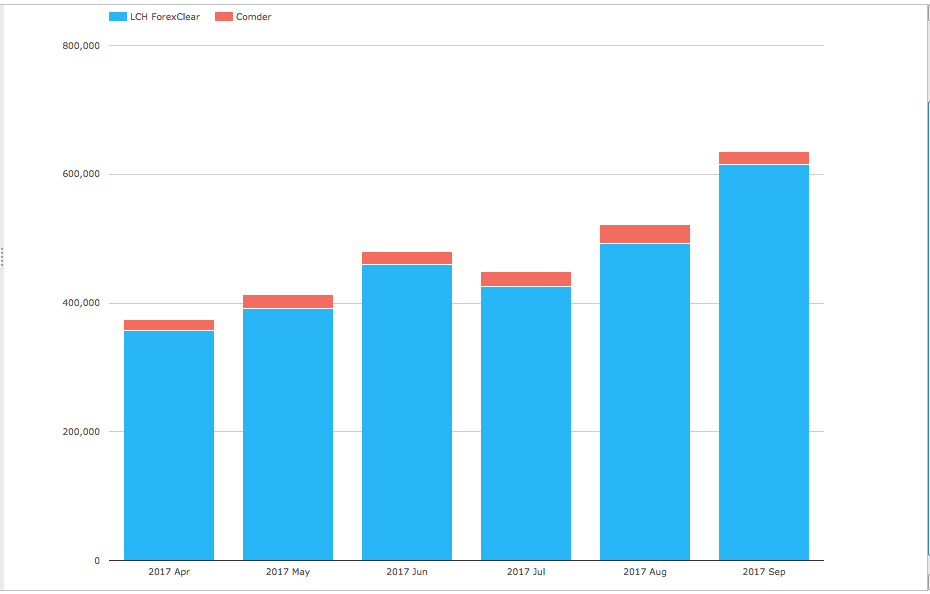
- LCH ForexClear with $615 billion in Sep 2017, a new high from the $492 billion in August
- Comder with $20 billion
That’s it for today.
Thanks for staying to the end.
Our Swaps review series is published regularly.