US Treasury Swap Spreads (“Spreadovers”) are a significant portion of the Swaps market. Up to 1 in 5 trades are identified as a Spreadover, which helps us understand the SDR trade universe in even more detail. As a result, the curated Clarus data now augments over half of all trades from SDRs to enable greater transparency.
We continue to refine our trade-identification process at Clarus, and this past month I’ve been looking at Swaps that trade as a spread over an underlying US Treasury bond. Typically I refer to these as US Dollar Swap Spreads, which is also consistent with CFTC terminology. However, seeing as I’ve written so much about Butterflies and Spreads already – when looking at swap vs swap transactions – let’s make the distinction crystal clear and refer to these swaps as Spreadovers.
In essence, what I’m now doing is identifying Spreadovers from our “leftovers”. As we’ve looked at before, anything between 25 and 30% of DV01 traded on a given day can be assigned to a maturity switch, a butterfly or compression activity. Treating these Package trades as a separate data-set leaves us with a cleaner universe of trades which then improves data mining prospects.
Perspective
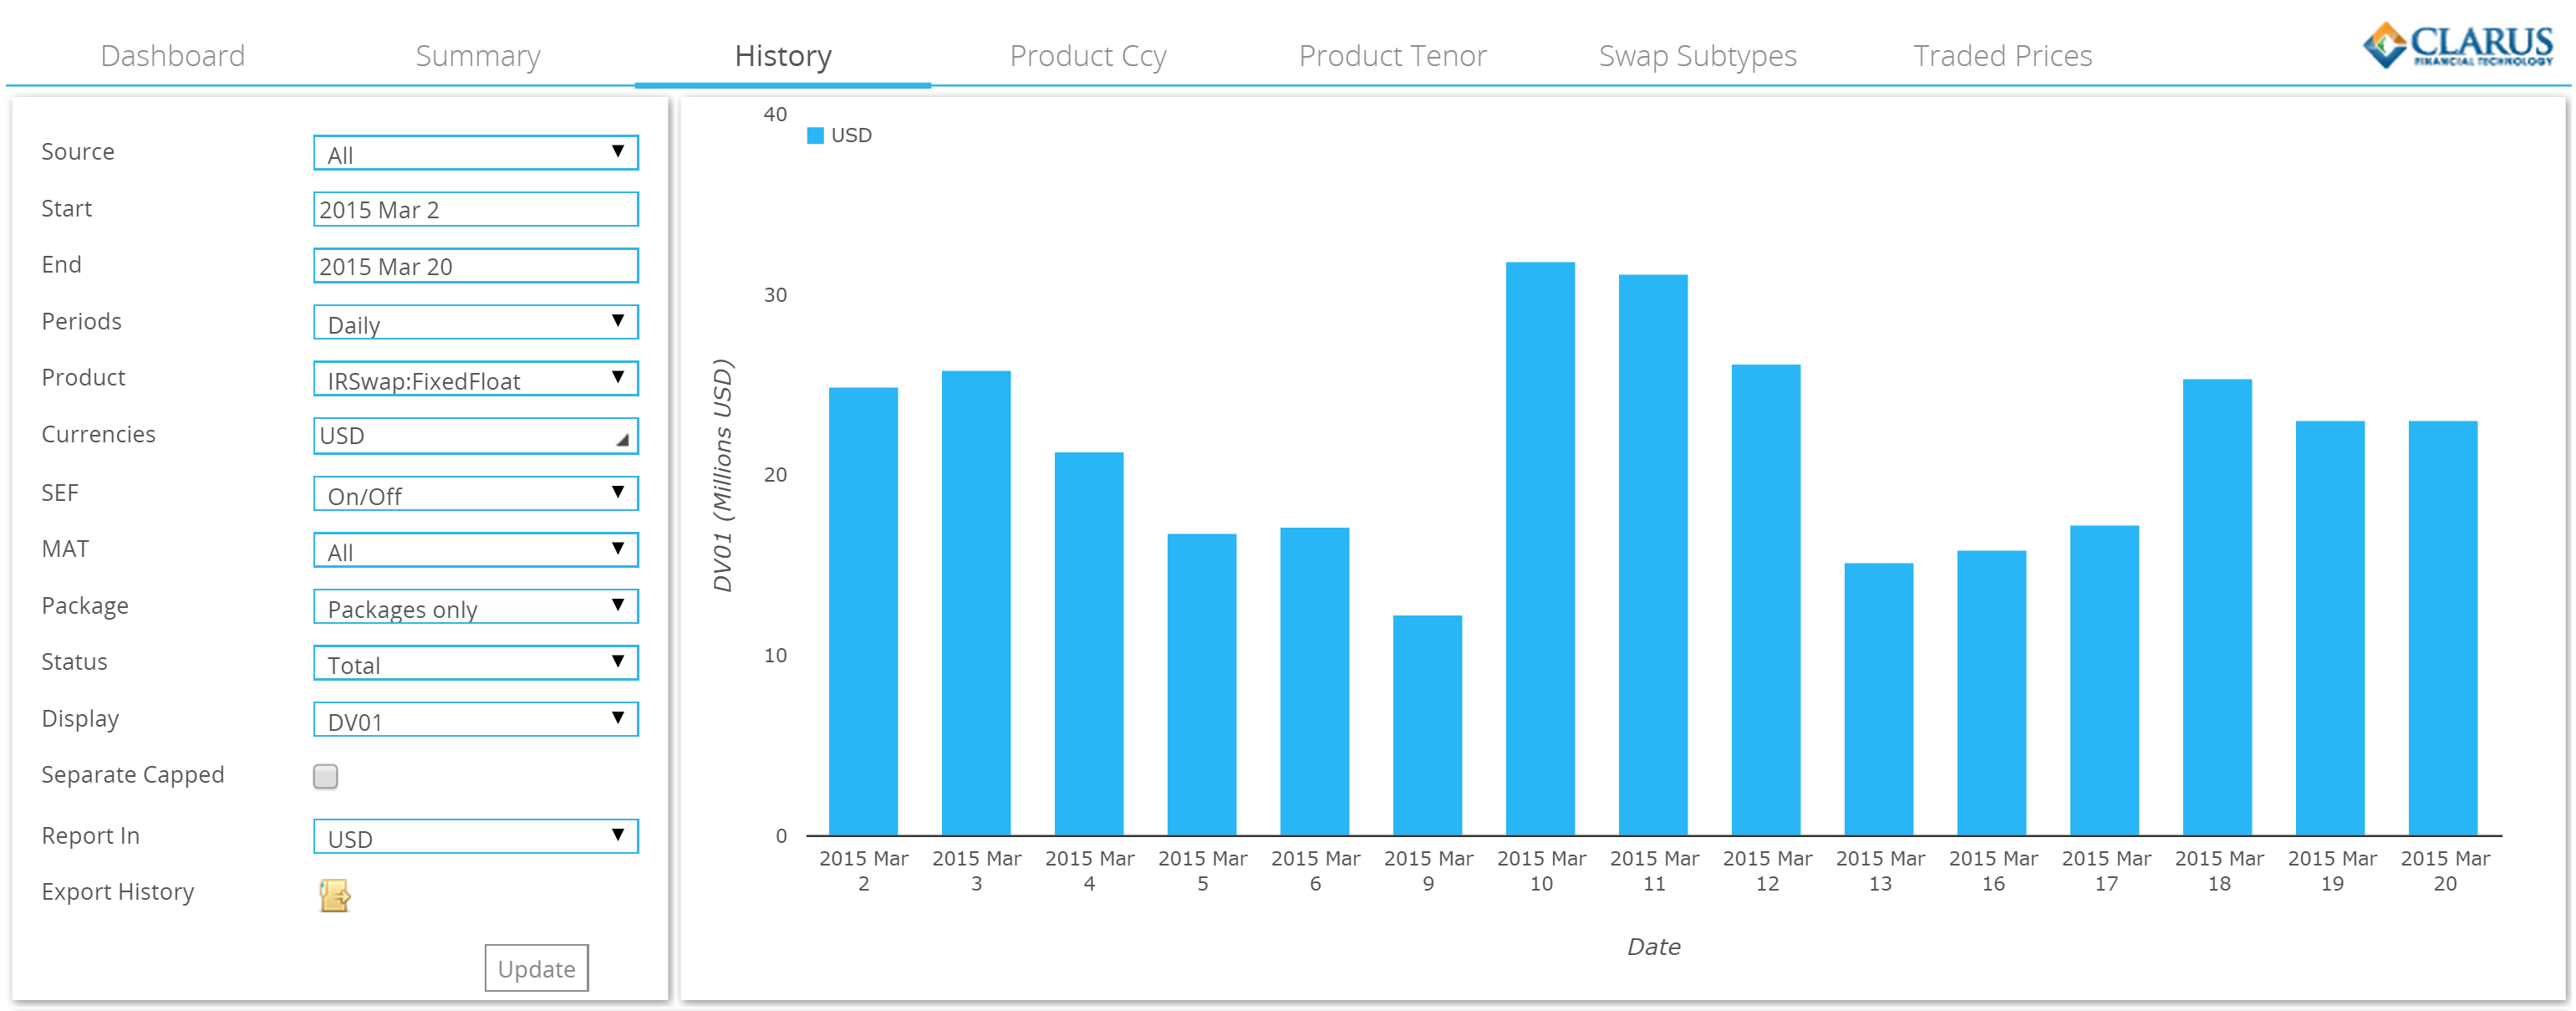
One of the notable aspects (of many!) within the SDR data is just how volatile the numbers are. Using SDR Researcher, we can now look at Package transactions only. During March, we see that the activity ascribed to Compressions, Spreads and Butterflies (“Packages”) was pretty volatile day-to-day when looked at on a DV01 basis:
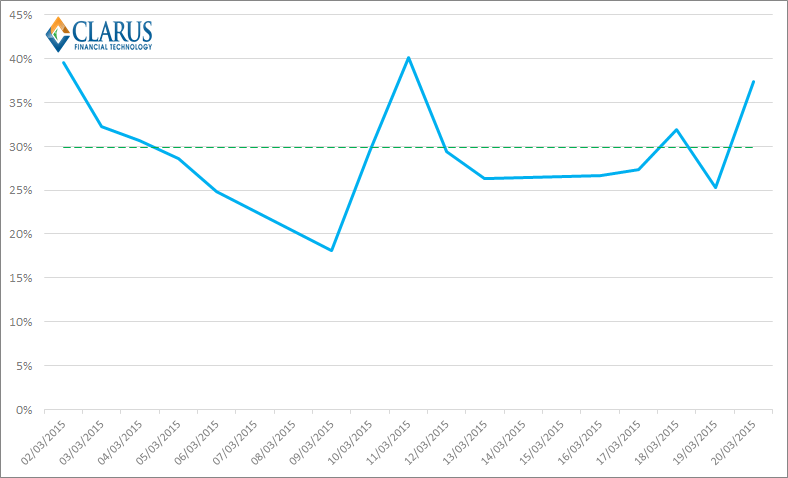
If we then export this data and look at it versus the total DV01 traded per-day, we also see that the proportion ascribed to Packages varies considerably – from a low of 18% to a high of 40%:
Only being able to “explain” 18% of trades on a particular day is pretty frustrating. From experience, I know that the Swaps market sees plenty of trades on the back of other instruments, so it feels wrong that over 80% of risk is traded on an outright basis. I therefore went looking to see what else is lurking in our non-package transactions.
The answer was obvious because it is one of the most highly traded sectors of the market – Spreadovers.
Spreadovers
For the purposes of this first cut of data, I consider any swap that I think may be traded versus a US Treasury (but that isn’t already assigned to a Package). The process has a few steps, but is similar in methodology to Tod’s first pass from last year, which you can read about here. I decided to drill-down into the first ten trading sessions of March because they covered the highs (40%) and lows (18%) of our data-series above. For these ten trading sessions, we see the following descriptive statistics:
Spreadovers as a percentage of total DV01
As you would expect, Spreadovers are a significant portion of the market. Across these ten days, Spreadovers:
- Were as high as 18.9% of DV01 traded on a given day and
- as low as 10.4%.
- Averaged 13.2% of daily volumes
To put this in perspective, Spreadovers are therefore a larger proportion of the market than either Spreads or Butterflies. Whilst Compression trades may make up more of the market on any given day, they are very volatile and tend to occur in batches, and hence are more akin to portfolio maintenance exercises.
Spreadovers as a standalone market
During our observation window, we saw:
- A high of $12.7m in DV01 trade during a single day
- A low of $6.9m
- An average of $9.6m per day in DV01.
We saw the highest DV01 in Spreadovers trade on 9th March. Surprisingly, this was a Monday and hence not on a day when a Treasury auction took place. Only time will tell whether this is a feature of the Spreadovers market, or if this was simply a delayed reaction to the March 6th payrolls release.
Spreadovers Maturity Profile
The maturity profile is closely aligned with our observations of the swaps market as a whole, with 5 years, 10 years and 30 years being (by far) the most significant maturities. During our observation window:
- 72.8% of Spreadovers DV01 traded in either 5,10 or 30 years
- 10 year Spreadovers were the most traded by DV01 on every day bar two
The maturity profile that traded can be seen below. Each different coloured bar represents a different maturity, and the stacked total of each column is the total DV01 that traded each day.
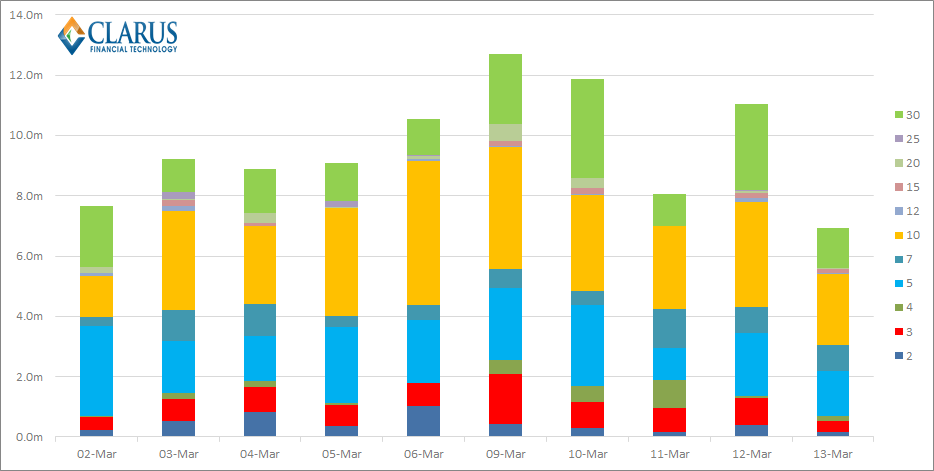
If we again refer back to the US Treasury auction calendar, we should not be surprised that 12th March was a significant day, coinciding with the 30-year bond auction.
All Package Trades
We can now look at Spreadovers in relation to their “peers” – the other Package transactions that we already identify. As we have written about (at some length!) the economics of transacting these swaps can be different from an outright, therefore it makes sense to separate the universe of swaps to the extent possible. Therefore, let’s look at the ten trading days in terms of total DV01 and the percentage traded as part of a Package:
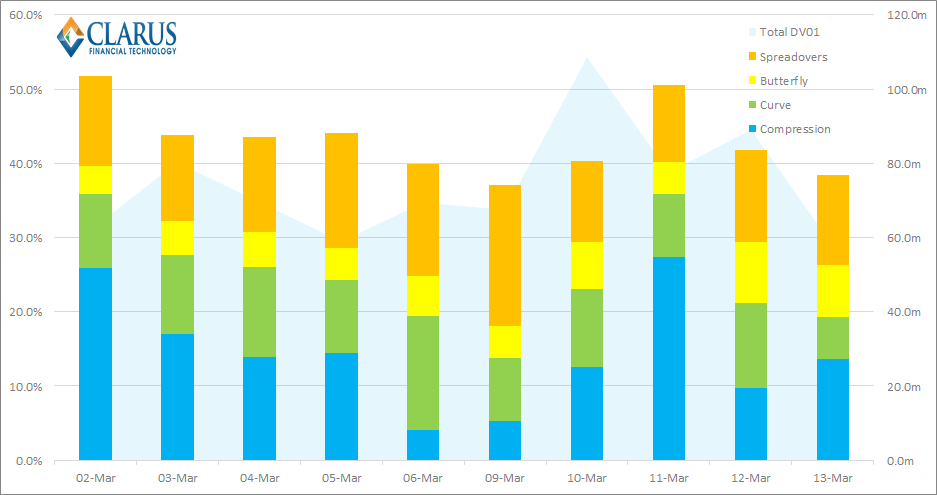
We still have a volatile time series here, but we can now show that:
- A high of 51.8% of all trades were done as part of a package
- A low of 37%
- On average, 43.1% of all DV01 traded is part of a Package transaction
I think most people would agree, this feels closer to “the truth” than our previous low of just 18% of volumes being part of a Package.
Is that it for Packages?
Close, but not quite. I think it is highly unlikely that the percentage of DV01 traded as part of a Package is consistent between trading days (e.g. always 60%). However, it should always be our goal to “explain” as great a percentage as possible of all trades coming into an SDR. I am therefore naturally drawn to the non-package trades we still have. (Admittedly, at some point we have to bow to the market gods and accept that if prices can move in surprising ways on a day-to-day basis, then so can volumes. But we are not there yet.)
It is therefore worth noting that the above analysis ignores two aspects of the market:
- IMM roll. March 18th was fast approaching during our observation period, and we would normally expect to see a number of delta-neutral Packages that “roll” positions between March and June. All else being equal, we would therefore expect to see an increase in total DV01 traded as we approach the IMM date.
- Other Package transactions. The most obvious example being a close relation to Spreadovers – Invoice Spreads (i.e. a swap versus a Treasury future). See Tod’s analysis here for more on that.
Utility vs Volatility vs Analysis
Spreadovers are a significant portion of the daily traded volume across the US swaps complex. As such, it is useful to be able to analyse their volumes independently from curve trades, compression and outrights.
In addition, anyone using the SDR data must recognise that over half of all trades reported are not transacted as an outright. This means that their volume and price data do not necessarily relate to their trade coupons. This is simply because they are transacted as part of a package. It is vital, therefore, to curate the incoming data in a meaningful manner. This applies if you are using SDR data to analyse historic trends, build a curve, drive predictive analytics or just simply trying to understand the markets.
Regular readers will be aware that we continue to harbour the assumption that volatility drives volumes . Now that we can identify Spreadovers, we can refine our trade universe even further. This, in turn, will allow us to improve the quality of analysis and improves our ability to test hypotheses such as these.