- Clarus data now includes the implied Spread to the nearest on the run US Treasury bond for spot starting USD interest rate swaps.
- These so-called Spreadover trades make up over 10% of the USD derivatives market.
- Analysing price action and volume trends in these packages highlights important market insights, which can be explained by seasonal trends in bond issuance.
A New View of Spreadovers
Late in 2016, we revamped our Spreadovers identification process. This enables us to more accurately identify interest rate swaps that are traded versus a US Treasury bond. This change has enabled a number of new features in our SDRView Pro screens:
- We now calculate the spread to the underlying bond, enhancing the available price information.
- We provide High, Low, Last and Average Price of the Spread itself, not only the Interest Rate Swap.
- Spread of Spreads are now captured, denoted as SpreadCurve and SpreadFly package types.
- We provide a compressed ticker view of all trades – very handy to monitor markets intraday.
Spreadovers account for over 10% of the Market
We decided to revamp our efforts with Spreadover trades because they continue to be a very significant part of the market – despite an extended stay in negative territory. Below is the week-by-week history of Q3 2016:
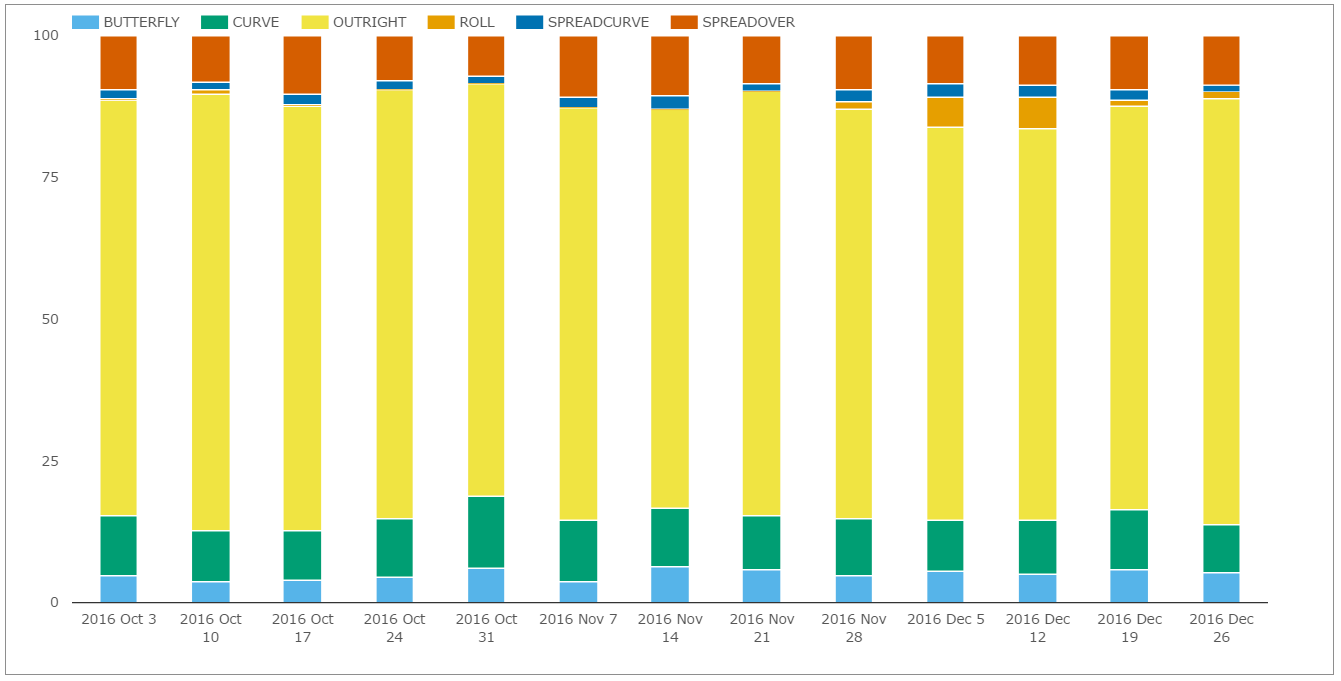
Showing;
- On a DV01 basis, the split by trade type per week of USD Interest Rate Swaps from SDRView Researcher.
- This measure is package adjusted, meaning that we only include the DV01 of a single leg of a Spread or Butterfly package.
- Outrights are the most significant portion of the market, accounting for between 70 and 75% of volumes.
- Spreadovers (including Spreadcurve trades) are the second largest by volume, accounting for up to 13% of volumes and averaging nearly 11%.
- Curve trades (maturity switches) are next, averaging 10% of volumes. Butterflies tend to account for 5%.
- We exclude Compression trading as we want to compare like-for-like price-forming transactions.
Spreadovers in SDRView Pro
Our intraday view of markets in SDRView Pro has been enhanced with these changes to the Spreadover identification algorithm. We now see the following:
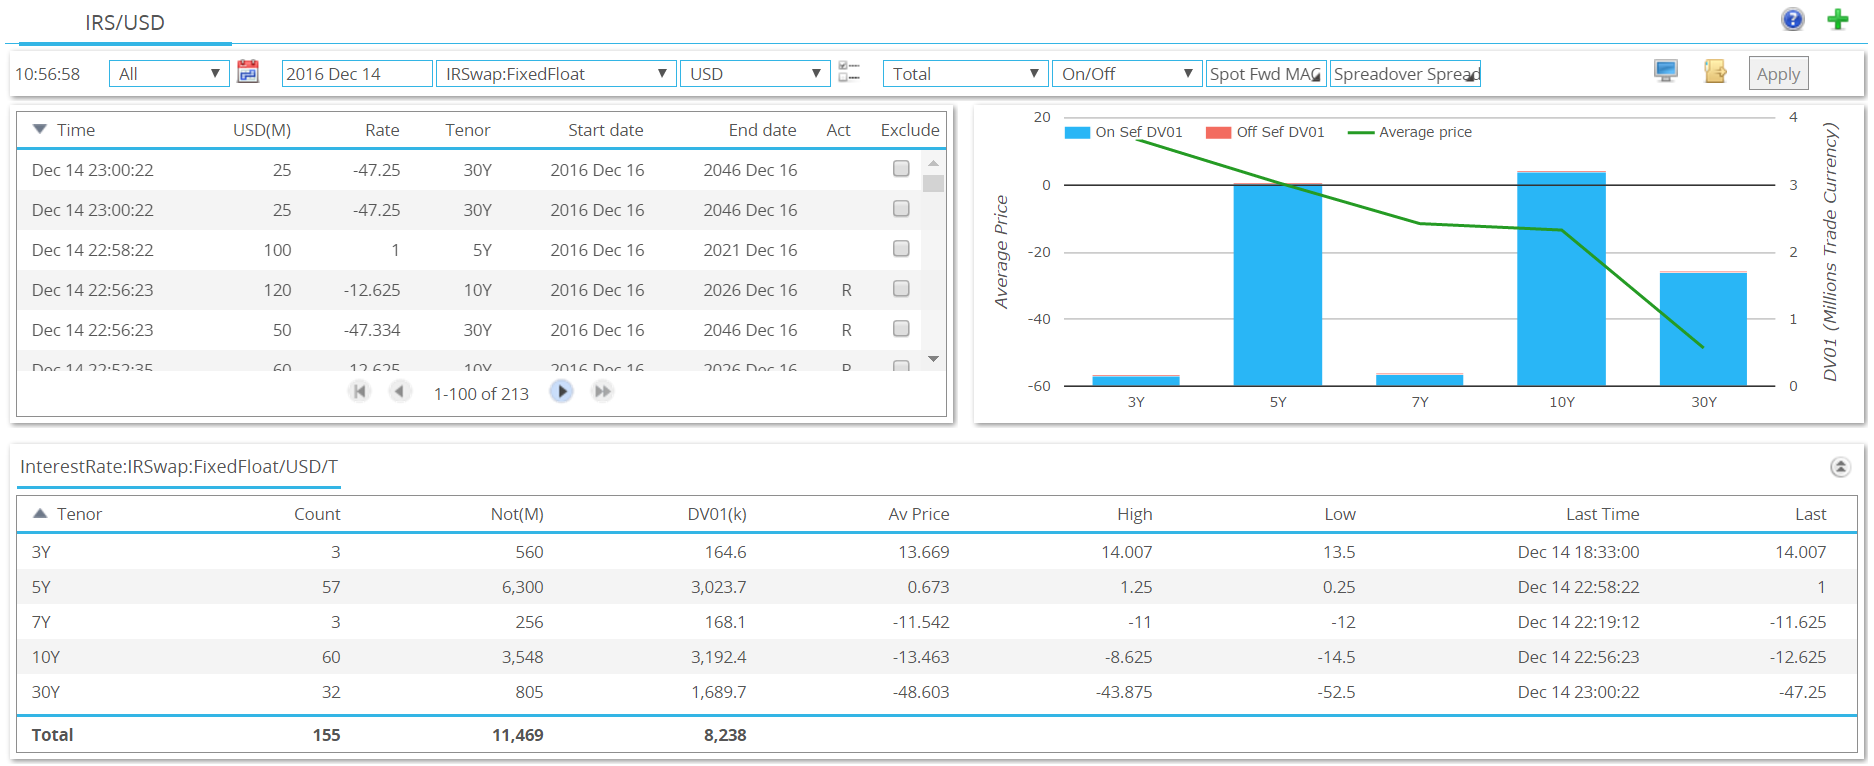
Showing;
- The top left panel details each trade. Full terms of the trade are available by clicking on the record.
- The top right chart shows the spread over the appropriate UST for each maturity that has traded along with volume in DV01 terms. We can see that as of mid-December, the Spreadover curve was negative from 5 years on. As of writing today, 5 year Spreads have moved higher to around +4.25bp.
- The bottom panel provides summary statistics for each maturity that has traded. This includes number of trades, overall size in both notional and DV01, as well as the price metrics High, Low and Last.
- Each individual trade record is accessible by drilling-down on any of the numbers or chart elements in each panel.
- And of course, all of our data remains available for export in a “what you see is what you get” format.
Ticker View
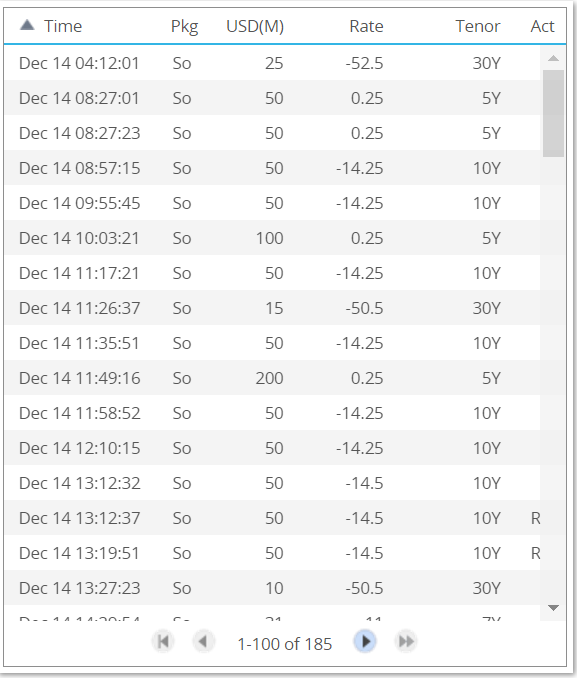 We also now offer a condensed “ticker view” of trade activity, which works well as a single tab in a browser or as a side-bar. It simply shows:
- Time
- Package Type – the screenshot is filtered to only show Spreadovers.
- Notional size in USD millions.
- The price. When Spreadovers are selected, this defaults to the spread price.
- The tenor.
- And finally, whether the report was a cancel, replace or new trade.
- This list can of course be filtered by our normal parameters.
Spreadovers – what is going on?
We can’t resist having a look at what has happened recently in Spreadovers given these enhancements to the data.
Showing;
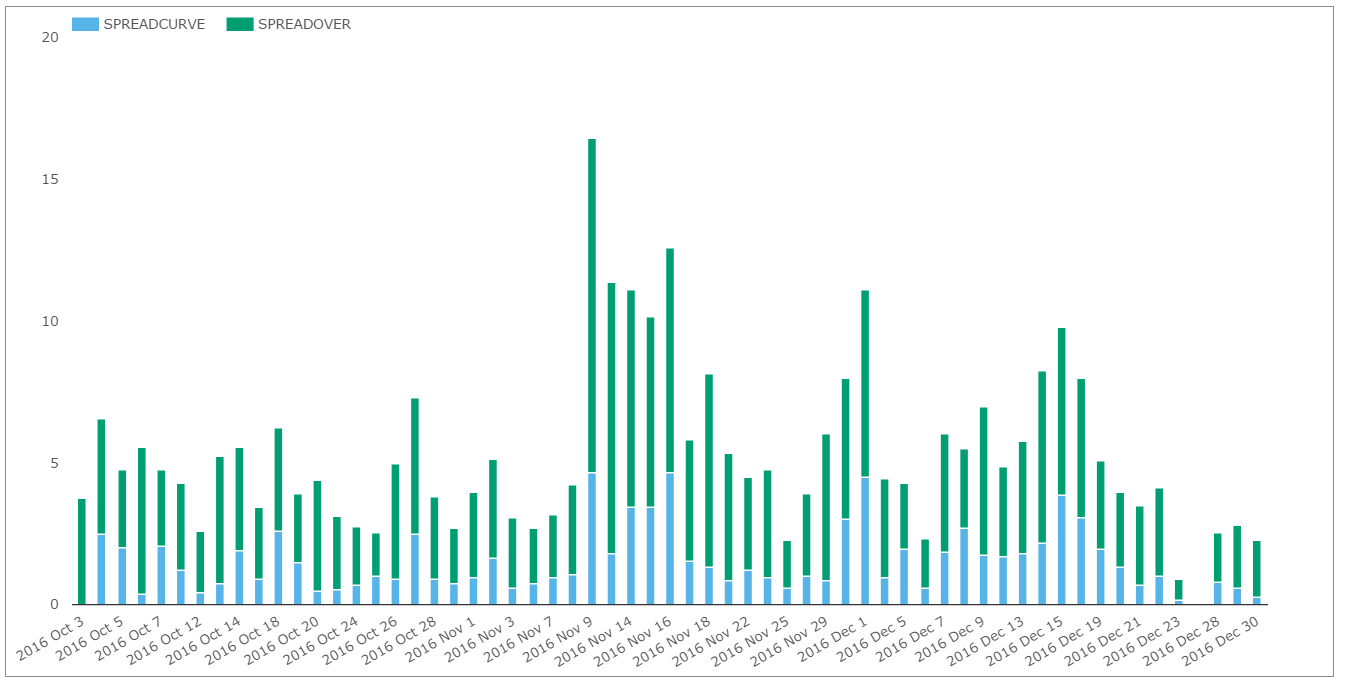
- Daily volumes in DV01 of Spreadovers and Spreadcurve package trades.
- Average Daily Volume was $5.5m of DV01, or nearly $8bn in notional.
- The largest day, at $16.5m of DV01, was November 9th (Election Day). That day saw over 3 times the average daily volume trading.
- That stands-out far more than the action in Outrights. Election Day only saw 2.2 times the average trading activity in Outrights.
- Generally, Swap Spreads have headed higher (less negative) recently.
- 5 year Spreadovers traded over 600 times in the month of December. Having opened the month at -1bp, they traded as low as -1.25bp before trading into positive territory by the end of the year. They now stand at +4.25bp.
- It is a similar story in 10 years. 10 year Spreadovers traded over 600 times. Having opened the month at -16bp, they traded as low as -16.5bp before trading higher into year-end. They now stand at -11bp, having traded as high as -7.125bp before Christmas.
- The underlying UST curve has steepened – as noted by Amir in his Swaps Review – and 30 year Swap Spreads have been on quite a ride. They traded over 280 times, starting out at -55 basis points. They traded as high as -41.375 bp, before coming back. They now stand at -48.5bp.
Seasonality is a large driving force in Spreads. Every year, there is a significant pipeline of bond issuance at the beginning of January, that tends to lead to strong receiving pressure in Interest Rate Swaps. It is therefore not a surprise to see Swap Spreads hitting a peak in the week before Christmas, only to run into this seasonal resistance.
It is great to see this seasonality present itself in the public data. This price action in Spreadovers can even give us some hints as to the likely maturity profile of the upcoming issuance. Given that 5 year spreads have not contracted anywhere near as much as 10 year and 30 years, it suggests that the initial large deals are more likely to be between 10 and 30 years in maturity.
In Summary
- We have revised our Spreadovers identification algorithm.
- Clarus therefore now provide more accurate price information and improved trade identification of the public SDR data.
- This allows us to analyse Spreadovers in more detail.
- Already, we can see that Swap Spreads have started to contract as we enter the January issuance window.
- It will be interesting to see how far this seasonal contraction can go in the face of a repricing of fiscal policy.