There has been much comment on the market moves in the US Treasury market on October 15, 2014. Our article Swaps and the Flash Crash described what we saw in Interest Rate Swaps. So I thought it would be interesting to look at what this period of market stress and higher volatility means for Cleared Swap Margin requirements.
And the procyclicality in the title? Well this is a reference to the fact that margin requirements are higher in times of market stress and lower in calm markets. For those of you interested in more detail, I would encourage you to read the Bank of England Financial Stability Paper No 29 – May 2014, which provides an excellent discussion and analysis on this topic.
Price Volatility on 15 October
As Chris notes in the Swaps and the Flash Crash article, Swap prices fell 18 basis points on the day.
However we know that for Initial Margin determination, Clearing Houses use 5-day returns, which means we are interested in how much prices moved over 5 business days and not 1-day. Using SDRFix we can see this as:
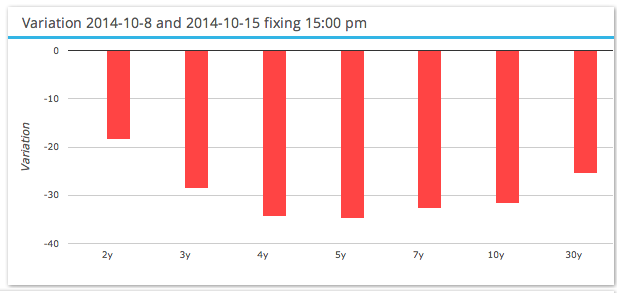
So greater than 30 bps falls in the middle part of the curve, in-fact almost 35 bps for 5Y Swaps.
An Example Portfolio
Lets assume our portfolio has just a single 5Y Swap paying fixed at par of $100m notional, cleared at CME.
If we held this portfolio on 8 Oct, we know that by 15 Oct, this position would have resulted in a Loss of 35 bps times the DV01 of the portfolio. Assuming DV01 is $46,000, we would have lost $1.6 million over these 5 days.
Of-course our Variation Margin (VM) would have varied day to day, with over half the overall loss being on 15 Oct, given the 18 bps move on this day alone, while over the 5-days our cumulative VM would have been $1.6 million.
Determining VM is easy as it is just DV01 times the move in basis points and even for a real portfolio all we would need is the DV01 by tenor and we could do a similar calculation to estimate the VM.
Initial Margin Change
However Initial Margin is much harder to estimate. We need to be able to run the CME margin calculations over the period of interest.
Lets use CHARM to calculate this for our 5Y Par Swap on 8 Oct, assuming this is a client trade cleared at CME.
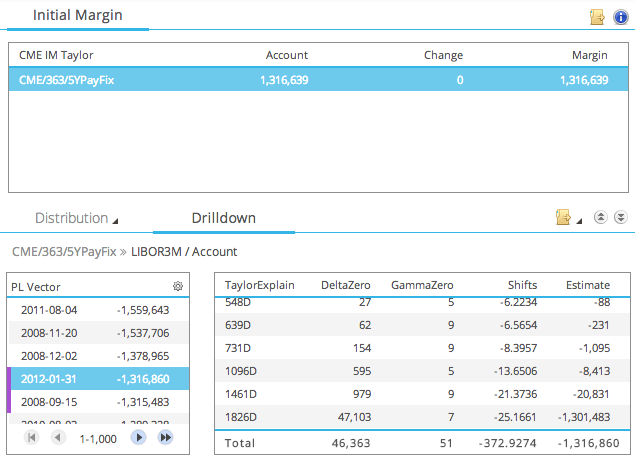
Which shows:
- The IM for our trade is $1,316,639
- The worst 5 scenarios are dominated by three dates in 2008; 20-Nov, 2-Dec and 15-Sep.
- The other two are 4-Aug-11 and 31-Jan-12
- The fourth worst loss (31-Jan-12) is high-lighted and shows a -25 bps implied move in the 5Y (1826d)
Lets do the same again, but this time for a 5Y Par Swap on 15-Oct.
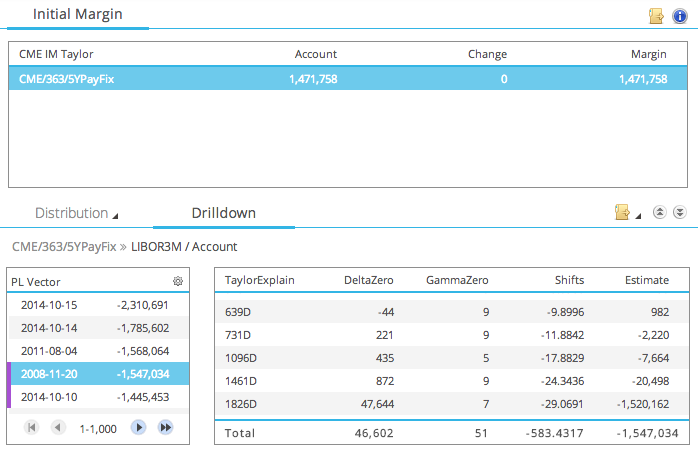
Which shows:
- The IM for our trade is now $1,471,758
- An increase of $155,000 or 12% from the earlier value
- The worst 5 scenarios are now dominated by three dates in Oct 2014
- 15-Oct-14 has the largest loss, followed by 14-Oct-14
- Remember as overlapping 5-day periods are used, a large 1-day move can impact up to 5 scenarios
- In-fact the sixth largest loss is also in Oct 2014 and is 13-Oct-14.
- Only one 2008 scenario remains, that of 20-Nov-08
- This is now the fourth worst and shows an implied move of -29 bps in the 5Y (1826d)
- Also noteworthy is the fact that there is a new worst loss scenario of $2.3m compared to $$1.5m!
So we can see how momentous the market events were in the week of 13 Oct and how crucial in determining IM. Granted as these moves were more recent, they are given more weight in a Historical Simulation with exponential decay and volatility scaling.
Any portfolio with positive DV01 would have seen an increase in Initial Margin over this period. Of-course a portfolio with negative DV01 (received fixed) would not show such a significant change in IM as the large shocks are to the downside.
Our example shows that the CME margin model is procyclical as margins increased in stressed markets and as importantly did not increase massively, which would have only served to possibly further re-enforce the stress.
However who would have believed that even in this low interest rate environment, we would see extreme shocks downwards. Surely we were all assuming large shocks to the upside as the Federal Reserve started on its path to higher interest rates. A case of fact being stranger than fiction.
LCH SwapClear Margin
Using CHARM we could also perform the same analysis for LCH Cleared Swaps.
And we would expect to see slightly different behaviour given the differences in methodology e.g. Expected Shortfall and Absolute returns.
But as time is short, you will have to take my word for this or send me an email to get the details.
Stress Testing of Variation Margin
Given in one week we have had such large market moves and these have resulted in significant changes in VM and IM, we believe it is vitally important that firms run regular periodic Stress Tests on their margins.
After-all it is the liquidity required to meet large margin calls that has been the down-fall of many a firm in a market crisis (I will leave you to fill in the names …)
Using CHARM, we can run daily/weekly/monthly stress tests on VM, as below:
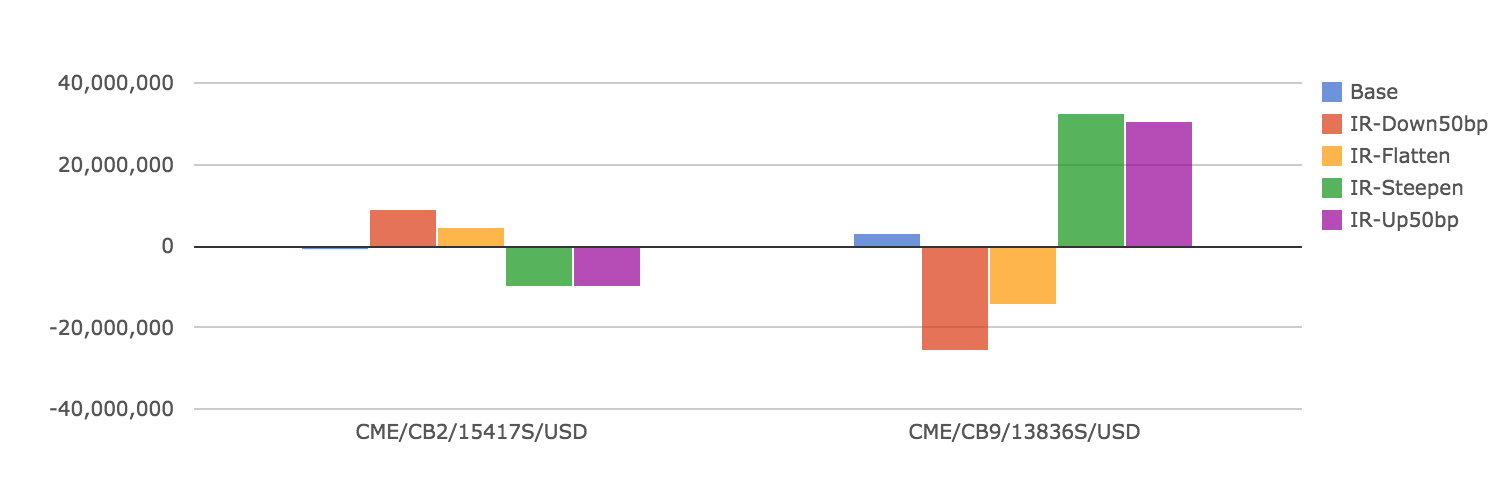
Which shows:
- Two accounts at CME with different Clearing Brokers
- Base VM and Four Stress Scenario VMs
- Namely: Down50bp, Flatten, Steepen and Up50Bp
- Steepen showing the largest negative VM for the first account
- Down50bp the largest negative VM for the second
Stress Testing of Initial Margin
Similarly it is just as important and more difficult to run daily/weekly/monthly stress tests on IM.
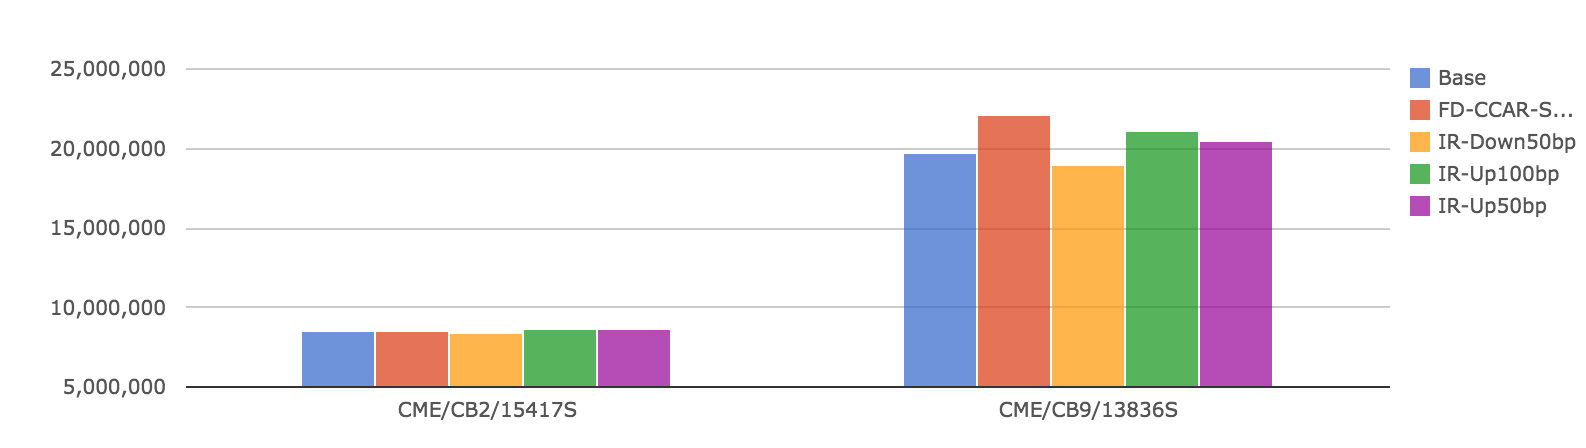
Which shows:
- Base IM and Four Stress Scenario IMs
- Fed Reserve CCAR Severe, Down50bp, Up100bp and Up50Bp
- The first account shows little change in IM
- The second shows the largest increase in the Federal Reserve CCAR Severe scenario
The changes in IM are far less than VM, which is as we would expect given that VM is simply a mark-to-market change while IM is designed to be a stable but responsive risk measure.
However it does depend on our assumptions for the stress scenario.
The simple impact is that market prices changes, so the mark to market of the portfolio change and consequently the PLs in our distribution change.
The complex impact is that such large stress shocks may end up as one of the tail scenarios that determine IM. In-fact if the market bounces right back the next day, as often happens, we could assume that only one tail scenario is introduced. However if the market stays at the new level, as sometimes happens and happened in the week of Oct 13th, we could see two or three new tail scenarios. (If I have lost you and you care about this level of detail, please email me and I will endeavour to explain further.)
Summary
The week of 13-17 October saw very large moves in Swap prices.
The 5Y Swap rate dropped 35 bps in the 5-day period ending 15-Oct.
This resulted in portfolios with positive DV01 having to cover VM losses and facing a higher IM requirement.
Our example of a 5Y 100m pay fixed client trade cleared at CME, shows a 12% increase in IM. The increase in IM can be explained by new Oct 2014 scenarios entering the loss tail and replacing 2008 scenarios.
Given such change, firms should run regular stress tests on margins. Stress tests on VM are relatively straight forward and available in most market risk systems. Stress tests on IM are much more complex and not commonly available.
CHARM can run stress scenarios on both VM and IM.
Do you know what margin calls you may have to meet in the event of market stress shocks?
We sincerely hope so. The safety of your firm and possibly the whole market depends on it.
It’s also interesting to note that the ECB had the largest MRO allotment this week since they cut rates. Have banks borrowed at the MRO to fund increased IM at the clearing houses? It certainly seems the cheapest way to raise funds.