In my recent articles Bloomberg SDR and SEF and Interest Rate Swap Prices, D2C vs D2D, I looked at different aspects of the data now available to us.
In this article I am going to show that we can get an interesting insight into Swap Curve and Swap Butterfly trades. (Thank you to one of our regular readers for pointing this out to us).
For a re-cap on these Package trades, see the article SEF Packages, Swap Curve Trades.
Lets Start
In SDRView Professional, lets select BBG, 13-Jun-2014, IRS in USD, Libor 3M vs 6M, Cleared, On SEF and view the trade blotter.
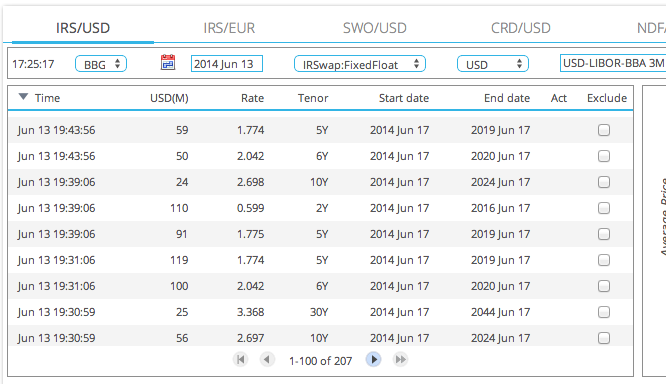
This shows the list of trades reported by BSEF to BSDR, from which we can see:
- Two trades with the exact same time-stamp of 19:43:56.
- Three trades each with the same timestamp of 19:39:06
We can assume that the first is a Swap Curve 5Y/6Y and the second a Swap Butterfly 2Y/5Y/10Y. The notionals further corroborate our assumption as they are as we would for each component of the package.
Swap Curve and Swap Butterfly
Lets now go through the full list of 207 spot starting trades, looking for the exact same timestamps.
We find that 70 trades can be attributed to 35 Swap Curve trades and 57 trades can be attributed to 19 Swap Butterfly trades.
Meaning that only 80 out of 207 or 39% of trades are outright Swaps. So certainly in trade count terms the Curve and Butterfly trades are very significant. (Our method means that we might be erroneously count a few outright swaps executed at the same time-stamp as curve or butterfly, but this not likely to make a material change to our statistics.
What about in terms of gross notional? Lets sum the notionals of each of these categories.
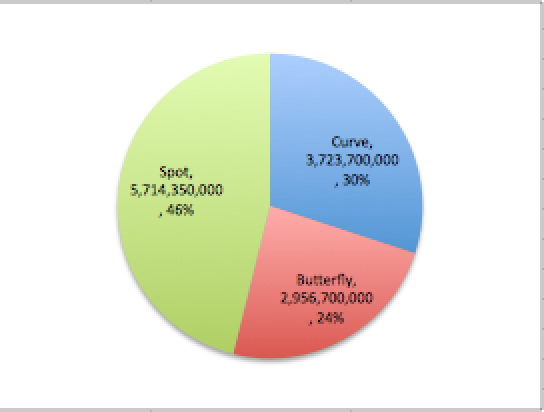
Which shows that:
- Swap Curve represent 30%
- Swap Butterfly represent 24%
- Swap Spot are 46% (as compared to 39% in trade terms).
In reality we know that the SDR notionals are capped for large notional trades and block trades.
There are only 7 such trades and using SEFView, which gives us Block notionals by instrument and some detective work, we can see that just one of the Swap Curve trades (a 2Y/3Y) is capped, while the remaining 5 capped trades are standard spot swaps.
Re-creating the chart with the actual notionals:
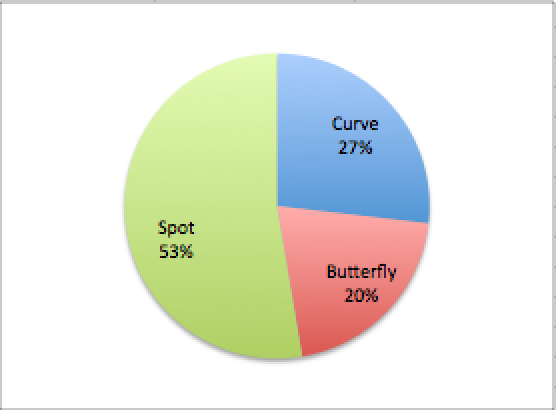
Which shows that Standard Spot trades represent 53% of gross notional.
Swap Butterfly
Lets look in more detail at the 19 Butterfly trades.
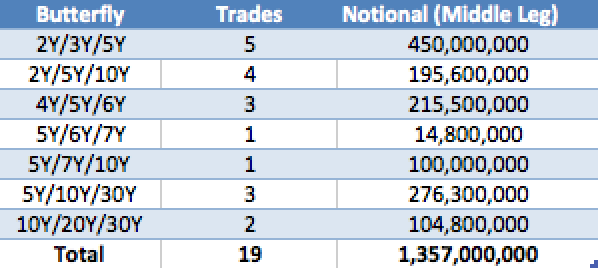
From which we see that 2Y/3Y/5Y is the most popular with 5 trades, followed by 2Y/5Y/10Y with 4 trades.
Summing just the middle leg of these trades, gives us a better idea of the Butterfly trades. The resulting total of $1.35 billion is less than half the sum of all component legs ($3 billion).
We could consider using this new total or an alternate duration weighted measure to better reflect the risk traded on an equivalent basis to standard Swaps. That is something we get asked about and would like to do in SEFView.
However while it is possible for us to do this for the Bloomberg SEF, it would only be worthwhile if we could do for all the SEFs.
And that we could only do that if we could link each SEF’s product volumes to the constituent trades in the DTCC SDR.
Which unfortunately is not possible.
So the main value in linking the trades into the Packages is that we can see what part of the curve, types of trades and size of trades are being put on.
Swap Curve
We could do the same analysis as above for Swap Curve trades, but I will leave that to those of you that have the interest.
Just export the trade blotter list from SDRView Professional.
Summary
In SDRView we can order trades by execution timestamp to identify Package trades.
Currently Swap Curve and Swap Butterfly are the main package trades that are MAT.
We can see these trades for BSEF.
For a specific date (13 June 2014) we have shown how much volume is standard Swaps and how much packages.
On this day 53% was standard and the remaining split as 27% Curve and 20% Butterfly.
On different days or longer periods these percentages are likely to vary.
They are also likely to be different for each of the SEFs.
As Swap Curve and Swap Butterfly have component legs which net (pay/rec) they have a very different risk profile to standard swaps.
We could work out a consistent risk equivalent amount for IRD on BSEF.
However this would be much more useful if we could apply the same analysis for each of the IRD SEFs.
Which unfortunately is not possible without knowing which trades in the DTCC SDR are from which SEF, something that the real-time public dissemination feed does not allow.
So we need each SEF to start publishing their package volumes separate from their swap volumes.
Anyone willing to be the first?