Back in February 2019, I wrote a blog on the state of the GBP and USD OIS markets. At that time, I held great hope for the USD SOFR markets to develop during 2019 to support a growing market in SOFR-based cash products and the derivatives used to hedge them.
This blog looks at the trading developments so far this year in derivatives and compares the SOFR with the EFFR (Effective Fed Funds Rate) trading volumes.
A robust and liquid SOFR derivatives market will be a useful development to support the move from Libor to SOFR across many products.
Clarus CCPView has some very interesting data on the cleared USD OIS market.
Cleared OIS trades
Firstly, the CCPView has 3 tabs (Volume & OI, RFR, Disclosures) in the top left of the screen that appear as follows:
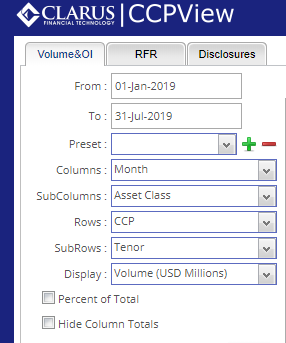
In this blog I will look at the first 2 tabs and how they can be used to show different views of the USD OIS markets.
Firstly, it is important to realise that the USD OIS market is actually two markets: one referencing SOFR and the other referencing EFFR. The Fed Funds OIS has been traded for many years while the SOFR is relatively new and only came into existence after SOFR was first published in April 2018.
The two tabs can be used to see how these separate markets compare:
- Volume & OI, this tab shows the total USD OIS cleared market volumes when the correct filters are applied, i.e. SOFR plus EFFR; and
- RFR, this tab is relatively new and only shows cleared volumes referencing SOFR.
Total OIS cleared volumes (Volume & OI tab)
I first looked at the total USD cleared OIS volumes in this tab from 1st January to 30th August 2019. This is the sum of all USD cleared OIS referencing EFFR and SOFR.
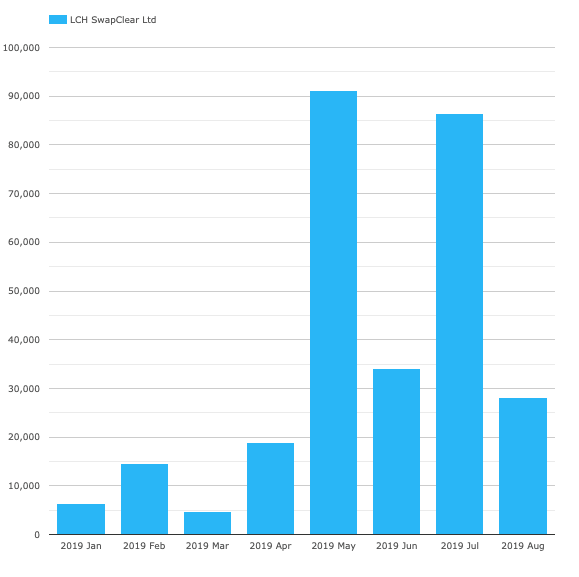
I included all CCPs and the following chart is produced which shows the total USD cleared OIS (in USD millions) per month for each CCP:
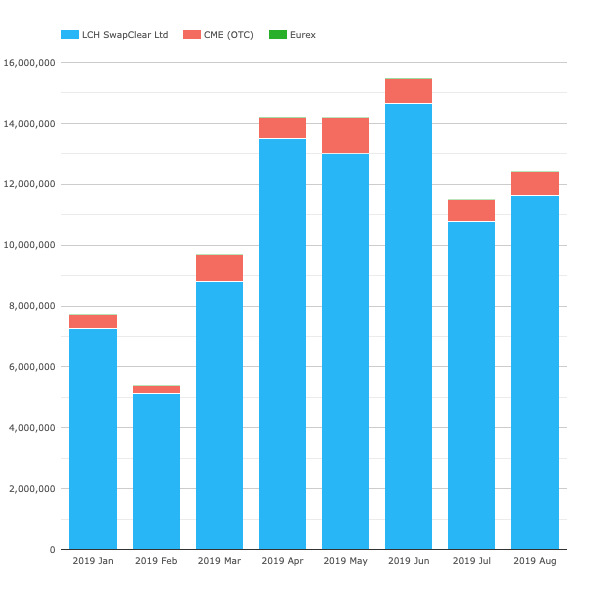
LCH SwapClear has the largest volume followed by CME and Eurex..
The total volumes are above 10 trillion (10,000 million) per month since April 2019. This equates to an average above USD 450 billion per day: clearly an active market.
Interestingly, most of the volume is actually less than (or equal to) 2 years maturity. The following chart is the same data except filtered for 2 years or less maturity. It shows nearly identical volumes to the total in Chart 1.
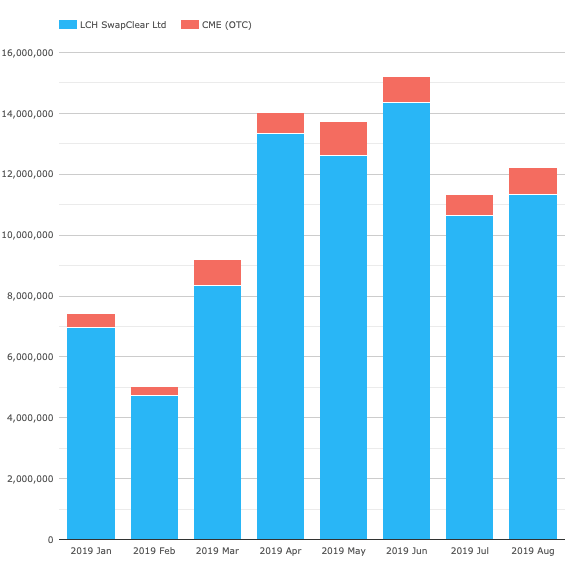
Chart 2 – total cleared USD OIS (USD millions) 2 years or less maturity
There is definitely a lot of activity in the USD OIS market!
What about SOFR trading (RFR tab)?
The RFR tab is very helpful in isolating the SOFR referenced trades in CCPView. This tab has been added specifically to track only the RFR trades in AUD, CHF, GBP and USD. In this case, we filter the USD OIS trades referencing SOFR only.
Chart 3 shows the cleared USD SOFR OIS trade volumes over the same period as above: 1st January 2019 to 30th August 2019.
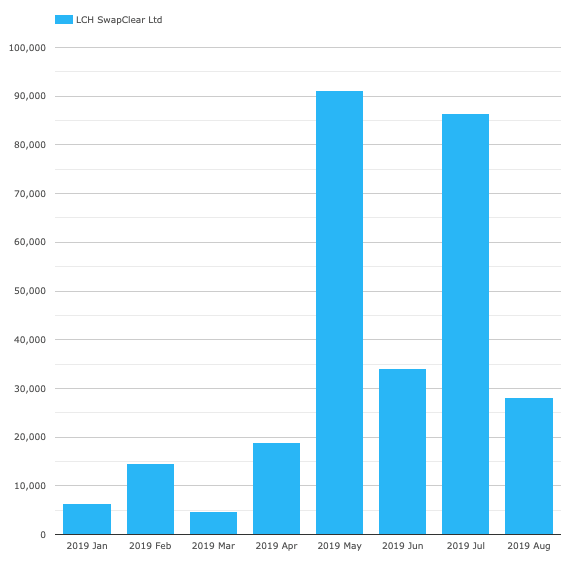
We have a couple of interesting points:
- The SOFR volumes are a fraction of the total (compare the vertical axes in Charts 1 and 3) – about 0.5% of the total!;
- SOFR volumes have increased but are variable between months; and
- EFFR OIS volumes must therefore massively larger than SOFR OIS.
And we also see the same effect as above where most of the volume is less than (or equal to) 2 year maturity.
Chart 4 shows this clearly when compared with Chart 3 and this is very similar to the totals OIS trading in the above section.
Implications of limited SOFR Swaps trading
Based on the cleared trade volumes, EFFR OIS trading still dominates the STIR markets. There has been limited use of SOFR OIS as at 30th August 2019 (the most recent CCP publication).
Clearly markets are still preferring EFFR over SOFR in STIR trading.
The potential implications of this could be a slower adoption of SOFR more generally across products could be slower without sufficient liquidity in derivative hedge markets.
Summary
The ARRC is making good progress in the Paced Transition Plan. But the markets are yet to move decisively towards SOFR. We will continue to watch this carefully over the next few months.
Clarus CCPView is an excellent way to monitor the transition for USD and other key currencies. The addition of the ‘RFR’ tab has made this process easier to keep on top of the RFR-based derivative volumes.
With LCH’s announcement that they will move to SOFR discounting in H2 2020 (https://www.risk.net/derivatives/6385026/lch-plans-2020-switch-to-sofr-discounting) it is a matter of timing – the issue seems to be that the dominant contracts with which people are pricing and hedging interest rate risk are hard to change until liquidity also moves. But this schedule enforces a transition over that timeframe, as the alternative is to be charged much more in margin costs by LCH when your rate risk is exposed.