I spent time at the FIA Expo in Chicago last week where I sat listening to many speakers and panelists. Chairman Massad gave a fantastic keynote address, and somewhere in his speech, without giving a name, he referred to one clearing house having the lion’s share of cleared OTC. In the back of my mind, I thought, that would be LCH.
In a subsequent panel, a panelist referred to a US domiciled clearing house having the lion’s share of cleared OTC. But this time the context was client clearing, and I thought surely he was referring to CME.
I thought to myself, I wonder what the real metrics are.
GENERALLY SPEAKING
For interest rate swaps, the general notion goes like this:
” LCH clears all dealer activity, and CME clears client activity. Further, interest rate swap clearing outside of these two does not exist. “Having personally worked with some of the foreign clearing houses, I know the last statement is untrue, but just how relevant are all of the clearing houses in their respective markets?
MARKETING LITERATURE
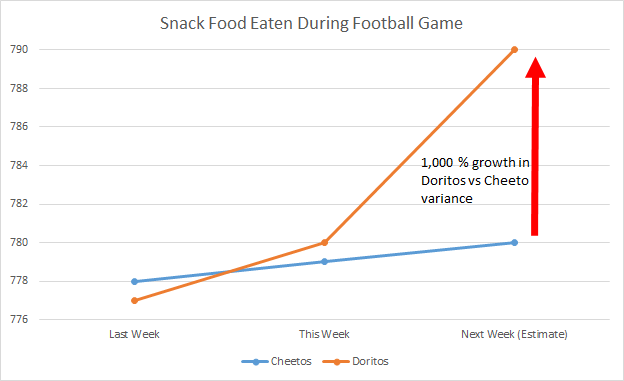
If you’re in the industry, you almost certainly subscribe to the newsletters from the various exchanges and clearing houses. In nearly every case, there is an embedded graphic representing some amazing discrepancy. You’ll often have to look very closely at the inputs, scale, and axis to really figure out what is going on. I would summarize most of these graphics with the following nonsense:
CLEARING DATA
In order to complement the derivatives data we already compile and normalize on SDRView and SEFView, we began compiling clearing statistics at the major CCP’s for interest rate swaps. We’ve found that, like in SEF data, the clearing houses supply data with varying degrees of detail:
- CME and LCH do not provide daily trade counts
- LCH does not provide daily tenor information
- CME does not separate Client and Dealer (if in fact there is any interdealer activity)
- HKEX provides only monthly data
- JSCC provides excruciatingly good detail on notionals, trade counts, as well as the reference index
Even given the limitations above, we are still able to track notional trade activity and OI over time, per currency, and per product type.
THE TRUTH
Let’s try to address the common notions right off the bat, using the most recent weeks data. Spanning all currencies and all products (IRS, ZC swap, FRA, Basis, OIS), and looking at open interest (notional outstanding), we get:
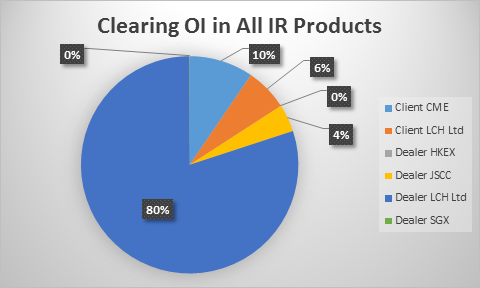
The data seems to say:
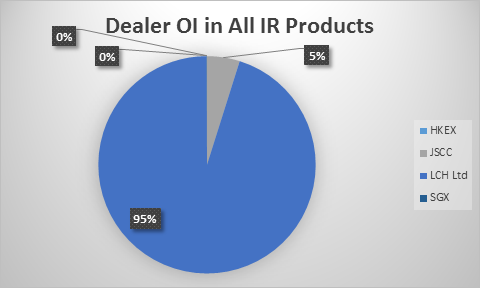
- CME has roughly 60% of the 36 trillion in client cleared notional
- LCH has roughly 95% of the 195 trillion in dealer notional
- JSCC has a significant business
I will admit there is a very dangerous assumption in here. That is, that the CME clearing numbers are all client based. I’m led to believe this is fair. However if not, we would need to adjust client numbers for CME down (and LCH numbers up).
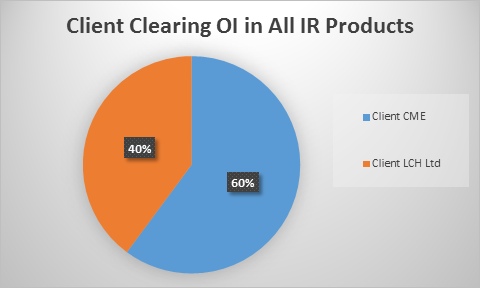
If we whittle this down to just Client cleared USD IRS:
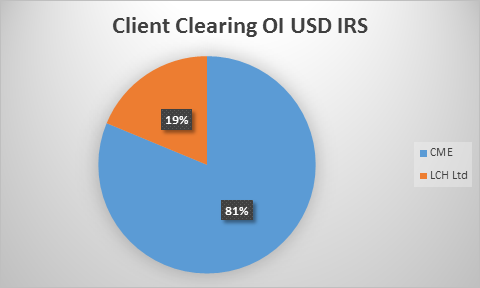
Then we see CME has 81% of the 12 trillion client cleared USD IRS notional.
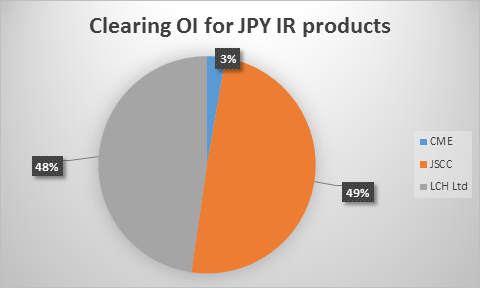
Finally, just a point on JSCC. If we take the universe of only JPY swaps, we can see that the JSCC has indeed a solid business clearing domestic Yen swaps:
There’s plenty more data to look at. We’ve now got metrics by ccy, by product type, and also over time so we can notice any trends in the data. But I’ll leave it here for now, having more or less corroborated my notion.
DATA SUMMARY
I set out to confirm or disprove the notion that “Dealers clear at LCH, Clients clear at CME”. And what we can see is that the client clearing game is fairly balanced (60/40). But is that even a fair comparison?
It is likely not fair for two reasons. First, the LCH numbers include the US and the rest of the world. Hence the European clients that have decided to clear have numbers baked into there somewhere. However I would argue if CME had a booming European client business, we would be hearing about it.
Second, there is no clearing mandate yet in LCH’s native domicile. The client clearing battle has first been fought on CME’s territory; who knows what will happen when Europe (and the rest of the world) begin MANDATORY client clearing.
Either way, it’s something that we’ll be able to keep a closer eye on moving forward.
This doesn’t factor in compression- therefore open interest is a poor measure of market share.
For example, taking this weeks SwapClear data, they cleared $1.9trn client business last week. They compressed 1.27trn client business. Net impact on open interest is .53trn.
As the CME barely compress, SwapClear vs CME is actually 75:25 globally.
Thanks for the comment. Agreed that OI is not to be taken as the primary measure, particularly given compression like you point out. LCH are pretty clear of, and in fact actively market the fact that they are reducing OI through compression. Hence we are also tracking daily flows which would be a good indication of activity ex-compression.