- The Clarus blog has recently published its 1,000th blog.
- We run through our early blog posts and highlight some of our most popular posts.
- The blog had over 500,000 page views in 2020. We are looking forward to the next 500,000.
I realised a little too late last week that we have just gone over 1,000 blog posts here on the Clarus blog. That is surely a milestone worth celebrating!
How it all started
@gary posted our very first blog post way back in July 2012. Admittedly, looking at it now (complete with Comments) I think it’s fair to say this was really a first “test” to see if we could even hit publish successfully! We all have to start somewhere….
Funnily enough, LaTeX is still used on the blog, and we have noticed over the years that blogs with LaTeX formulas embedded tend to outperform similar blogs where we paste the mathematical equations via pictures. That might be a coincidence, or it might be due to our following.
How It Got Going
Our first two “real” blogs are great examples of the direction that the blog would take. Short, succinct posts about very technical topics:
Maybe not quite in the realm of data, transparency and regulations that we are now better known for, but we all start somewhere.
The First Data Blog
It wasn’t until 1st March 2013 that Amir first wrote about the new Transparency Data in swaps markets. Shining a light on derivatives was very apt:
Albeit we started with daily summary files, this quickly morphed into the first iteration of SDRView by the end of March 2013:
We will gloss over the learning errors on that first blog (see follow up here!) and rather note that this all lead to the first release of SDRView into the wild on May 14th 2013:
Then What Happened?!
June 2013 was probably one of the more pivotal months on the blog. This is when the team started looking at what the data meant as regulatory changes took place in “real-time”:
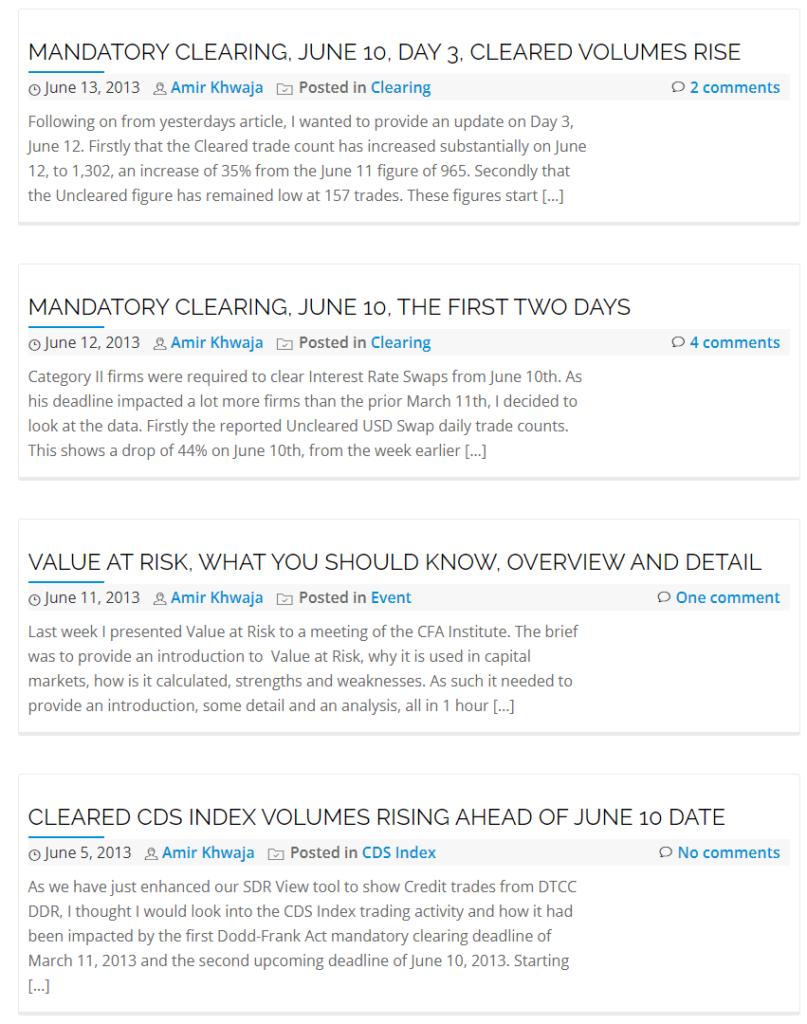
And those first few days of the Clearing Mandate led to a typically Clarus conclusion:
So while it is surprising that the Cleared trade count remained unchanged on June 10th, as we would have expected it to increase by roughly the same amount as the drop in Uncleared, the figures on June 11th show the effect we were expecting; a sharp rise in the count by 49% to 965 trades from 648 trades on June 4th.
Thirdly we can determine that on June 11th, 85% of USD Swap trades are Cleared and 15% Uncleared.
We need at least a few more days of data, to see whether all or part of the Uncleared Swap trade activity has moved to Cleared Swap trades or whether it has migrated to other products.
MANDATORY CLEARING, JUNE 10, THE FIRST TWO DAYS, June 12th 2013
Little did we realise back then that the data quality would take some time to become reliable. And how the introduction of SEFs in October 2013 would give us another big topic to cover:
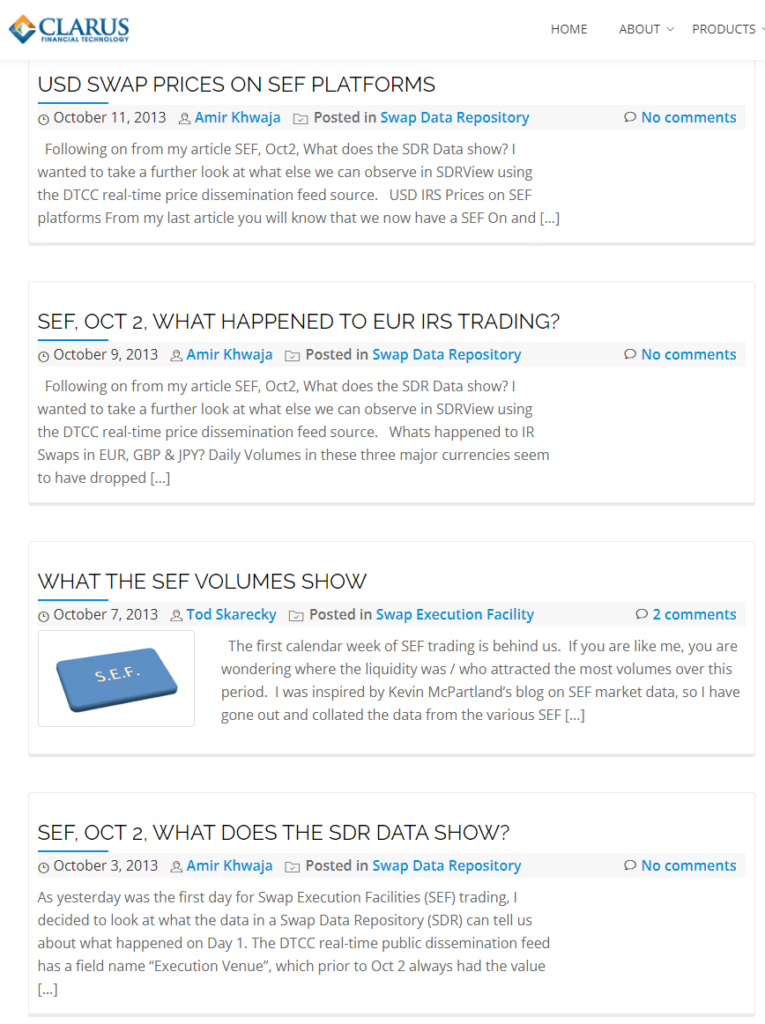
Look at that! Day One of SEF Trading and we are already there, analysing the volumes. Then we look at non-USD and prices executed on SEF. That’s pretty impressive stuff to make maximum use of the transparency being offered from changing regulations.
Of course we tried during the MIFID II debacle in January 2018 to replicate all of this. Sadly the European data has never been made accessible to us to make into equivalent data products That probably remains our most disappointing finding during the 8 years of our blog. Europe – you need to do this:
How Is It Going?
The Clarus blog has covered at least 27 topic areas in quite some depth. Looking at the posts we have published:
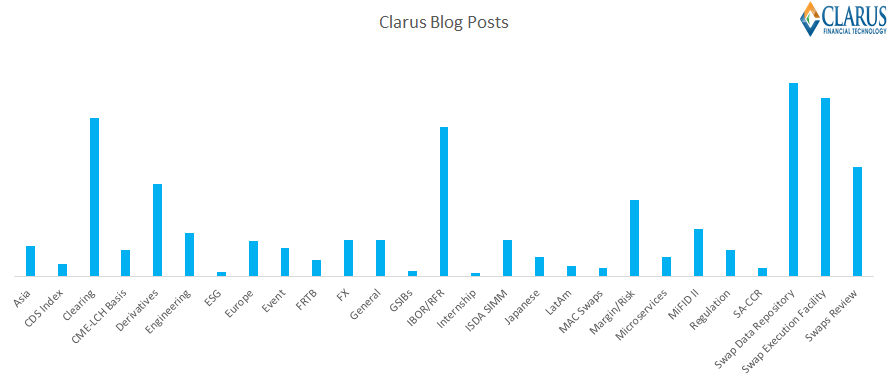
As you can see, our most blogged about topics are:
We obviously monitor the readership of the blog (see here for example) so if you are fed up with any of those topics you only have yourselves to blame! We tend to write about the topics which attract the most views on previous blogs. We always warmly welcome any suggestions for blog topics and feedback on existing blogs so please feel free to get in touch.
From a personal perspective, I don’t really want to dwell too much on my cringe-worthy first attempts at blogging back in June 2014. But as early as October 2014 I had finally written a decent one that continues in our top 10 even now:
Amazingly (embarrassingly?!) , it would be nearly 3 years until I wrote a successor blog that came anywhere near the success of that one! As Amir has consistently highlighted, everyone likes to read about Cross Currency Swaps on the Clarus blog:
And if anyone wants to know the irony of these things, the Cross Currency Swaps blog was written when I was sleep deprived, on paternity leave with my second kid and desperately looking for some content I didn’t have to do any research for. For the avoidance of doubt, I don’t intend to replicate those conditions any time soon just to write another widely read blog 😛
Finally, let’s reiterate our readership stats from 2020:
Website Statistics
Traffic on the Clarus website averaged 18,500 users and 43,000 page views a month during 2020.
Key Statistics:
- There are now 1,000+ articles on our website.
- The highest single day on the Clarus website saw 6,375 users. (Are there really that many people that read about derivatives these days?!)
- The highest week with 10,200 users.
- For the year our website had 500,000 page views.
- From 320,000 sessions and 190,000 users.
- The cumulative time spent by all users was 7,500 hours.
Thank You All for Reading
I’d like to take the opportunity to thank all of you for reading and following, all of the Clarus team for the helpful content they’ve posted and also issue a blanket excuse for everything we’ve gotten wrong over the years !
Here’s to the next 500,000 page views.
Congrats all – a must-read blog for those that read it, the others are missing out!
Thanks Shaun, very kind!