If you read my blogs, you will know that I am a true believer in the benefits of the real-time public dissemination available from US Swap Data Repositories.
Today I want to focus on a specific aspect; Tick Data.
Tick Data is widely used in Equities and Futures markets. To use just one topical example; Algorithmic trading requires backtesting on large amounts of tick data. This data needs to be of good quality and effectively time-stamped.
With the advent of SDRs and SEFs, the US Swaps market now has a source of Tick data.
SDRView Pro and CDX NA IG
Using SDRView Professional lets look at the most heavily traded Credit Default Swap instrument; CDX NA IG and focus only on trades executed on the Bloomberg SEF, on a single day, May 15, 2014.
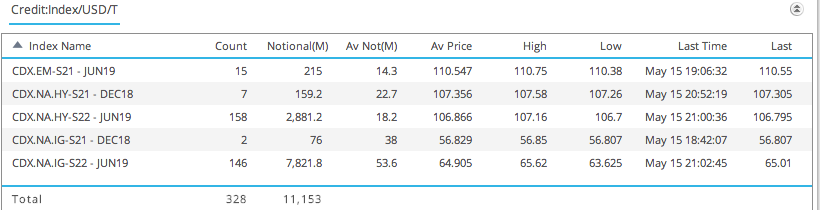
Which shows that IG Series 22 5Y with 146 trades of > $7.8 billion, is the most heavily traded instrument.
Lets now drill-down on the 146 IG trades.
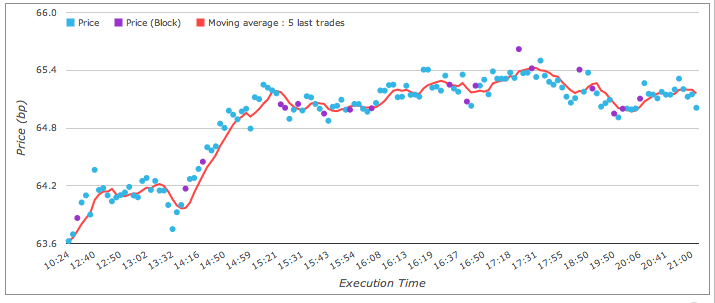
Which shows us the Tick data:
- The first trade is at 10:24 (LON) at a price of 63.625
- The red-line represents the moving average of the most recent 5 trades
- Blue dots are standard trades
- Purple dots are block trades
The price drifts up over the day, with the last trade at 21:02 (LON) at 65.01.
Prices seem to be clustered closely together by time and there are no obvious outliers; as we would expect in an efficient market.
Statistics for CDX.NA.IG
Lets now export this tick data and see whether we can determine any interesting statistics.
First BSDR publishes the fields execution_timestamp, submission_timestamp and publication_timestamp.
We can check the time delay between execution and submission. For non-block trades the statistics for this are:
- Average time is 6 seconds
- Minimum is 1 second
- Maximum is 1 minute 12 seconds
- Median is 4 seconds
For block trades, of which there are 19, the statistics are similar (9s, 3s, 26s, 5s respectively).
Next the time delay between submission and publication.
For block trades this is 15 minutes, as per the CFTC regulation.
For non-block it is zero seconds! Presumably because it is not measuring the end time that data is made available in the BSDR Slice file or the BSDR ticker. Anecdotally this time seems to be about a minute, but I don’t have quantifiable data to hand.
Lets now look at the times of the trades themselves.
First if we make our trading time window 7:30 AM EST to 4:00PM EST, we only discard 3 trades from our 146 and can look into the frequency of trading.
Crudely we could say there are 146 trades in our 8 1/2 hour time window. So a trade every 4 minutes.
In more detail lets look at some statistics and a chart.
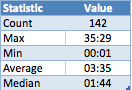
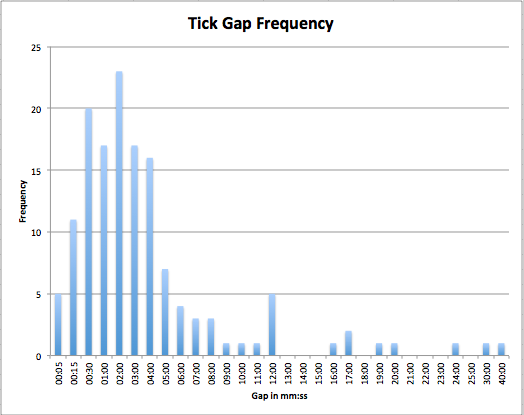
This shows the Tick Gap, defined as the time between ticks (trades). We can see that from our total count of 142:
- The most common gap is between 1 to 2 mins with 23 occurrences.
- Followed by 15 to 30 secs with 20 occurrences
- Then 30s to 1min and 2 to 3 mins with 17.
- Then 3 to 4 mins with 16 and 5 to 15 seconds with 11.
- All the rest have less than 10 occurrences.
- The median gap is 1 min 44 seconds.
- The minimum is 1 sec and the maximum 35 minutes.
In-fact we can say that 116 out of 142 or 82% of ticks are within 5 mins of each other.
So at least for this instrument we can say that trading is frequent through-out the trading day and the pattern is as we would expect in any financial time series with periods of high activity and periods of lower activity. Or volatility is clustered as the quants among you might say.
What about the size of trades. How is this distributed?
Lets look at the data.
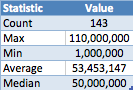
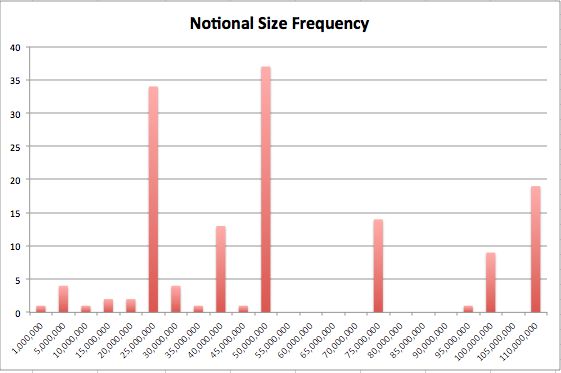
Which shows us that:
- $50 million is the most common size traded with 37 trades
- $25 million is the next most common with 34 trades
- $40m, $75m & $100m are also traded frequently
- There are 19 block trades of > $110 million each
At this point we could look at SEFView and see that BSEF reported $4.1 billion of block trades on 16 May.
So in actual fact our 20 trades (19, plus one we excluded as traded prior to 7:30am) have an average notional of $200 million.
What Next
Well we have looked at timing of ticks and size of trades.
We could look at the price ticks themselves.
We could also look at not just 1-day, but a week or longer.
We could look at CDX.NA.HY (which certainly notional size wise looks very different).
We could also look at my usual bread and butter USD Interest Rate Swaps, 5Y, 10Y, 30Y.
However I will leave that to those of you who are curious to do yourself.
Just login to SDRView Professional.
Summary
Tick data is widely used for Equities and Futures.
It has not been available for Swaps prior to USD SDRs. (Or at least to very few and even these have partial data access).
With SEFs the quality of this data (timestamps and price) is greatly improved.
Swap Tick Data can be useful for many use-cases.
Algorithmic Trading is one obvious and topical one.
Best execution analysis could be another.
SDRView provides a clean source of tick data for the US Swaps market.
Transparency helps in making markets more efficient.