Those of you that read my articles will know that I often write about “What the Data Shows” in the context of Swap Data Repositories and Swap Execution Facilities. Given that it is the time of year for many of us to attend Offsite Events in order to plan for 2015 and reflect on performance in 2014, I thought I would turn introspective and look at “what the data from our blogs shows”.
Like many firms we use Google Analytics on our website to collect statistics on web traffic and in this article I am going to summarise what the data in 2014 shows about our blogs.
History
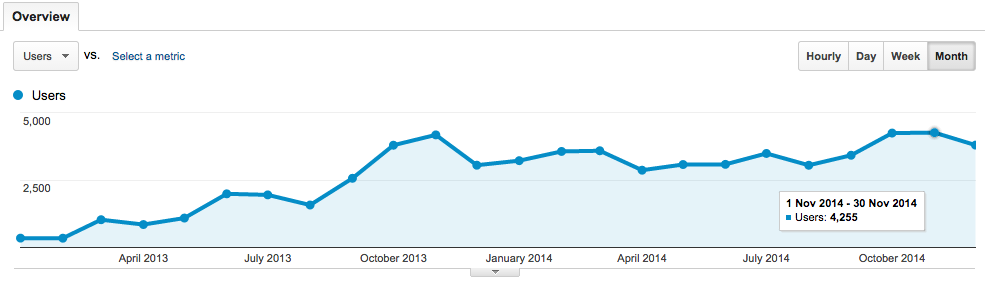
Lets start with some history and a chart of users visits to our website.
Which shows:
- Monthly user visits to www.clarusft.com from 1 Jan 2013 to 31 Dec 2014
- The first up-tick in users is March 2013, the month of our first blog on SDR
- Then June 2013, our first month with 9 blogs
- September 2013 saw our first SEF blog
- October and November 2013 peaks due to the interest in the start of SEF trading
- The expected Dec holidays drop off
- Then a steady state of around 3,500 users per month in 2014
- And a high of 4,255 users in Nov 2014
We know from Google Analytics that a large majority of these users come to the site to read our Blog.
Discovering a Blog Article
Lets look at what Google Analytics tells us on how user’s discover a blog. The two most common ways are:
- Google Search that leads to our blog (try entering “fed fund swaps” in google)
- Direct, so users coming direct to www.clarusft.com (via bookmarks)
Other popular ways are:
- Our Weekly Newsletter Email, which has 300+ subscribers
- RSS based News readers
- LinkedIn Updates, where the Clarus page has 800+ followers
- Twitter, where @clarusft has 200+ followers
- Other Industry Sites: theotcspace and tabbforum
- Bing (Microsoft search, surprising)
Statistics on Blog
Lets now turn to some statistics on the blog articles. In 2014 we published 115 blog articles, averaging 2 per week, which was a significant increase from the 73 we published in 2013.
Pageview statistics in 2014 for these blogs on www.clarusft.com, show us the following:
- 5 blogs with > 1,000 views
- 11 blogs with > 800 views
- 19 blogs with > 700 views
- 36 blogs with > 600 views
- 47 blogs with > 500 views
- 73 blogs with > 400 views
- 97 blogs with > 300 views
- 137 blogs with > 200 views
Interesting, the usual fat-tailed non-normal distribution we are so used to in finance. Perhaps I should calculate a VaR Margin measure from this and start to use in our monthly management meetings. On second thoughts probably not. 🙂
Top 10 Blogs of 2014
Excluding one blog which is not relevant to Financial Markets, our 2014 Top 10 Blogs were as follows:
- Fed Fund Swap Nuances
- Implementing Bus252 Daycount Convention
- FX NDF Trading On SEFs
- SEF: Week 25
- Swap Compression and Compaction on TrueEx and Tradeweb SEFs
- LCH-CME Switch Trades and Margin Management
- SEF: Week 16
- A Six Month Review of Swap Volumes
- SEF: Week 17
- Swaptions Clearing a More Detailed Look
The Top 3 are all blogs that continue to garner views every single month, long after they were first published, as we know they rank high in google search results. In-fact No 2 was first published in Sep 2012.
Most of the remainder show the more typical profile of lots of views in the first week after publication and then dropping to low or zero in subsequent months.
Some of our blogs are also published to other sites (theotcspace, tabbforum, derivalert) and depending on the exposure given on those sites their relative views can different from those on clarusft.com. On third-party sites, our Top 2 blogs were both on tabbforum (neither in our own Top 10):
Final Thoughts
The data and statistics from Google Analytics, help us understand which blogs and topics are popular. Which helps immeasurably in determining themes to continue with in future.
We also greatly appreciate the comments and emails we receive from our readers on the content. Even for us data-geeks it is more satisfying to get an email from a reader saying that they liked a specific article and could we elaborate on so and so. Also comments can serve to correct mistakes that we have made or further inform us and our other readers, so please keep these coming.
It remains for me to thank you for taking the time to read our blogs.
Please feel free to pass these on to your colleagues or encourage them to sign-up for our newsletter.
I look forward to What the Data Shows in 2015.