About a month ago I was at a conference and heard folks mention OTC clearing volumes, and my curiosity got the best of me: Who is clearing what, and how much is going through each venue? So I began pulling clearing data and managed to address my initial curiosity, which I detail in my article “The Truth In Clearing House Data“.
However as we kept pulling more data and playing with the results, we quickly realized the benefit of having this kind of transparency readily available and updated on a frequent basis. And so we’ve kept at it, and have also added NDF’s and Credit derivatives into the mix. By leveraging our data collection, normalization, and reporting framework, we now have a way to readily monitor the most recent data. I’ll share with you some of the results.
What Data Is in Scope
Our intent is to capture data from the active OTC clearing houses. At the moment, this equates to 8 names, spanning 17 Clearing Houses:
- CME (Rates, Credit, FX)
- Eurex (Rates)
- HKEX (NDF and Rates)
- ICE (ICE Clear Credit and ICE Clear Europe)
- JSCC (Rates and Credit)
- LCH (CDSClear, ForexClear, SwapClear Global, SwapClear US)
- Nasdaq OMX (Rates)
- SGX (NDF and Rates)
If you believe there are any noteworthy businesses not listed here, we’d be interested to add them. I should note that ASX is not yet publishing data for their rates business, but we would plan to add them when the time comes.
Comparing Apples to Elephants
One of my favorite quotes within our industry is one from Jodi Burns at Thomson Reuters, who when asked a question about SEF data reporting requirements, she responded that people were “comparing apples to oranges, pears and elephants”. Her comment was part of what drove us to institutionalize our Clarus SEFView product, which I believe does a phenomenal job in normalizing SEF data. Yet she had (and still has) a valid point: you really have to know any limitations in the underlying data that you’re looking at.
The primary obfuscation in publicly disseminated clearing data is the use of single or double counting. Simply put, if party A and B transact a 1 million dollar swap, single counting would say that 1 million has been cleared. Double counting would say 2 million has been cleared. While 2 million (double counting) is the right number in terms of notional and credit risk the clearing house has, we need single-counted data in order to readily compare to publicly disseminated execution data (from SDRView and SEFView).
I am just going to take a short break while I pat myself on the back for using the word “obfuscation” in a sentence.
OK.
We endeavor to normalize all data to be single counted. Besides single-counting, we have some other principles which we believe should be common in reporting of clearing data. We detail these principles, along with some assumptions we’ve made in a document here.
Data
What follows are some views onto this clearing data. First, an overall look at Open Interest across all of these venues over the most recent 5 days.
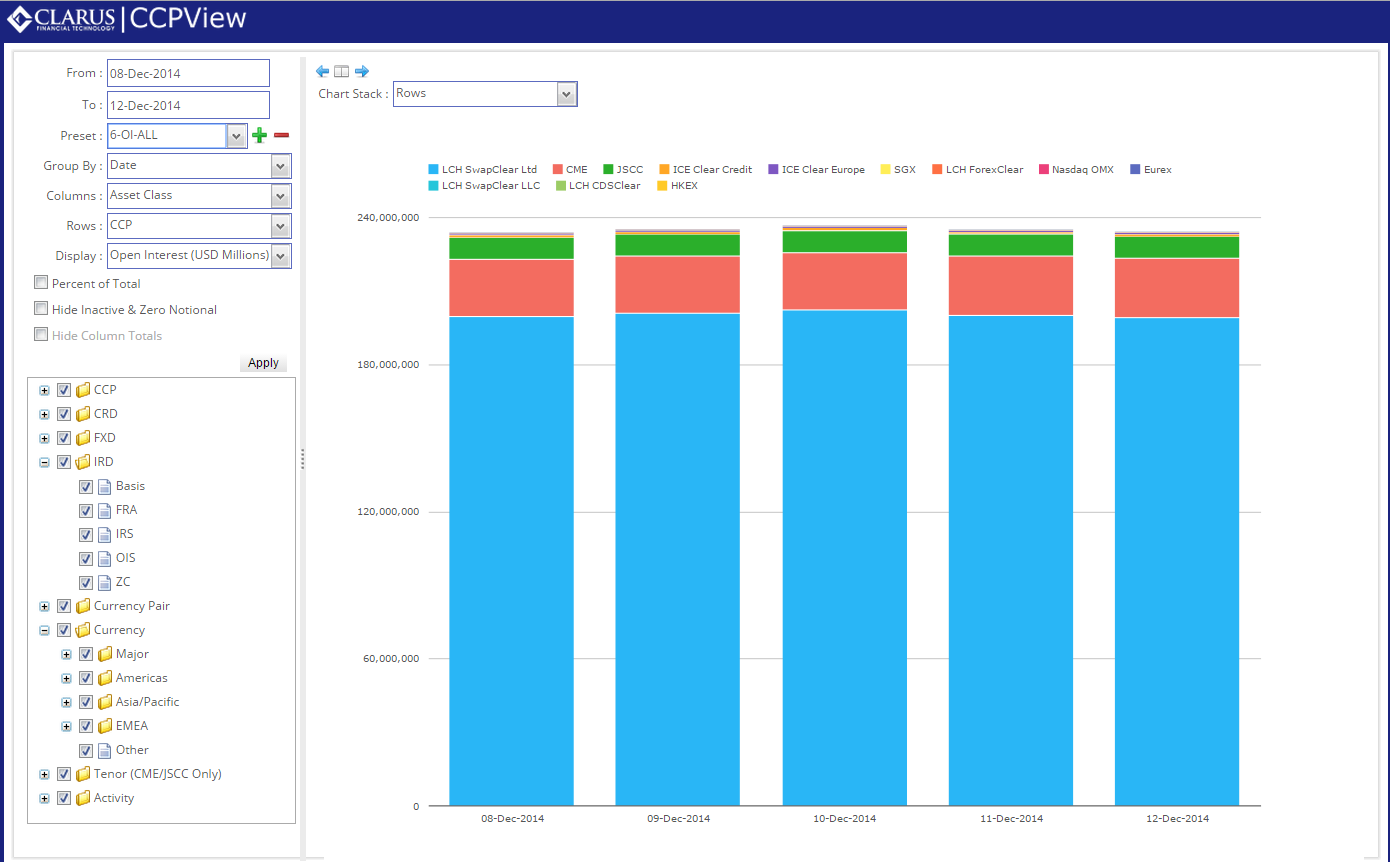
A couple things stand out. First, is that we’re talking big numbers, as you might expect. Total open interest in cleared OTC, at the venues and products we’ve included, stands just below 240 trillion. Second is that LCH SwapClear accounts for well over 80% of that.
Some of the comments I received on my first blog regarded using open interest as a measure. In particular, LCH SwapClear, while the largest contributor to OI, are actively innovating solutions for compressing & terminating outstanding contracts to reduce their OI. They have been in the press pointing out that OI should not be seen as a bragging right in the capital sensitive, BASEL III world we find ourselves in. So next, we look at volume across these same venues:
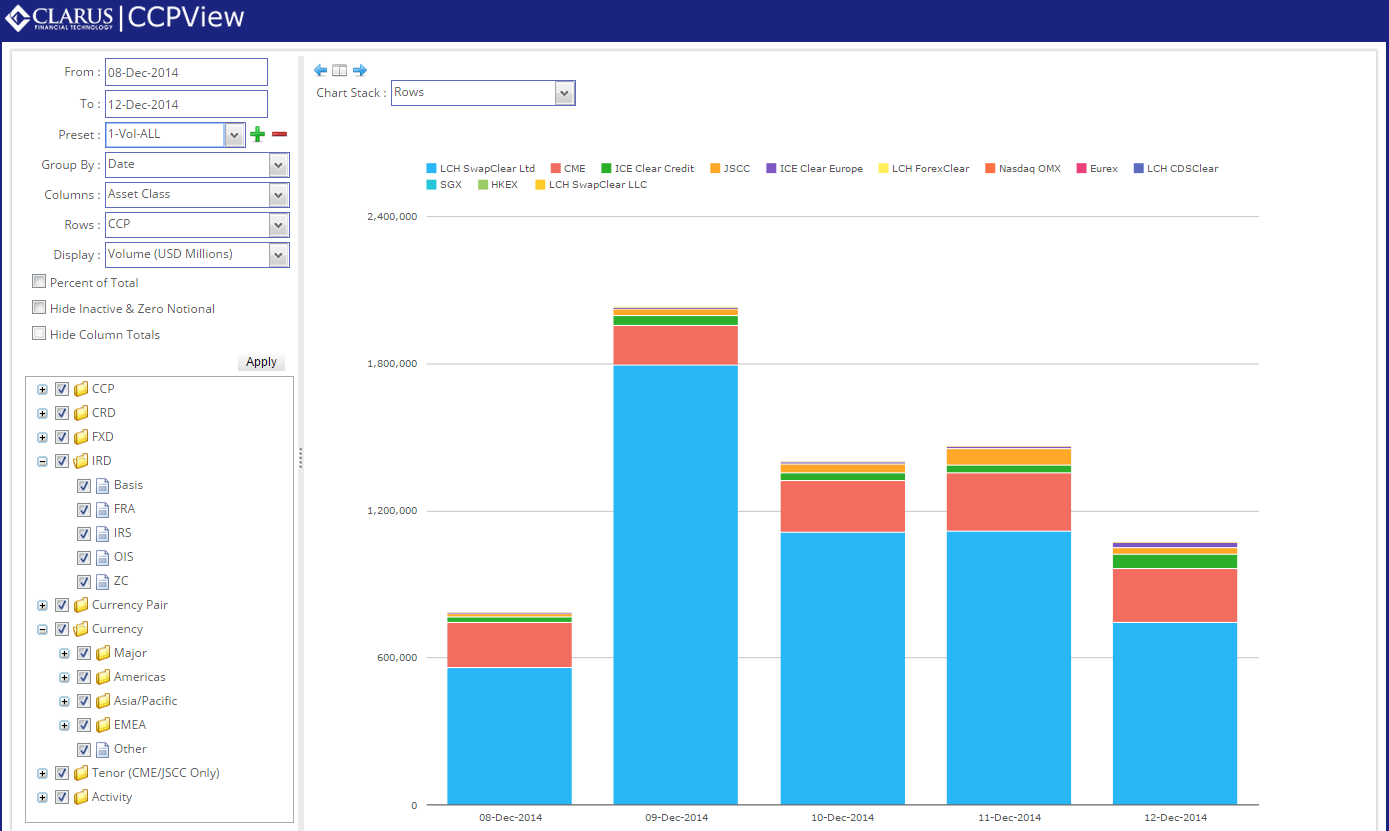
Once again LCH SwapClear stand out, however now we can see there are other players. This comparison is not quite fair however as we are including all asset classes, so lets zone in on just IRD and look at activity by currency:

Couple things stand out here. Namely:
- LCH has significant majority in all currencies
- The CME is most competitive in USD
- JPY activity at JSCC roughly equals LCH
- MXN (its almost to small to see) is only cleared at CME
Note that I only chose a select subset of currencies in that analysis (“Major” and “Americas”). There are plenty more.
Moving on, lets look at IRD by product type:
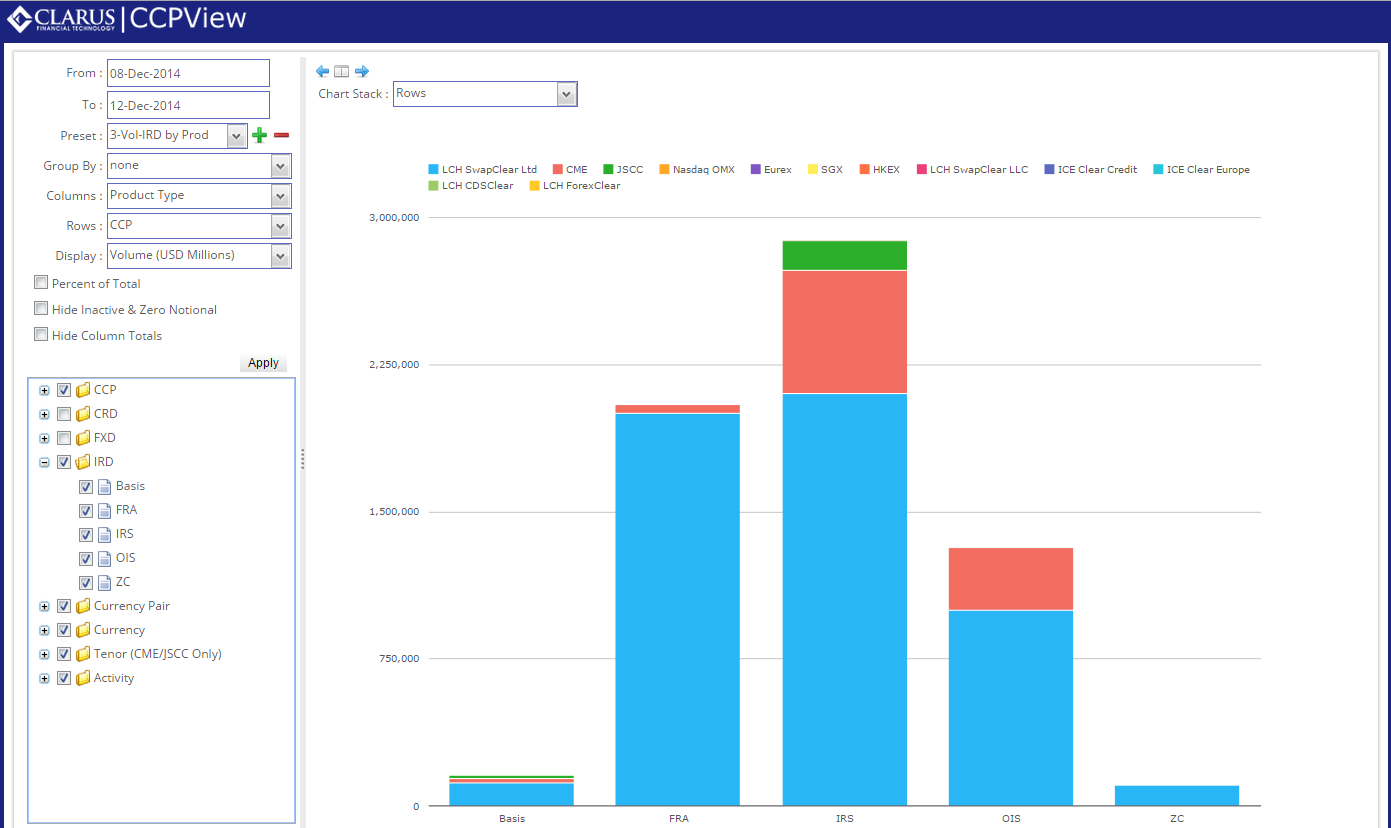
Interesting to see the amount of cleared FRAs.
Now lets look at daily Client clearing activity in Interest Rate Swaps (no FRAs, Basis, OIS or Zero Coupon). Word of warning here. If you have done your homework and clicked that “Principles” link above, you’ll know that we have assumed CME clearing volume to be 100% client activity. LCH nicely reports their Client and Dealer activity so we have confidence in those numbers. However CME does not make this distinction. You’ll have to use your own scaling factor here, or you will be guilty of comparing apples to elephants:

Worth noting that this chart becomes much more interesting as you begin to dissect it further, for example client clearing for IRS by currency. But I cant publish everything.
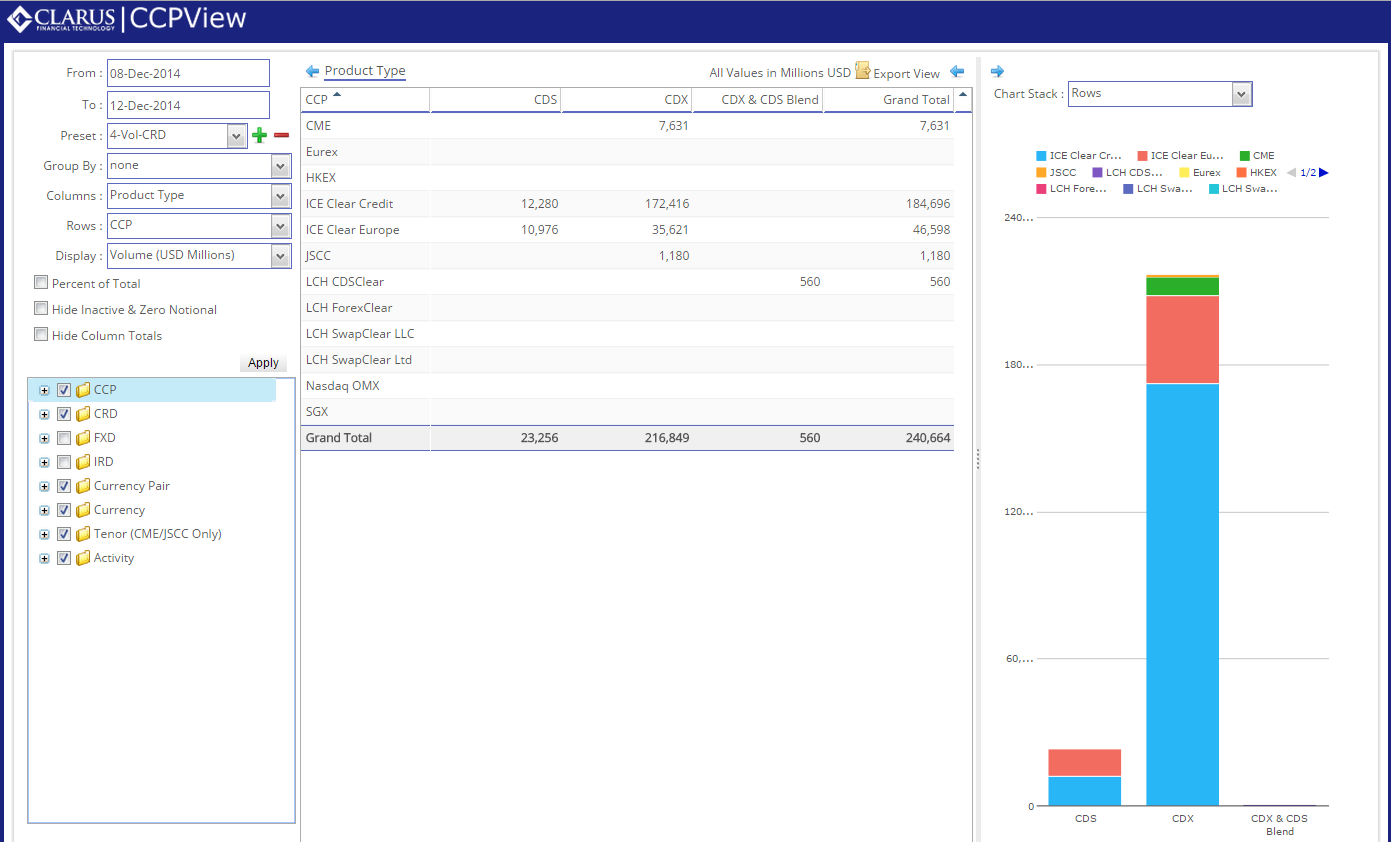
What about credit? There are 5 venues that we gather credit information from, and its quite obvious that ICE (Clear Credit and Clear Europe) have the vast majority of cleared swaps:
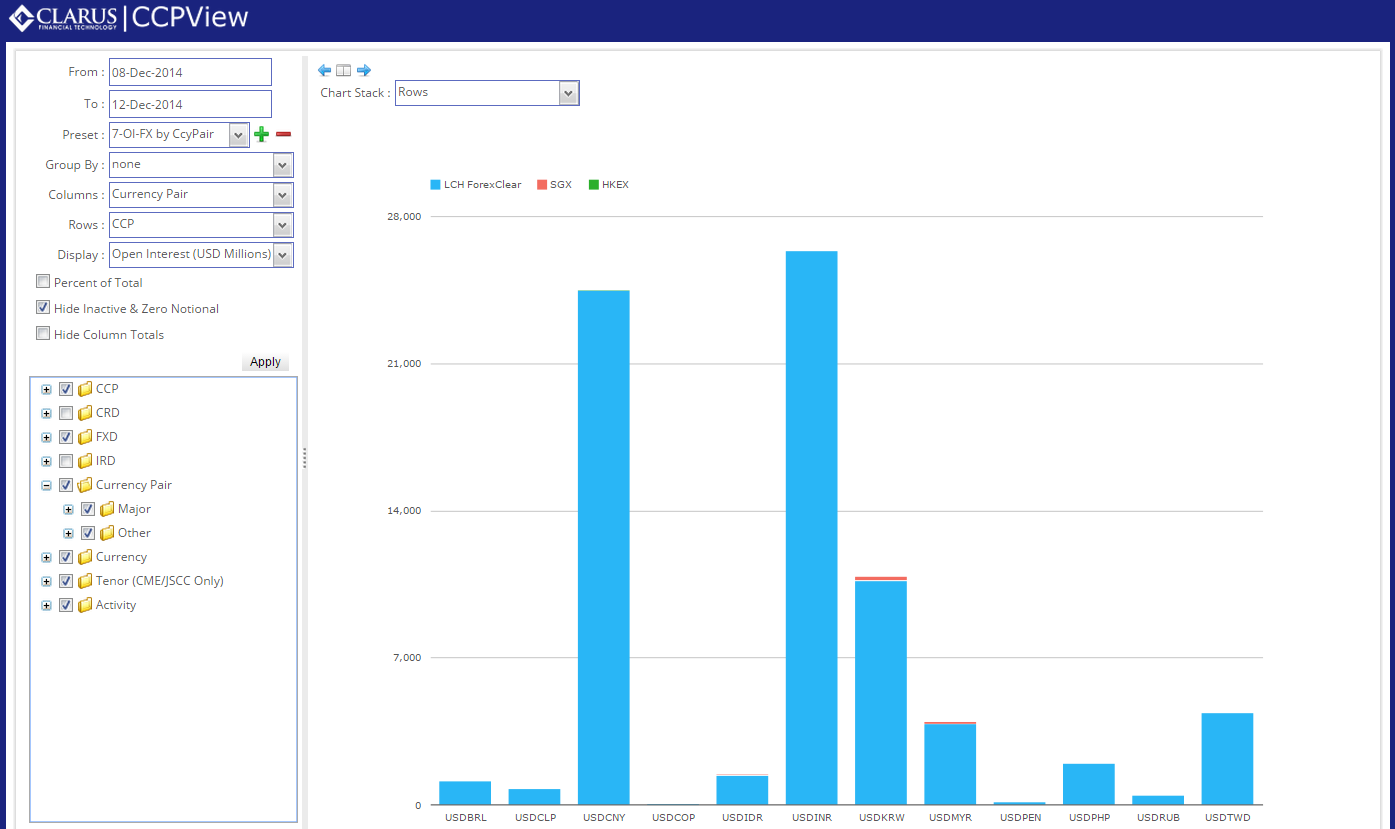
Last but not least, Foreign Exchange. This time we’ll switch back to open interest for this analysis. It would appear that LCH ForexClear are the principal venue for NDF:
You Too Can Play at Home
All of this data is in our new CCPView application. Like our other applications, we allow “Freeview” access by simply using your LinkedIn credentials. Everything above came from the free app, just by changing the Presets at the top left of the screen. Try it for yourself at CCPView.
Word of warning. The application is in “Alpha”, which is a software term meaning “Expect to find bugs”. We’d appreciate any feedback you might have. In particular if you believe the data itself is not normalized appropriately, or just downright wrong, we would love to hear from you.
Although I am a Clarus follower on LinkedIn, I get an error message requiring me to “follow Clarus”
Thanks Tony. We’ve modified some parameters on our LinkedIn API call. Best to try again and let us know if it still doesn’t work. PS you get credit for the first CCPView bug report. Congratulations.
Tod – thanks your analysis and information is always very useful. KRX data is missing here. They started clearing deliverable KRW in March
Daniele,
Thank you for the comment. There was news just the other day about the CFTC extending relief for CCIL, HKEX, ASX and KRX, which prodded us to go look at the ones we hadn’t yet evaluated (CCIL and KRX). We’ve been unable to find OTC clearing data for KRX, but with your reminder we have at least made the inquiry. HKEX we are processing, ASX does not publish data (we have been in contact with them), and CCIL indeed publishes data; we intend to include that in a future release.