- The six month reprieve from UMRs expired 1st September.
- We look at trading in uncleared markets in the past six months to see if anything changed.
- The number of uncleared IRS trades has shrunk by 50% as the regulations took hold.
- Products with no cleared alternatives continue to trade bilaterally. Volumes have continued to be healthy, showing no negative impacts from the new rules.
- The Uncleared Margin Rules are therefore a success so far.
- In Europe, UMRs will soon impact physical FX markets. The data shows that more and more NDF trades are traded under compliant CSAs.
Variation Margin Rules and Forbearance
We last looked at the impact of the VM Big Bang at the beginning of March. Despite all the doom-mongers predicting a sudden cessation of activity in bilateral derivatives, Tod found no real change in activity.
As the WSJ report, the period of forbearance issued by the CFTC (No-Action Letter 17-11) has now expired as of 1st September. But it is also worth bearing in mind that counterparties who did not manage to renegotiate CSAs did not necessarily have the CFTC/Fed as their lead regulator. Instead, they had to rely on the (somewhat wooly) leniency offered to them by European regulators. Not a great position to be in.
However, the economic motivations for hedging risks are still apparent, and some derivatives such as cross currency swaps and swaptions do not have (liquid) cleared hedging alternatives. It is a bilateral trade or nothing for these trades.
In addition, ISDA have highlighted in their recent commentary that physical FX Forwards will be within scope of the UMRs as of 2018. To my knowledge, this is the first time that the physical FX forward market will be impacted by the G20 reforms. We’ve seen trade reporting (physical FX is exempt), we’ve seen clearing mandates (no one clears physical FX) and we’ve seen margin rules (excluding FX). Unfortunately, in the absence of any volume transparency or trade reporting for FX, we won’t be able to monitor any nascent trends in the market if they do appear. That doesn’t sound like a healthy footing for the largest market in the world….
Below, we look at the data from US SDRs to see if there has been any change in the past six months to uncleared derivative markets.
Bilateral IRS Markets Are Shrinking
The uncleared IRS market is a shrinking beast. The combination of clearing mandates, netting & margin efficiencies at clearing houses PLUS uncleared margin rules now makes it highly unusual to trade an uncleared vanilla Interest Rate Swap.
Showing;
- The number of uncleared trades reported to US SDRs across vanilla USD, EUR, GBP and JPY Interest Rate swaps each month.
- Fewer bilateral IRS are transacted than ever before.
- It does not appear that 1st March had a particularly marked impact on behaviour, but certainly 2017 as a whole has seen very few uncleared contracts reported.
- There are now only about 2,400 bilateral trades reported each month.
- This is down from 4,500 in 2016.
- This near 50% reduction must be a result of the regulatory reforms. We know this because we have not seen an overall reduction in volumes. These previously bilateral trades have simply moved to clearing.
- We should stop and salute this result. It is surely what the regulatory community wanted to achieve and we should acknowledge this as a good thing!
- Maybe regulators bonuses will be up this year as well as Wall Street?!
Bilateral Hedging Markets Continue to Thrive
Not all derivatives are currently offered for clearing by a CCP. Two of the largest volume products that are not cleared are Cross Currency Swaps and Swaptions. Has the VM not-so-Big Bang affected these volumes? Are people worried about transacting under non-compliant CSAs and hence not trading? Are there now more unhedged risks out there as a result of these regulations?
The data suggests that volumes have not been impacted:

Showing;
- The monthly average number of Cross Currency swaps reported in 2016 was 1,660.
- The monthly average in 2017 was….1,620.
- Pretty impressive regulatory change to have such little impact.
- Perhaps this is because the physical component of FX on these basis swaps is exempt from the IM rules, therefore the amount of IM required for cross currency basis is actually pretty small?
- Nope. Even including non-resettable xccy (Fixed-Fixed and Fixed-Float), there has been no change in the number of trades reported (1,784 per month in 2017 vs 1,812 in 2016). (Non-resettables are treated like coupon swaps under ISDA SIMM, therefore generally have higher IM requirements than a resettable basis swap – see here).
- Again, this looks like the UMRs are an example of good regulation. They have had the intended impact on vanilla markets without penalising a market that remains uncleared.
Swaptions – another market that remains uncleared, have similarly seen little change:
- Swaption trade counts between 2016 and 2017 are up nearly 10% from ~4,600 to 5,000+.
And what about FX?
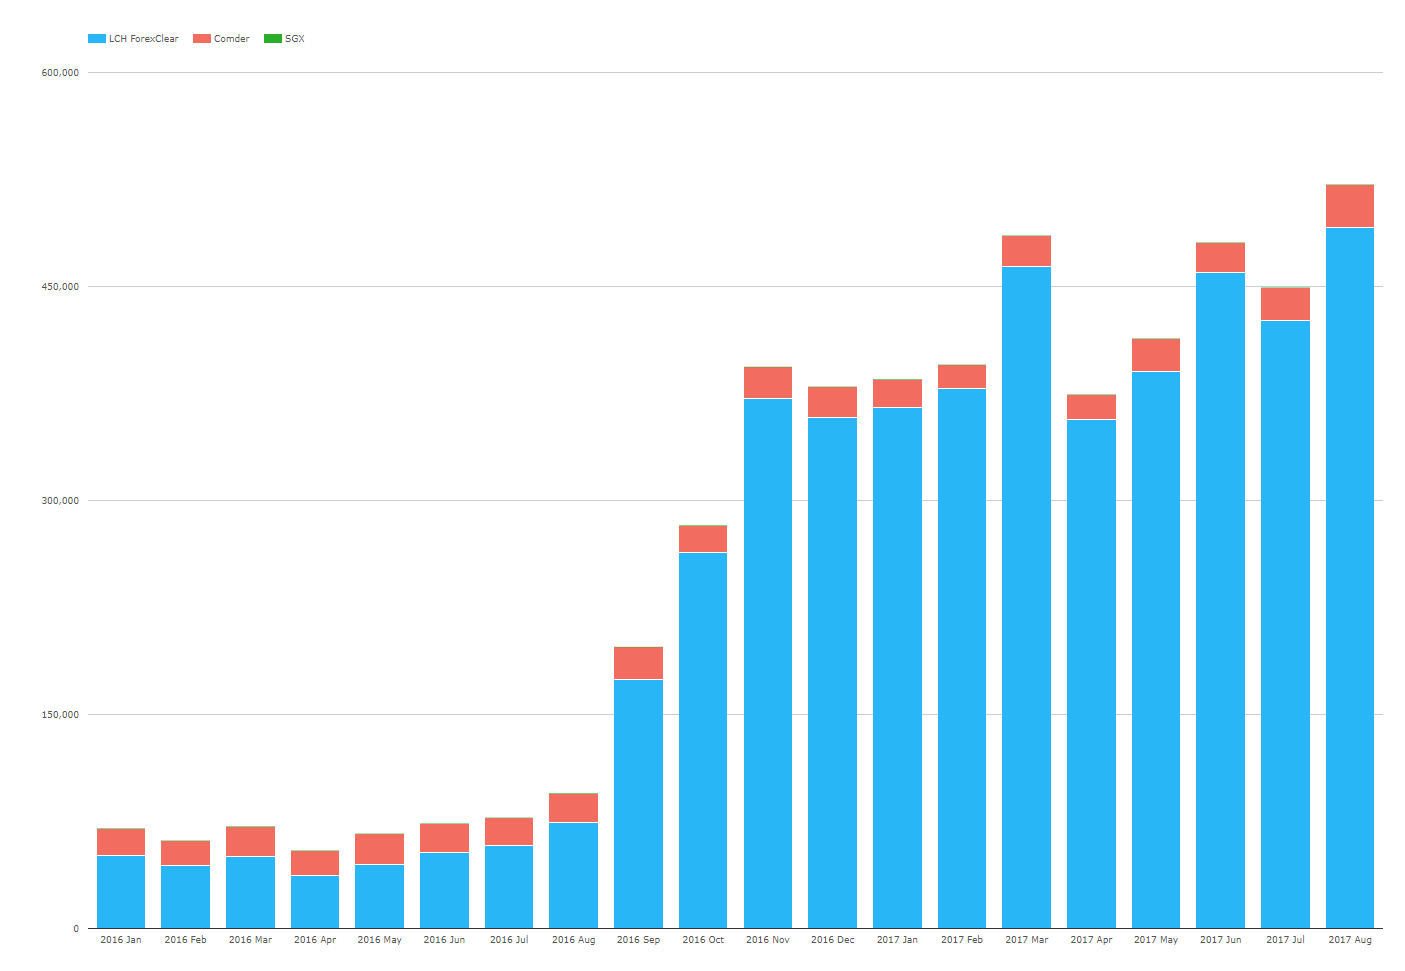
We know all about the impact of UMRs on NDFs. And CCPView shows that, again, volumes continue to rise. JP Morgan are even on-board these days….
NDF Collateralisation is Changing
There is something else going on in FX that is worth a look at as well.
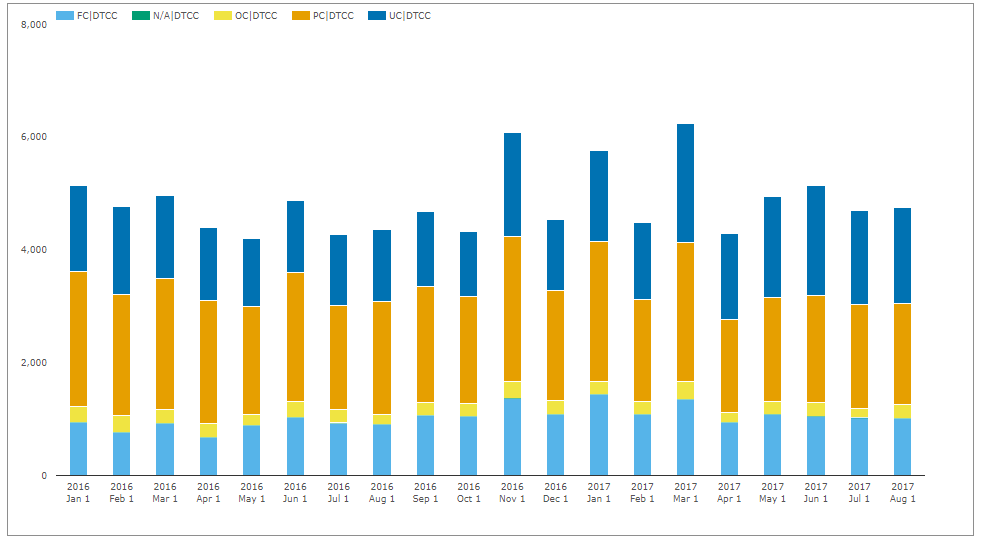
All of our charts this week have been split into 5 different types of collateralisation, covering trades that are reported as:
Dark Blue – Uncollateralised. The main target of UMRs. There should be fewer and fewer uncollateralised trades over time (assuming good data).
Green – N/A – Field left empty on the trade report. Such a shame when we are trying to track trends.
Orange – Partially Collateralised. This means that there is a two-way CSA with a minimum threshold amount. I have not seen any reporting guidelines as to whether an MTA below the e.g. $250k threshold suggested by ISDA would count as Partially or Fully Collateralised. Please comment below if you know.
Light Blue – Fully Collateralised. In a perfect world, all trades would be “FC”.
The CFTC descriptions for this collateralisation field can be found here for those interested.
In a perfect world, we would see a positive trend in all of the light-blue bars this week for all products. All new trades should have moved to full collateralisation under compliant CSAs by now, right? It might just be bad data (how can so many trades by N/A?) that we don’t see this trend across all products.
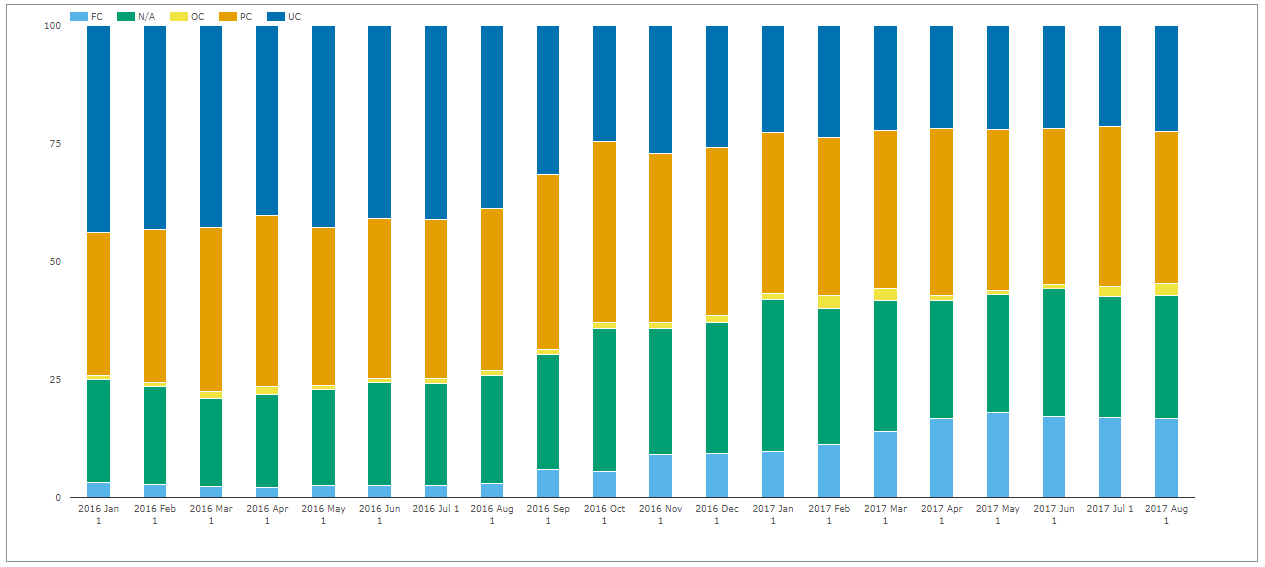
However, we DO see a trend to more and more Fully Collateralised trades for NDFs.
- In 2016 only 2.6% of NDF trades were reported as “Fully Collateralised”
- Since March 2017, this has jumped to over 17%!
The interbank move to clearing started before this jump in collateralisation occurred.
As we have highlighted, bifurcating portfolios that are collateralised under different agreements is generally a bad move. This move to collateralisation for FX markets is an important trend to monitor. To my mind, it should only hasten the uptake of NDF clearing.
In Summary
- UMRs are an example of good regulation.
- Products subject to both clearing mandates and bilateral IM (i.e. IRS) are seeing uncleared volumes going closer to zero.
- Products that are not offered for clearing (e.g. Cross Currency Swaps) have seen no negative impacts on volumes from the UMRs.
- The hard work from the regulatory community is paying off.
- FX markets will be the next sector impacted as of January 2018. We can aready see more and more NDFs subject to full collateralisation.
- If we had public FX trade reporting, we could monitor this trend across physical FX markets.
why hasn’t the swap clearing increased?
Thanks for the comment. I would say that swap clearing HAS increased. July 2016, 93% by notional was cleared in G4 currencies. This has slowly increased until August 2017, 97.7% was cleared. This is (hopefully) even more noticeable in our first chart, where we see the decline in uncleared IRS by trade number.