We analyse the SDR data in light of the whole market in the cleared Rates space. SDR data is shown to represent over 60% of total-market volumes at a trade-by-trade level. That’s huge!
It’s funny how times change. Next month, the BIS will update their semi-annual review of OTC Derivatives. As recently as 2013 I would have to (manually) update all of my presentations, marketing materials and business projections when these numbers were updated twice a year. How times change….we have this information in real-time now, and via our API.
However, it’s still worth a read – much like it’s sometimes nice to pick-up a newspaper to read yesterday’s goings-on, instead of digging out your phone/iPad/kindle for some real-time news. And in November’s edition (for June data….I can tell the BIS don’t blog every week!), they make explicit mention of the EUR exchange rate weakening and hence showing a “decline” in EUR notional amounts for IRS (footnote 1, page 2).
Well, as we all know that trend has only accelerated since these figures were published. So whilst EUR Swaps used to claim top spot in terms of notional outstanding, this is no longer the case.
We can see this trend clearly enough in CCPView when we look at Open Interest, which we collate in USD terms. The data for this year highlights the industry effort to compress outstanding trades. Couple this with the weakening exchange rate, and we see a reduction in EUR OI – particularly compared to USD swaps. Taking Rates markets, we can see a steady trend in place. USD in blue, EUR in red:
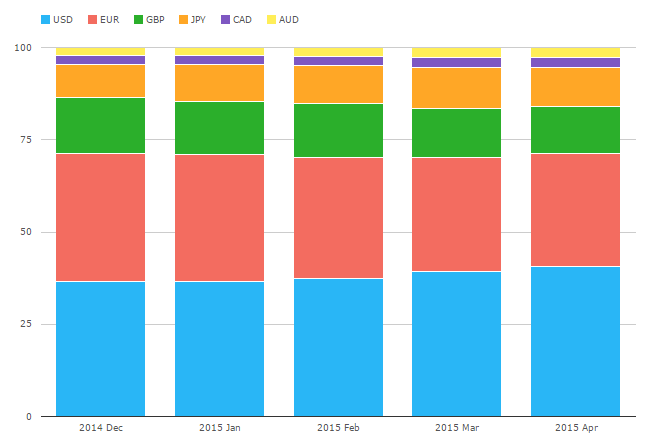
This shows that:
- Back in December, EUR Swaps OI was 35% of the market
- This has gradually shrunk to stand at 31% now.
- Whilst USD swaps have grown to 39%.
We can see a similar story when we look at volumes during March and April. Taking the week-by-week numbers, it suggests that volumes in EUR swaps are not what they once were. USD Swaps are the most traded market in notional terms right now. The graph below includes FRA volumes, but feel free to head over to CCPView, log-on, and see the comparable graph ex-FRAs:
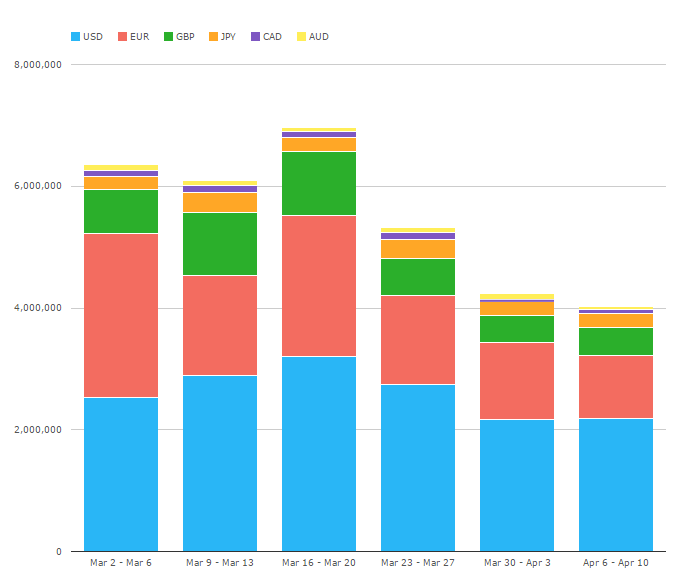
This possibly highlights the downside for the market of clearing USD swaps at a number of different venues. EUR is far more concentrated at LCH. A disjointed clearing landscape in USD leads to a higher compressed minimum, therefore fewer opportunities to compress OI and remove line items.
Okay, so EUR Swaps are not what they once were?
Correct. Volumes seem to be reducing. And remember this isn’t SDR data – it’s CCP-sourced therefore represents the vast majority of the market.
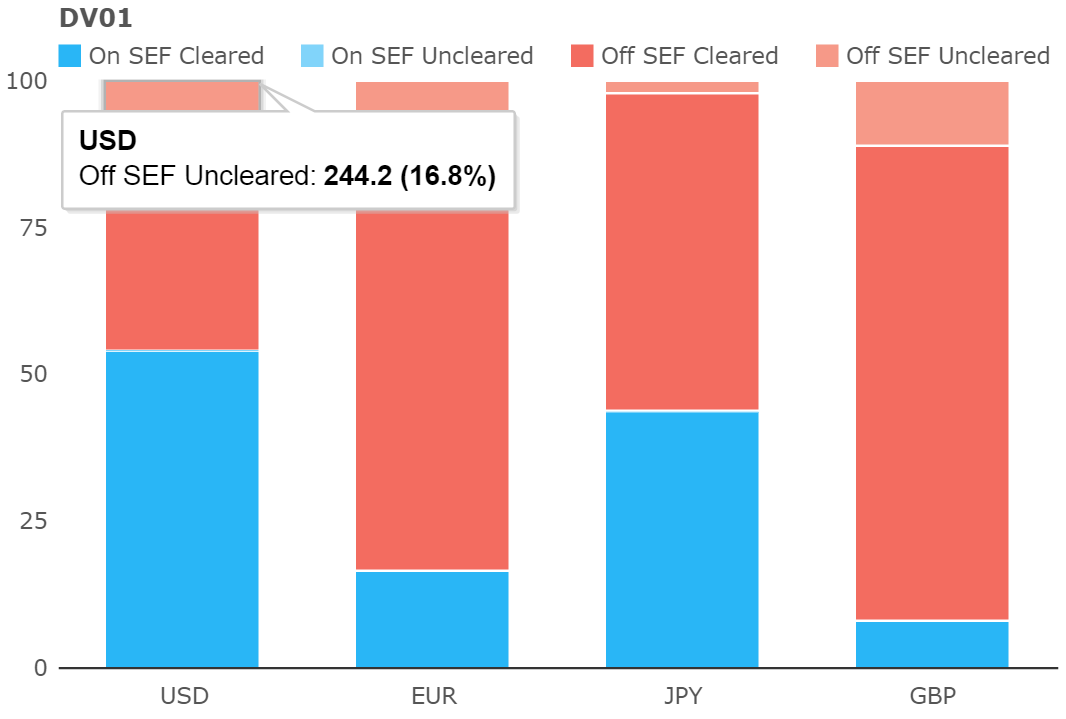
Of course, there is still an uncleared portion of the swaps market to consider. This was large in March at over 35% by notional:
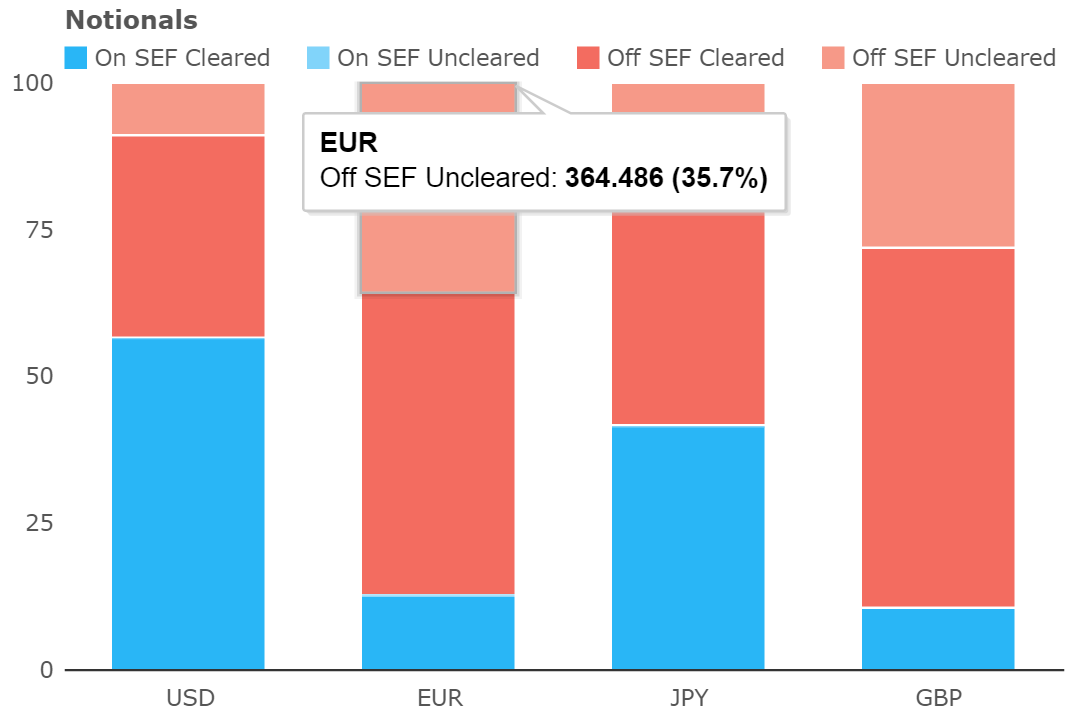
Yup, 35% of new trades in March 2015 were uncleared. In EUR! A super currency! Let’s just hope they have daily, zero threshold, single currency CSAs…..but in all fairness to the EUR market, even 9% of trades in USD went uncleared as well.
EUR Liquidity Pools
However, this looks like it could be a case of sampling bias. Looking at the liquidity pools in EUR for 2015, March was somewhat of an anomaly in terms of just how large the uncleared portion was:
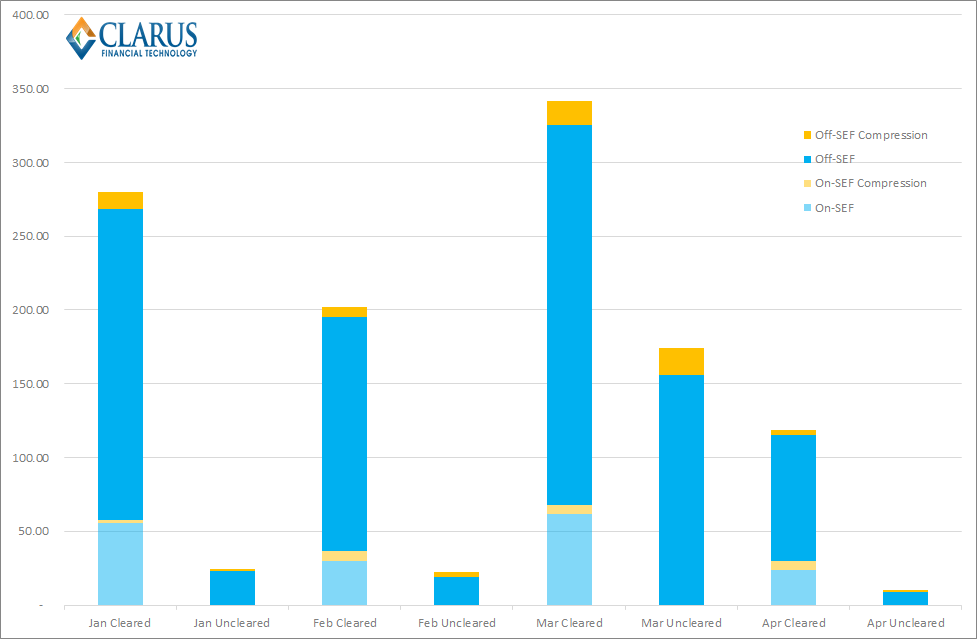
That chart explains it better than I can in words, so is worth a second look. We see a large notional amount of EUR swaps going uncleared during March. It is a surprisingly large amount – nearly as much as all of Feburary’s cleared business, and April has some catching up to do in the second half of the month as well.
Was this a facet of the IMM roll? Unfortunately, I don’t know the answer to that, but it’s yet another example of the intricacies of our data-set. And something we’ve noticed previously.
Strangely, these big chunks of uncleared business have been known to show up in the USD Swaps data as well this year. For example, despite the clearing mandate in place, February saw 17% of risk traded Uncleared in USD Swaps:
Weird. And still unexplained. Are we seeing non-US persons and/or counterparties exempt from the clearing and execution mandates reporting trades to the SDRs? It would appear so. This got me thinking….
So just how much of the market do we see in the US SDRs?
If people are reporting trades absent a requirement to do so, maybe our coverage of the market is greater than we thought? Combining CCPView with SDRView allows us to estimate what percentage of notional we see in SDRView of the total cleared market.
Assuming CCPs represent 100% of the market in Cleared space (which is a fair assumption!), let’s go take a look at the data:
For EUR Swaps
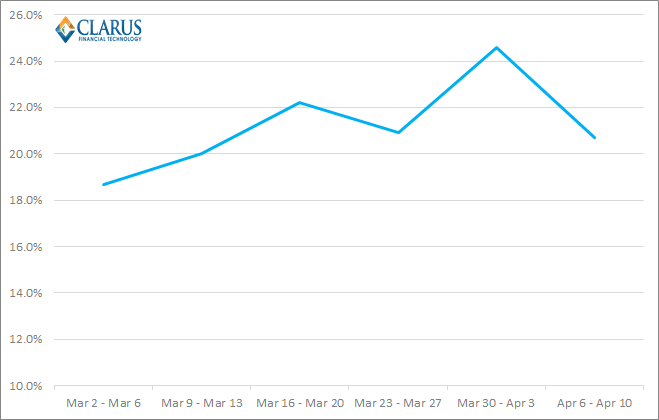
Running all EUR IRS in CCPView on a week-by-week basis versus the total Cleared volumes we see reported in SDRView for EUR Fixed-Float IRS we see a fairly stable ratio over the past five weeks, averaging 21%:
And for USD Swaps
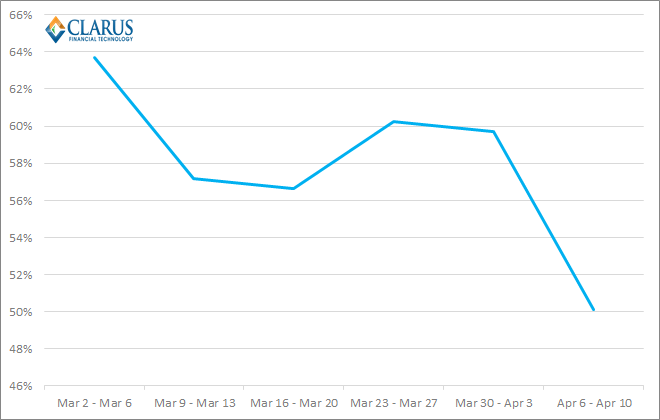
Running the same query for USD Swaps unsurprisingly yields a much higher percentage – a 58% average:
In Summary
For the cleared space, we see nearly 60% of the market reported on a trade-by-trade level. This is a commendable level of transparency, with some room for growth. We know that block trades will account for some additional volume – so this is a minimum figure. The “missing” volumes in SDRView are (on the whole) non-US persons and counterparties enjoying a reporting exemption but still want (or are mandated) to clear.
I think the interesting story is just how much of the EUR market we already see and enjoy transaction level data for. At least 21% – and when the “block effect” is taken into account, this number must be higher. It seems to me that the EUR data-set is somewhat under-appreciated.
We’ll probably never know all of the reasons for the occasional spikes in uncleared activity that we see, but it’s nevertheless important to be aware of. Equally, EUR Swaps markets don’t appear to be quite as active as they once were.
For our users, it’s worth running the numbers for longer time periods as well, to avoid any sampling bias. Time is pressing this week, but I would encourage our users to take that time!