Clearing Houses have published their latest CPMI-IOSCO Quantitative Disclosures:
- Initial margin for ETD at $507 billion is up 8% QoQ and 21% YoY
- Initial margin for IRS at $261 billion is up 4% QoQ but down 3% YoY
- Initial margin for CDS at $60 billion is flat QoQ and up 1.5% YoT
- Initial margin increased significantly at ICE Europe F&O and Eurex OTC IRS
- Other disclosures changing >10% highlighted below
- ICE Europe F&O with many noteworthy disclosures in the quarter
Background
Under the CPMI-IOSCO Public Quantitative Disclosures, CCPs publish over two hundred quantitative data fields covering margin, default resources, credit risk, collateral, liquidity risk, back-testing and more.
CCPView has over 6 years of these quarterly disclosures for 43 Clearing Houses, each with multiple Clearing Services, covering the period from 30 Sep 2015 to 31 Dec 2021. This disclosure data provides insights into trends over time at one CCP and comparisons between CCPs.
Initial Margin for IRS
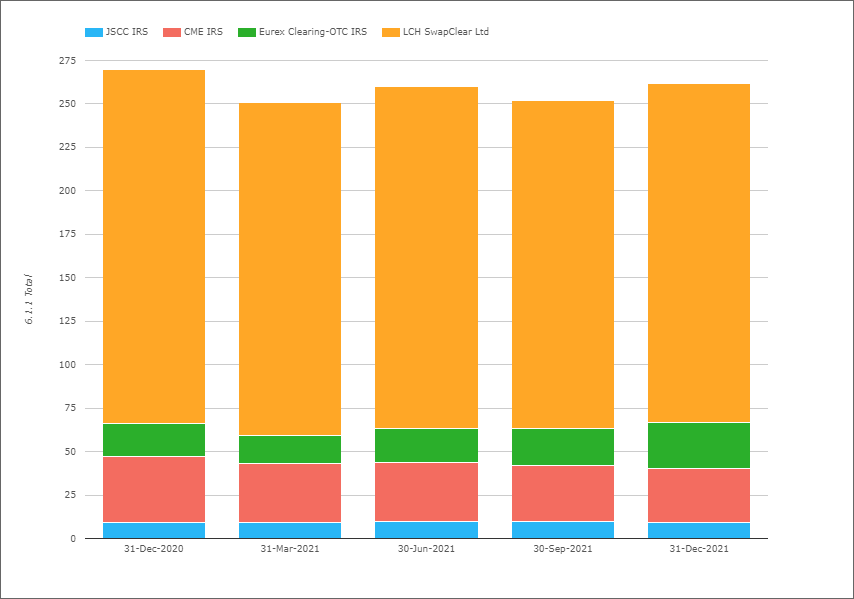
- Total IM for these four CCPs was $261 billion on 31-Dec-2021
- $9 billion or 4% higher QoQ and 3% lower than a year earlier
- LCH SwapClear with $195 billion or £145 billion on 31-Dec-2021
- Is up 3% QoQ in USD terms or 4% in GBP terms
- While YoY, LCH SwapClear is down 4% in USD terms and 3% in GBP terms
- CME IRS with $30.6 billion, down 5% QoQ and down 19% YoY
- Eurex OTC IRS with $26.7 billion or €23.6 billion
- Up 28% QoQ in USD terms or 31% in EUR terms
- Up 43% YoY in USD terms or 55% in EUR terms
- JSCC IRS with $9 billion or Y1,027 billion
- Down 12% QoQ in USD terms or 9.5% in JPY terms
- Down 6% YoY in USD terms or up 5% in JPY terms
IM for IRS staying in the $250-270 billion range for over a year now, seemingly a new plateau and a marked change from the QoQ and YoY increases in the three years from 2017-2019.
Eurex OTC IRS with large IM increases, both QoQ and YoY.
Initial Margin for CDS
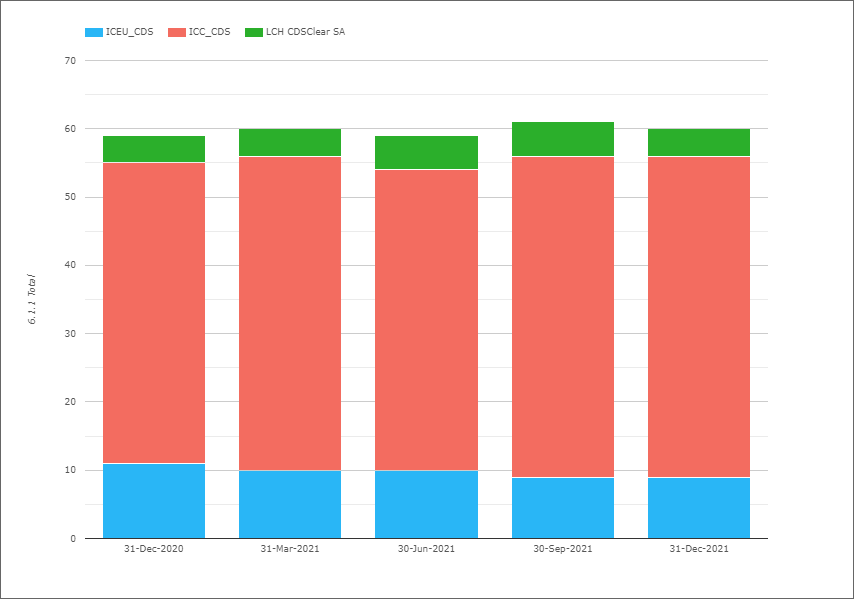
- Total IM for these three CCPs was $60 billion on 31-Dec-2021
- Flat QoQ and up 1.5% YoY in usd terms
- ICE Credit Clear with $46.9 billion, up 0.8% QoQ and 7% YoY
- ICE Europe Credit with €8 billion, down 2% QoQ and 9% YoY.
- LCH CDSClear with €3.6 billion, down 9 QoQ and up 0.6% YoY.
Overall CDS IM is flat at $60 billion for this 1-year period.
Initial Margin for ETD
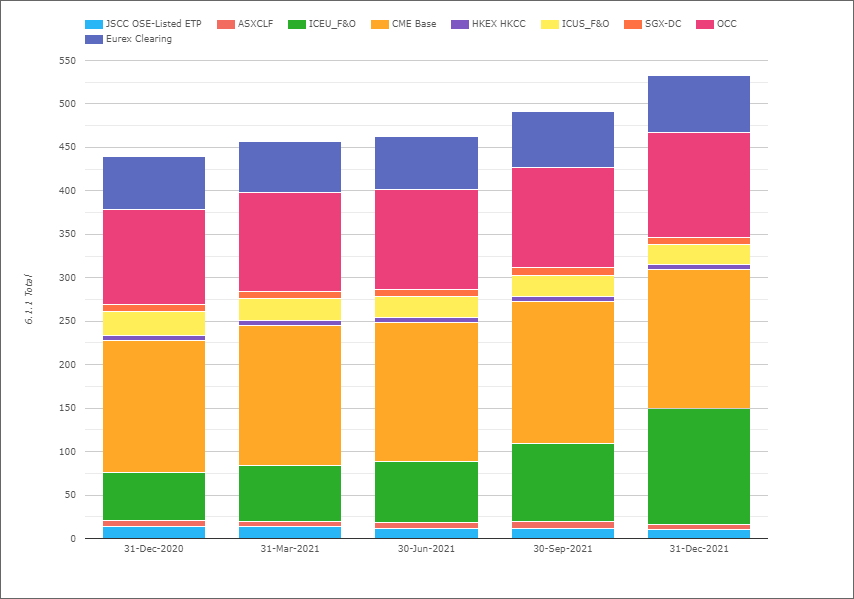
- Total IM for these CCPs was $507 billion on 31-Dec-2021
- Up $37b or 8% QoQ and up $87b or 21% YoY
- (Note the chart shows slightly higher totals as the Eurex Clearing amount in the chart includes OTC IRS IM, which I exclude in my figures here)
- CME Base with $159 billion, down 3% QoQ and up 5% YoY.
- ICE Europe F&O with $134 billion, up 48% QoQ and up 79% YoY!
- OCC with $121 billion, up 5% QoQ and up 11% YoY.
- Eurex with $39.4 billion, down 8% QoQ and down 7% YoY.
- ICE US F&O $23.2 billion, down 2% QoQ and down 3% YoY.
- JSCC OSE Listed ETP with $10.5 billion, down 12% QoQ and 26% YoY
- SGX-DC $8.4 billion, down 5% QoQ and up 8% YoY
- ASX CLF $6.2 billion, down 10% QoQ and 13% YoY
- HKEX HKCC with $5.8 billion, down 9.6% QoQ and flat YoY
ETD IM rising QoQ by $37b and YoY by $87b, due to ICE Clear Europe increases of $44b QoQ and $79b, continuing with it’s trend from the prior quarter.
Other Disclosures of Interest
Next let’s do a quick scan of 31-Dec-2021 disclosures, highlighting a few with a change tolerance >10% outside the 3 year range of values:
- B3 – 15.2.4 Total Assets increasing from $8.7 billion to $9.6 billion and 15.2.5 Total Liabilities increasing even more, from $4.15 billion to $5.6 billion
- B3 – 16.2.1 Percentage of total particpant cash held as cash deposits (includind reverse repo) increasing from 22.7% to 32.9%, by far the highest in our 3-year period, with a commensurate drop in 16.2.10 percantage of cash in domestic sovereign bonds
- BME – Equity 4.1.4 Prefunded aggregate pariticipant contributions required is up to €291 million from €190 million at prior quarter end
- BME – Power, 4.1.4 Prefunded aggregate pariticipant contributions required up at €146 million from €59 million and 6.1.1 Total IM required was €805 million, up from €620 million, €295 million and €148 million in prior quarters
- CCIL – Forex Forwards 6.8.1 Maximum aggregate IM call on any given day in the period was $4.3 billion, up from $3.8 billion and higher than 6.1.1 Total IM required of $4.2 billion!
- CDCC – 15.2.4 Total Assets almost doubled to C$46 billion from C$25 billion, while 15.2.5 Total Liabilities similarily increased to C$46 billion from C$25 billion
- CDCC – 23.3.1 MX ADV submitted by execution facility or matching/confirmation venue was 654,367, up from 444,375 in the 31-Dec-2020 quarter
- CDS – Canadian Depository for Securities, 4.1.4 Prefunded aggregate pariticipant contributions required was C$656 million up from $380 million and 4.1.8 Committed aggrgegate participant contributions to address an initial default was C$4.6 billion up from C$2.66 billion
- CME – Base 4.1.4 Prefunded aggregate pariticipant contributions required was $5.9 billion up from $4.95 billion and 4.1.8 Committed aggrgegate participant contributions to address an initial default was $16.2 billion up from $13.6 billion
- CME – Base 4.4.7 Estimated largest stress loss (in excess of IM) from the default of any two participants, PeakDayAv was $5.5 billion up from $4 billion in the prior quarter and the highest in our 3-year period
- DTCC – NCC 18.3.2 Percentage of IM posted by the largest 5 clearing members (for a service with >25 members), including both house and client, in aggregate, PeakInQuarter was 54%, up from 38% and by far highest in our 3-year period, the low being 25% and previous high 44%
- ICE Clear Europe F&O – 4.4.10 Actual largest credit exposure in excess of IM to any two participants and their affliates, peak day amount in prior 12 months was $1.7 billion, the prior record high was $1.28 billion in Dec-2018 quarter
- ICE Clear Europe F&O – 6.1.1 Client Gross IM required was $98 billion, up from $61 billion, $47 billion and $42 billion in prior quarters and $36 billion on 31-Dec-2020
- ICE Clear Europe F&O – 6.7.1 Maximum total VM paid to the CCP on any business day was $15 billion, up from $6 billion in the prior quarter and far higher than the prior high of $10 billion in 31-Mar-2020 (the Covid Crisis quarter)!
- ICE Clear Europe F&O – a number of other disclosures > 10% up, …
- …..
There are a lot more Clearing Services and Disclosures but I will stop there and leave it to those of you with your own CCPView access to analyze further changes.
As well as a Web UI, we also offer an API to programatically access this data.
IOSCO Quantitative Disclosures
CCPView has disclosures from 43 Clearing Houses, each with many Clearing Services, covering Equities, Bonds, Futures, Options and OTC Derivatives with over 200 quantitative data fields each quarter and quarterly figures from September 2015 to December 2021. That is a lot of data to analyze and inform.
Please contact us if you are interested in subscribing to CCPView.