In April, Amir gave a timely update on Term SOFR. In case you missed it:
And the calls from the industry to make Term SOFR a more widely traded derivative have only become louder since, with the latest Risk.net article particularly worth a read:
It’s a great article, but it does not update readers on the volumes traded. So let’s turn to our SDR data to take a look.
Swaps versus Term Rates
As a reminder, when we say Term SOFR, we mean the forward-looking versions of the rate. Whilst Term SOFR potentially shares a lot of fundamental characteristics with the soon-to-cease IBORs, its use is still allowed in certain restricted circumstances – hence we see derivatives being written (and reported) against Term SOFR in the SDR data.
First, a bit of data housekeeping. Because Term SOFR is a *ahem* term rate, it will show up in our SDR data as a Fixed-Float IRS. This is exactly the same as LIBOR swaps, so whilst the move to RFRs has largely resulted in IRS being replaced by OIS, Term SOFR swaps are reported as IRS.
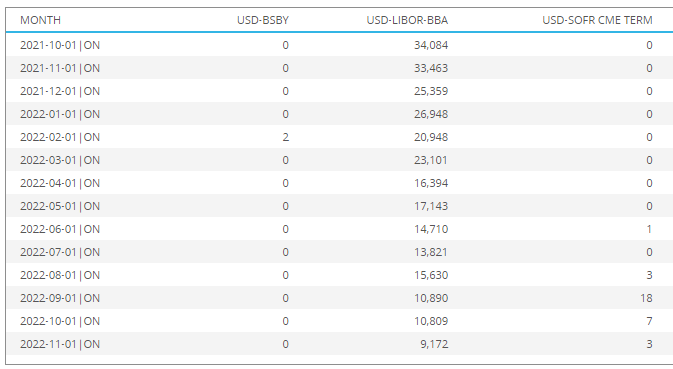
Looking at USD IRS traded in the past 12 months:
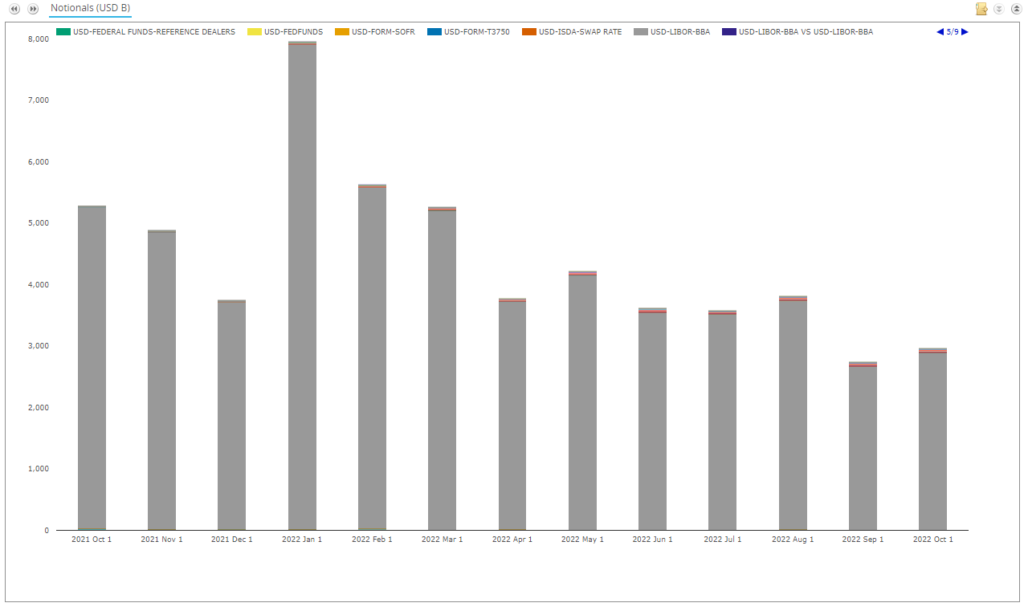
Showing;
- USD LIBOR swaps still dominate the volumes reported as Fixed-Float IRS in USD markets, even in October 2022 (the grey bars).
- IRS reported to SDRs in USD have seen 9 pages worth of index names in the past 12 months! (the 1/9 in the top right corner).
- The raw data therefore needs some manual cleaning to strip-out meaningful volumes – USD LIBOR, USD BSBY and Term SOFR.
USD LIBOR IRS
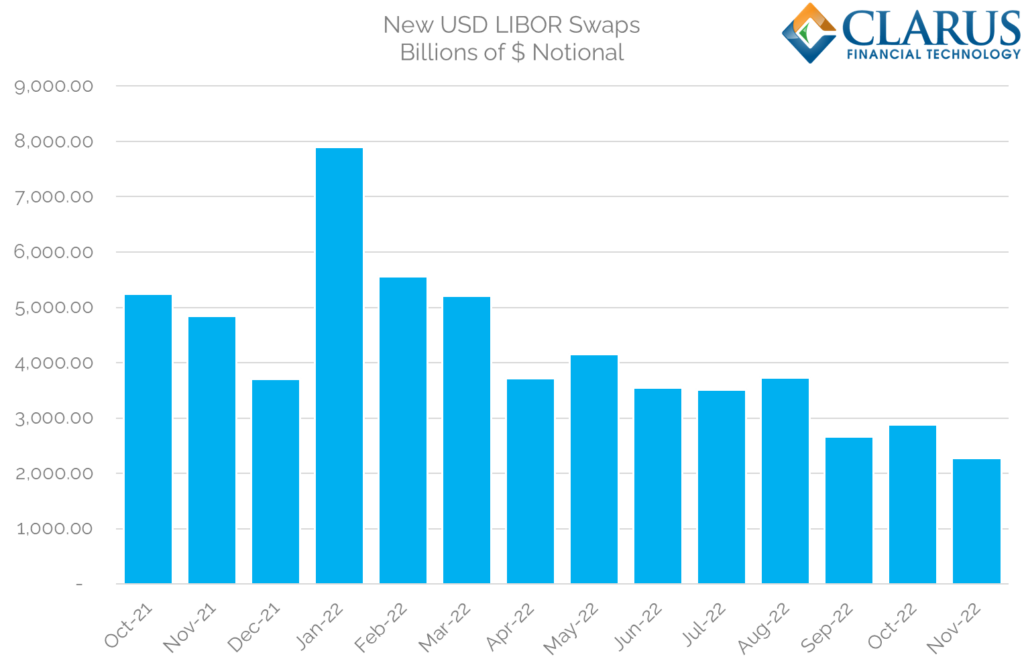
Let’s first clarify why SOFR Adoption is still not at 100% in OTC markets. Currently, we are seeing over $2.5Trn (!) of new USD LIBOR swaps reported to SDRs every month. For perspective:
- This is 45% lower than this time last year. Which is good!
- 88-90% of this volume is related to short-dated Single Period Swaps (SPS). Also good for transition!
- Recall that SPS have replaced FRAs as a short-end risk management tool for swaps dealers because SPS are compatible with the ISDA IBOR Fallback Protocol. FRAs are not compatible with the Fallbacks due to their upfront payment.
Nevertheless it does make for a scary chart. So – scary chart alert! New notional of USD LIBOR swaps currently being reported to SDRs:
This is also why, when looking at the global view of USD markets in CCPView, we see so much of the LCH USD IRS activity in their “2Y” tenor. This is all actually SPS activity, not simply a reflection that there is more “short-end” LIBOR trading due to the Fed being in play:
These factors, along with half of Futures trading being in non-SOFR products, means the SOFR Adoption Indicator has some way to run before cessation.
Term SOFR
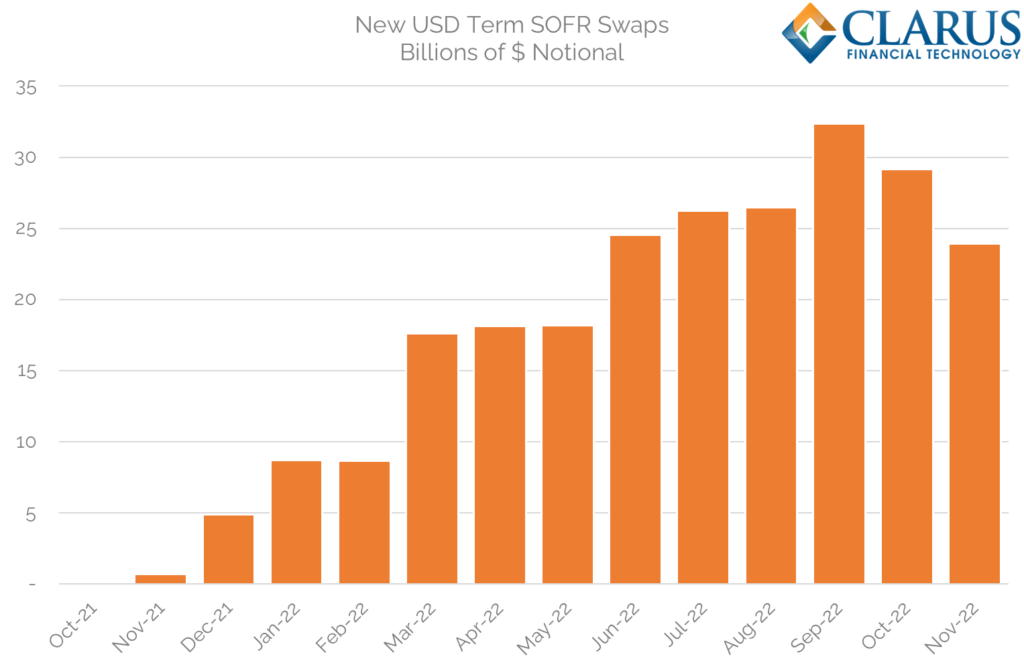
Anyway, you didn’t come here to hear about the RFR Adoption Indicator. You have our monthly blogs and the ISDA report for that! On to Term SOFR. What volumes have been reported to SDRs so far?
Showing;
- PLEASE NOTE the change of scale here! We had Trillions (1,000s of Billions) for LIBOR swaps. We are now talking tens of Billions only.
- These are monthly volumes for all flavours of Term SOFR – 1M and 3M.
- The record monthly volumes ever reported were $32Bn, which was in September.
- As we saw, activity across markets was generally lower in October.
- November, up to the 20th, has already been a pretty active month in Term SOFR. With a holiday shortened week this week, I guess it is unlikely to break the all-time record.
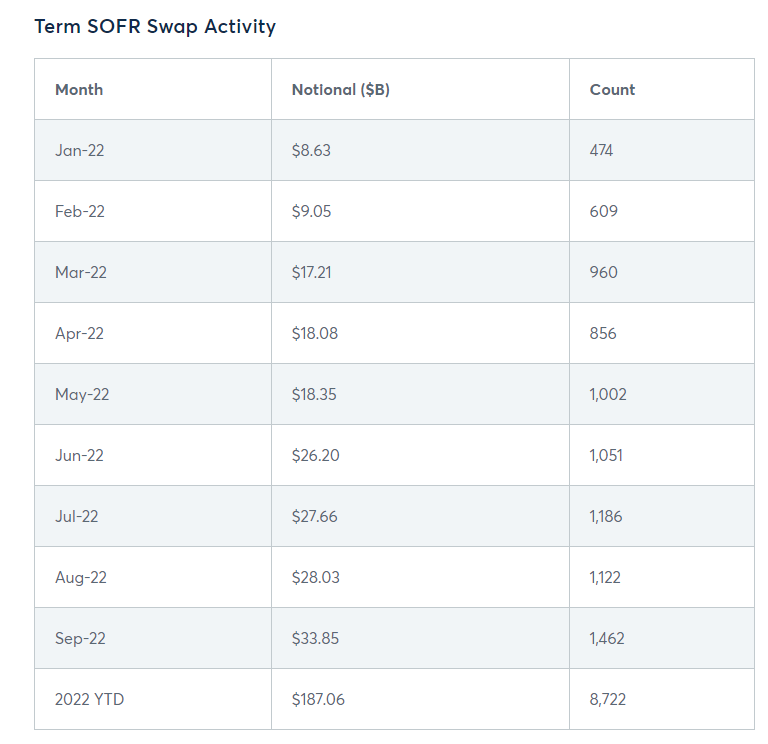
Whilst notional amounts cannot hold a candle to USD LIBOR activity, there is a surprisingly high number of swaps now being reported each month. As CME kindly point out on their “Term SOFR” page, Clarus data can be used to monitor monthly trade counts and notionals of Term SOFR Swaps:
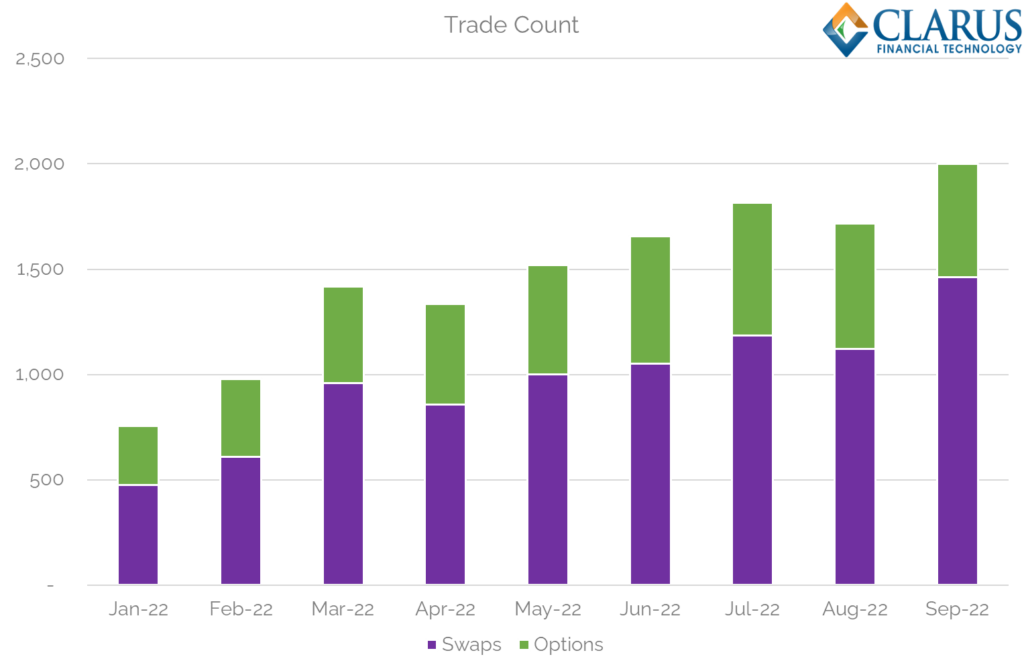
And as the CME page highlights, there are also a significant number of Caps traded each month:
Some points generally on the Term SOFR market:
- 2,000 trades a month is not to be ignored!
- All of these volumes should be uncleared. No CCP offers clearing of Term SOFR derivatives (to my knowledge?). There are 4 Term SOFR swaps that were reported as “Cleared” in SDR data in August – I am pretty sure that this must be bad data.
- We expected all of these volumes to be traded off-SEF. However, we see 32 swaps reported on-SEF (and one Cap!):
Looking at the 3 “on-SEF” swaps in November, they are “strange” – two with negative rates, all below any minimum sizes that would be acceptable on IDB SEFs. Indeed, IDB SEFs report all of their volumes as OIS now – with only Bloomberg SEF and Tradeweb SEF continuing to show volumes in IRS for USD in November (excluding SPS). Is this bad data? Or is there a SEF processing Term SOFR – please let us know in the comments below.
Term SOFR Tenors
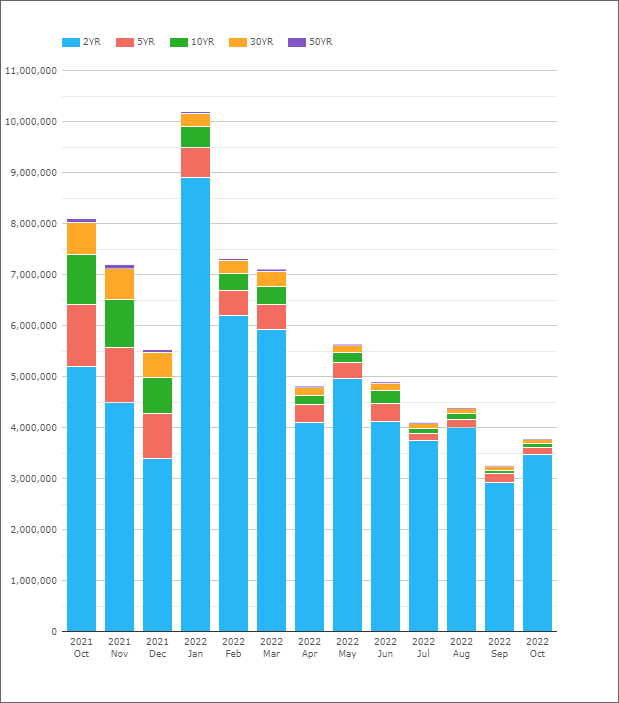
Looking at trade activity over the past 12 months, for Fixed-Float Interest Rate Swaps only, we see a large peak in activity at 5Y:
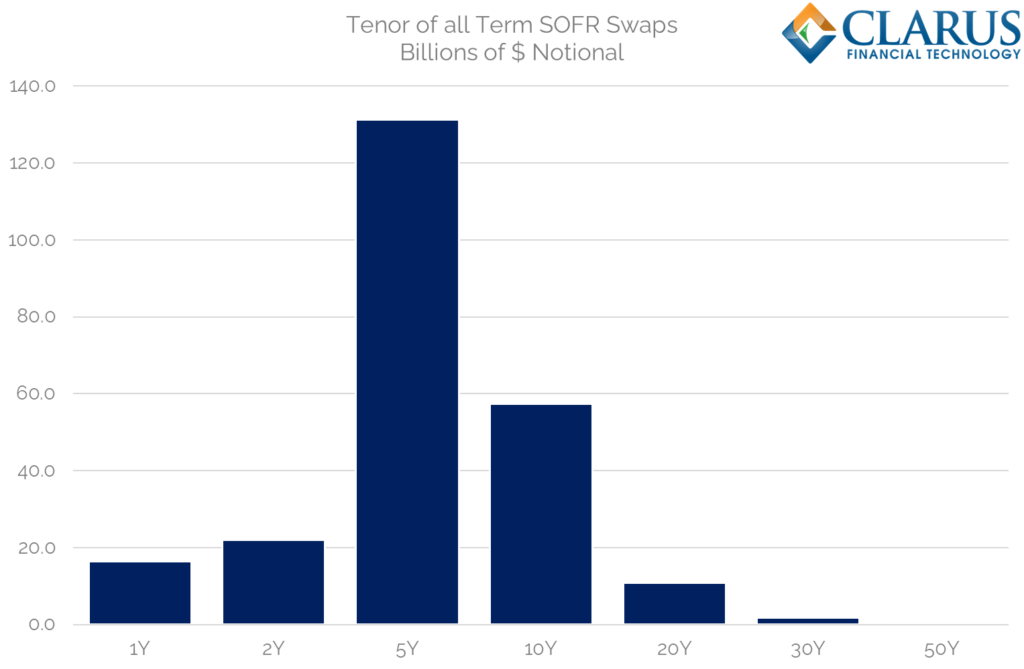
Showing;
- A large concentration of activity in the “belly” of the curve. I have standardised tenors here, so that anything between 2Y+ and 5Y maturities are all shown in the “5Y” bar above.
- We see trades up to 30Y (nothing longer…yet).
- And of course activity at the short-end as well.
- However, the area of most activity is certainly in the 2Y-10Y area of the curve.
- Therefore, unlike our friend CCP Basis, where the price differential is most visible in the long-end (30Y), market participants are likely to see 5Y as the main “pain point” for the basis.
To date, there is no reason to think that any price differential that may occur would tail off after 5Y, but that is surely sensitive to the precise end-user requirements being hedged via this particular index.
Average trade size has been pretty steady in Swaps at around $20-25m, and a lot of activity is clearly centred around 5 year maturities. It really does feel like this is all activity tied to end user loans (albeit pretty big loans!).
Term SOFR Basis
Which all leads to more than a handful of Term SOFR basis trades occurring. Some are versus USD LIBOR (which is a pretty neat idea, given that both are forward-looking rates). But there are more trades versus SOFR daily compounded:
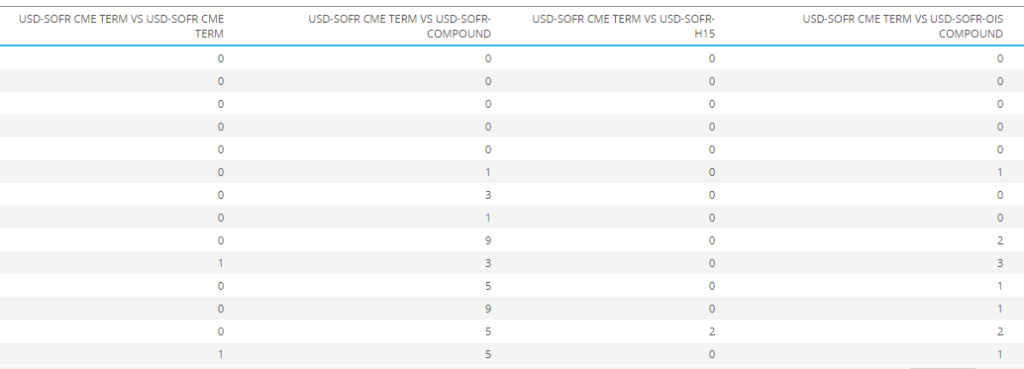
However, it really is a drop in the ocean compared to 2,000 Term SOFR trades on an outright basis. Whilst these basis trades are much larger – something like $150m-200m a clip – there is clearly not enough activity to “recycle” the risk from the underlying trades. There is some evidence from the prices reported that the clearing cost of the basis is about 3 basis points in 5Y, but don’t hold me to that! It is a thinly traded market, with potentially some hiccups in data reporting as well.
The big question remains as to how the dealer community can continue to service 2,000 trades a month and be able to recycle Term SOFR risk without being able to trade in the IDB market.
Answers on a postcard please?