At the end of my article on Final US Rules for Non-Cleared Swaps, I noted that I would look at ISDA’s Standard Initial Margin Model (SIMM). On doing so, I was surprised to see the direction that ISDA is now taking, one that I did not expect. Read on to find out why.
Background
The ISDA SIMM methodology was first made public in December 2013, with the publication of this document.
[UPDATE: We now offer free 14-day trials for our SIMM for Excel product ]
I recall reading this and being in general agreement with the methodology outlined:
- Two calculations steps, market shocks applied to portfolio and then an aggregation method
- 99% confidence level over a 10-day margin period of risk
- Model validation, supervisory co-ordination and governance
- Use of portfolio sensitivities (greeks) rather than full revaluations
- Inclusion of collateral haircut calculations within the calculation
In particular the recommendation of using risk sensitivities struck me as a sensible approach given the difficulty in agreeing pricing models for every type of exotic derivative and the performance requirements of non-analytic models.
What I Expected
Given this, I expected ISDA SIMM to be a standard Historical Simulation Value-at-Risk analysis, but one that used risk sensitivities as inputs.
Why?
Because every CCP that clears Interest Rate Derivatives (by far the largest Asset Class) uses Historical Simulation.
From LCH SwapClear with $trillions cleared over many years, through to CME, JSCC, Eurex, SGX, ASX, HKEx, …
Historical Simulation is the most common method used for market risk monitoring and risk capital (Basel II).
Market participants have existing systems that implement the methodology.
The industry has many years of experience in using the methodology, including lessons learned from the Financial Crises of 2007-8, resulting in the concept of Stressed VAR.
So a reasonable enough expectation and nothing in the ISDA SIMM document led me to believe otherwise.
ISDA WGMR
Imagine my surprise when I decided to look at the current progress of the ISDA Working Group on Margin Requirements (WGMR) and found that ISDA SIMM has developed quite differently.
Current documents can be found at the ISDA WGMR Implementation Initiative page, where on October 1, 2015, a Discussion Document, the Methodology v3.2 and Risk Data Standards documents were published.
My original intention had been to review and provide an outline of the Methodology document, but while there is much of interest there, I am afraid so far I have failed to get over my shock of not finding the details of a standard Historical Simulation approach.
Instead I found a methodology that I do not entirely recognise.
Below are a few extracts from the document that are applicable to Interest Rate risk:
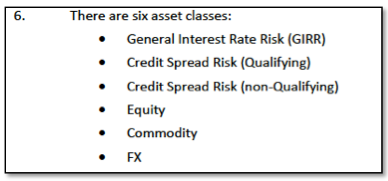
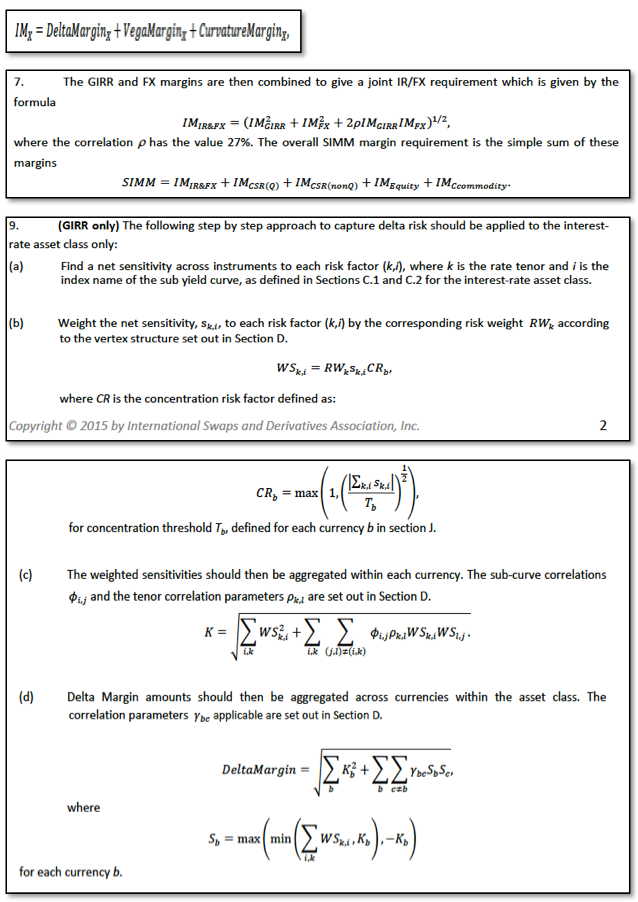
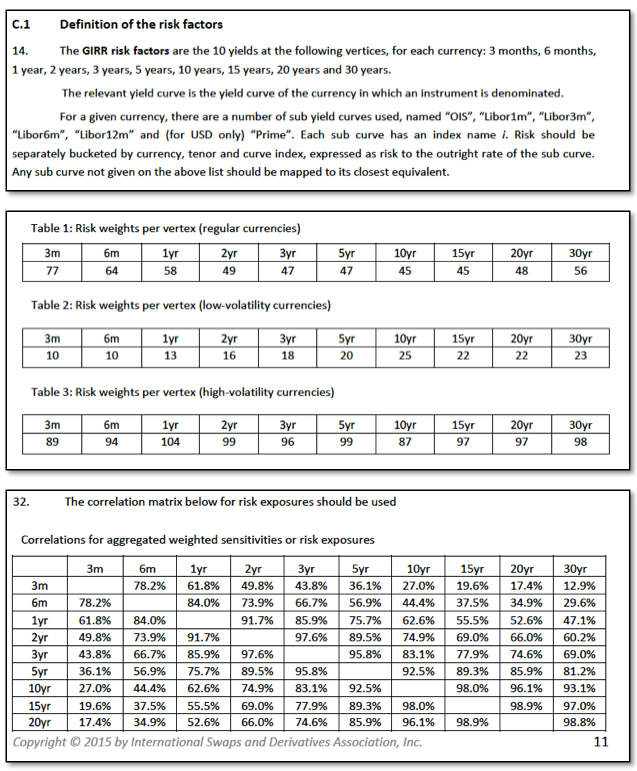
It looks a bit like Parametric Value-at-Risk, in that there are tables of risk weights for interest rate factors in regular, low volatility and high volatility currencies and a matrix of correlations.
But it is different enough to not be Parametric VaR (also known as Variance Co-Variance).
And given that there is a Patent Pending footnote on the first page of the document, the positioning is clearly that this is a new methodology being proposed.
Do we really need a new methodology?
And is it really simple and easy to replicate?
How often have IT folks heard from a business user that it is really simple and then many months/years later with thousands/millions under the bridge it becomes evident that there was a lot of devil in the detail.
A History of VAR
Those of you old enough and with a good memory, will recall that in 1994 JP Morgan published its RiskMetrics methodology. Useful links on this include Wikipedia, Investopedia, Introduction to the 4th Edition, Technical Document.
RiskMetrics introduced the three commonly accepted VaR methodologies; Parametric, Historical Simulation and Monte-Carlo Simulation.
The advantages and disadvantages of each are well covered in the literature and standard text books e.g. Philippe Jorion, Carol Alexander, Glyn Holton. For those needing a short refresher, see my Value-at-Risk presentation and no doubt there are many others searchable by Google.
I am not going to try and cover these pros and cons of each method again, suffice to say that over the past twenty years, the de-facto standard has emerged as Historical Simulation.
Not only have global banks been using Historical Simulation internally for many years, they have also been reporting these figures to regulators and publishing in their annual reports. And since 1999, LCH SwapClear has been using Historical Simulation for the calculation of Initial margin.
For me it makes the most practical sense to use Historical Simulation for non-cleared derivatives.
Final Thoughts
The ISD WGMR documents all have a page header as follows:

I for one hope that the red-text is indeed true and that WGMR members re-consider.
Standardising on Historical Simulation would be a far better way to go.
Market participants will then be able to utilise their existing investments and real-world experience.
There is a value to the industry in standardising the definition of risk sensitivities.
There is even more value in specifying risk data standard formats.
There is value in specifying historical periods to be used for each asset class.
There is even more value in providing standard scenario data for these periods.
Lots of work for the ISDA WGMR to do.
Lets hope it gets done as September 2016 is less than a year away.
Whilst you may be shocked and surprised – the move to a new model for IM will generate work for many people to build, implement and test the ISDA SIMM, which can only be a good thing. I’d like to see ClarusFT build that model and run a comparison against HVaR to see how the distribution compares, and ultimately the relative effectiveness of the two models in the various asset classes.
True that there are Pros and Cons to that and depending on your perspective one outweighs the other.
However on balance I do not think it is a good thing for the market as a whole.