Following on from my recent Capital Ratios and Risk Weighted Assets for Tier 1 US Banks article I wanted to look at the equivalent metrics from European Banks.
Background
One of the lessons learned from the Great Financial Crisis was that Banks were generally under capitalised commensurate to their risk exposure, leading to new Basel III regulations increasing both the amount and the quality of capital required. Capital regulations specify the minimum amount of capital as a percentage of risk weighted assets (RWA).
The table below shows the phase-in timeline for the new Basel III capital regulations.
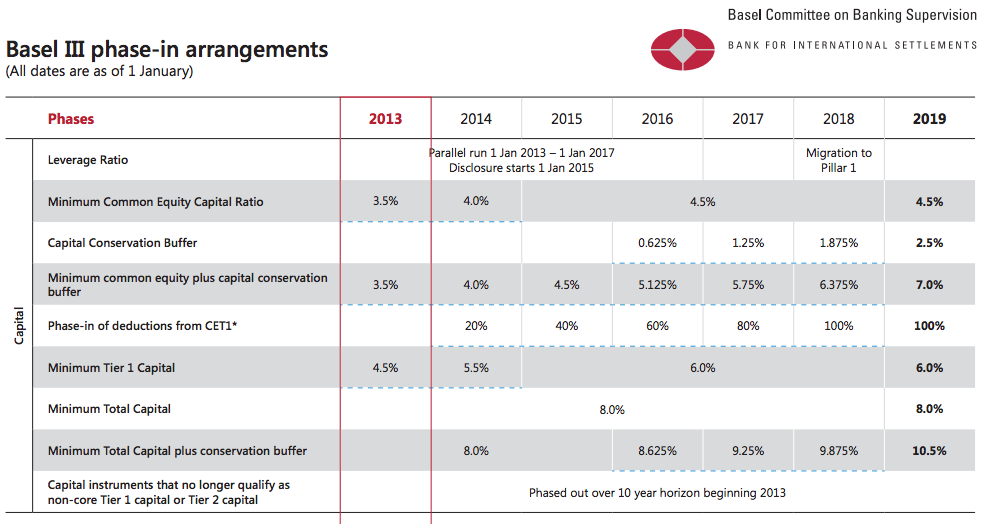
- Minimum Common Equity (CET1) ratio is now 4.5% of RWA
- CET1 + Additional Tier 1 capital gives Total Tier 1 Capital, which is now 6% of RWA
- Tier1 + Tier 2 gives Total Capital, which is now 8% of RWA
- Conservation buffers will take this up to 10.5%
In addition Global Systematically Important Financial Institutions (SIFIs) are required to have additional CET1 ranging from 1% to 2.5% and possibly a further 1% could be applied, meaning minimum CET1 ratios of 7% or minimum Total Capital Ratios of 14% are possible for some firms.
Lets look at some data.
Capital Ratio Comparisons
In my earlier article I noted that US Banks CET1 ratios had increased over the past year and ranged from 11% at Bank of America to 17.4% at Morgan Stanley, with a 12.75% median; so well above the regulatory minimums.
Lets look at selected European Bank’s quarterly data from March 2016 to June 2017.
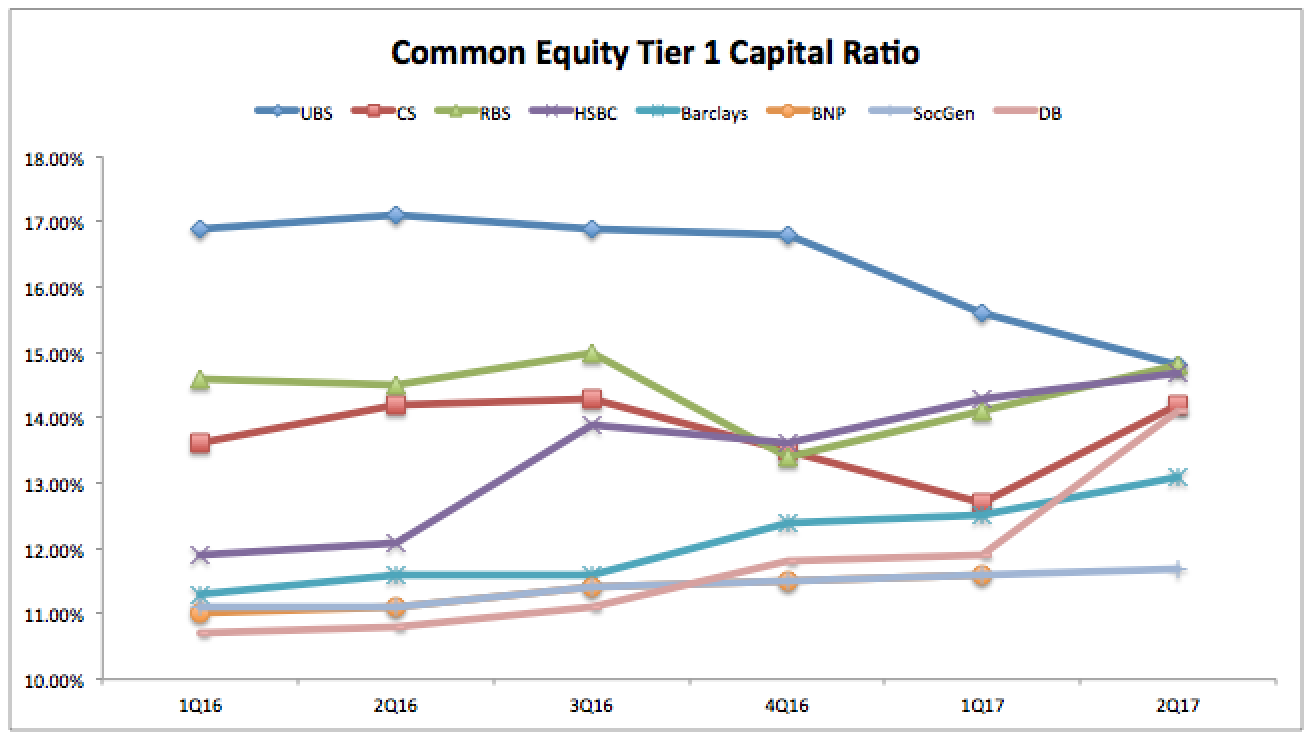
Showing that:
- All have CET1 ratios above 10%, well above the minimum requirements of 4.5% to 7%
- (Computed in EUR using the exchange rate as of each each quarter end)
- UBS’s CET1 ratio has decreased from 16.9% to 14.8% over the period
- Credit Suisse’s CET1 ratio has increased from 13.6% to 14.2%
- RBS CET1 ratio has increased from 14.6% to 14.8%
- HSBC’s CET1 ratio has increased from 11.9% to 14.7%
- Barclays CET1 ratio has increased from 11.3% to 13.1%
- BNP and SocGen CET1 ratios are almost identical increasing from 11.1% to 11.6% (1Q17)
- Deutche Bank’s CET1 ratio has increased from 10.7% to 14.1%, with a sharp jump in 2Q17
Generally stronger capital ratios over the course of the year and well above regulatory minimums, with most of the banks converging to a 14.x% figure, except for Barclays at 13.1% and BNP and SocGen at 11.6%. Only UBS has decreased its CET1 Ratio from a high looking figure of 16.9%.
Of-course the regulatory minimum ratios are just that minimums and banks will decide on a buffer above that commensurate with their business mix, management policy and share holder views.
Capital Ratios can be increased by either increasing the Capital measure or decreasing the RWA measures and decreased by doing the opposite, so lets look at which of these has happened for these eights banks.
Common Equity Tier 1 Capital
Lets look at the Common Equity Tier 1 Capital, which consists of Common Stock and Retained Earnings.
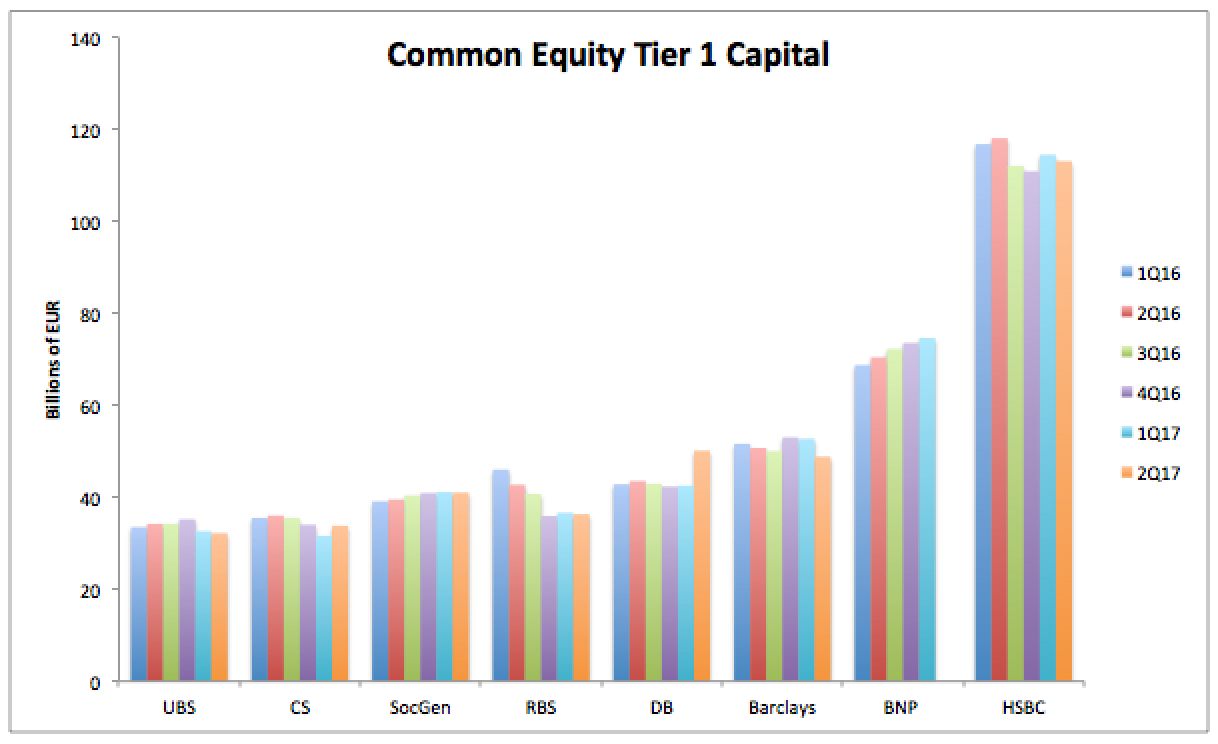
Showing:
- The relative CET1 Capital held by these firms
- Ranging from €32 billion at UBS to €113 billion at HSBC
- UBS, CS, SocGen show little change over the period
- RBS is down from €46 billion to €36 billion
- Deutsche Bank is up from €43 billion to €50 billion, the increase in 2Q17
- Barclays shows a small drop, ending at €49 billion
- BNP a gradual rise from €69 billion to €75 billion (1Q17)
- HSBC is by far the highest, with a small drop from €117 billion to €113 billion
A mixed picture, with only Deutsche Bank exhibiting a sharp increase and RBS a significant decrease.
The four largest US Banks have CET1 Capital ranging from $150 billion to $184 billion and dwarf all European banks with only HSBC being in the same ball-park with €113 billion. BNP with €75 billion and two not in my chart, Santander with €72 billion and Credit Agricole with €78 billion are the next largest in capital terms.
Risk Weighted Assets
Next lets turn to the denominator of the Capital Ratio; RWA and look at the quarterly trend in these.
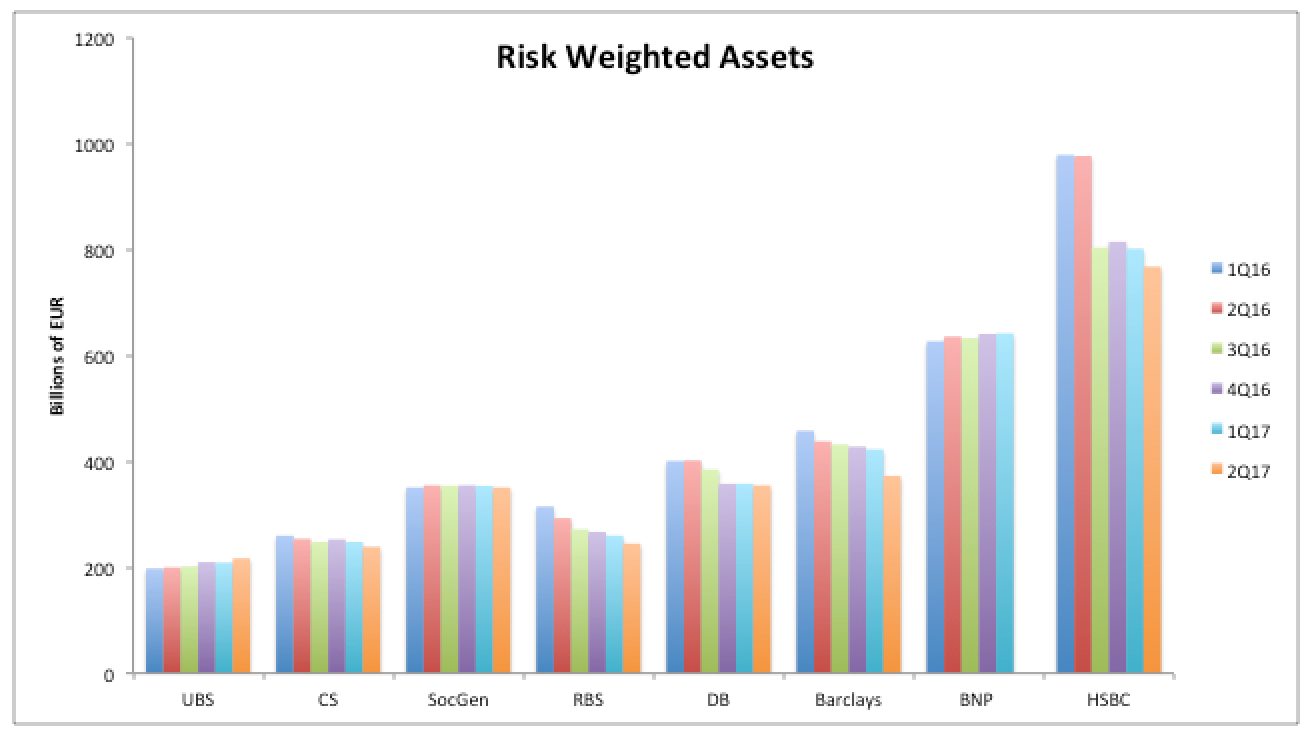
Showing:
- The RWAs for each of the banks
- Ranging from €200 billion to €980 billion
- UBS RWA is up 10% to €217 billion
- CS RWA is down 8% to €239 billion
- SocGen unchanged at €351 billion
- RBS down 22% at €245 billion
- DB down 11% at €355 billion
- Barclays down 19% at €373 billion
- BNP up 2% at €642 billion
- HSBC down 22% at €768 billion
So down across the board, most at the three UK banks and Deutsche bank, with the two French Banks unchanged and only UBS with an increase in RWA.
We can now say that the higher Capital Ratios are mostly due to a reduction in RWAs, with only DB also increasing its Capital significantly.
Lets now drill-down further into what makes up these RWAs.
RWA by Risk Type
Taking the 31 March 2017 figures, we see the breakdown by risk type.
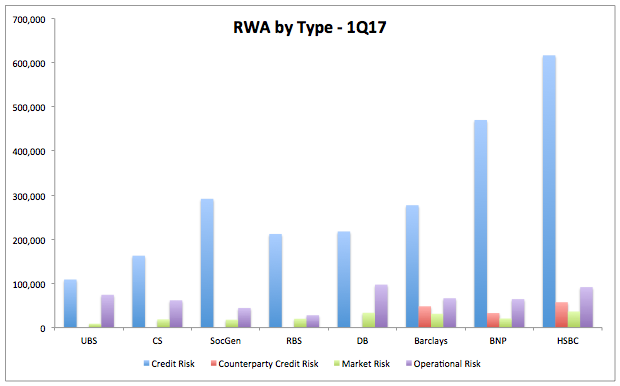
Showing that:
- Credit Risk RWAs are by far the largest
- As we would expect, given that the main business of banks is credit intermediation
- Banks with retail and wholesale lending businesses have particularly large Credit Risk RWAs
- From UBS with €109 billion to $617 billion at HSBC
- (For US Banks, comparison is Morgan Stanley’s $167 billion to $957 billion at Bank of America)
- Barclays, BNP and HSBC, breakout their Counterparty Credit Risk separately
- As with US banks Op Risk RWAs are the next largest and far higher than Market Risk RWAs
- These range from RBS €28 billion to €97 billion at Deutsche Bank
- (Much lower than the $400 billion at JPM and $500 billion at Bank of America!)
- Market Risk RWAs range from UBS €9 billion to €36 billion at HSBC
- (Again much lower than US banks with $43 billion at Wells Fargo to $138 billion at JPM)
We can also see that UBS, CS and DB have relatively larger Operational Risk relative to their total RWA than their peers, while DB, RBS, Barclays and CS have relatively larger Market Risk (9% to 7% of Total RWA).
Interesting to say the least.
Summary
Basel III disclosures shed light on Capital Ratios, Capital and RWA.
These eight European banks have Capital Ratios well above the regulatory requirements.
And have gradually increased Capital and reduced RWA over the past year.
The largest four US Banks have much higher Capital and RWA than their European peers.
Only HSBC is anywhere near the size of the largest US Banks.
It will be interesting to observe trends for the next few quarters in 2017.