- CME volumes have hit $200Trn in some months this year.
- This is in Interest Rate Derivatives alone.
- The mix is roughly 60/40 Bond Futures versus Eurodollar futures.
- CCPView has now introduced volumes measured on a per contract basis, allowing for cross asset class comparisons.
Interest Rate Derivatives
CME is huge in Interest Rate Derivatives. Just how huge is hard to convey, so I thought it would be worth running over their total volumes across all products for once.
For me, when I think of CME, two things come to mind:
- Eurodollar futures. I assume this is the largest part of their business. Does that still hold?
- I typically assume that volumes are directly correlated with the level of interest rates. When rates are higher, volatility is higher, ergo trading volumes are higher.
In a bizarre year like 2020, when we saw a pandemic resulting in zero interest rates (again), what has this done to volumes at CME?
Overall Volumes
Looking at volumes over the past year (with September 2020 up to the penultimate week), from CCPView:
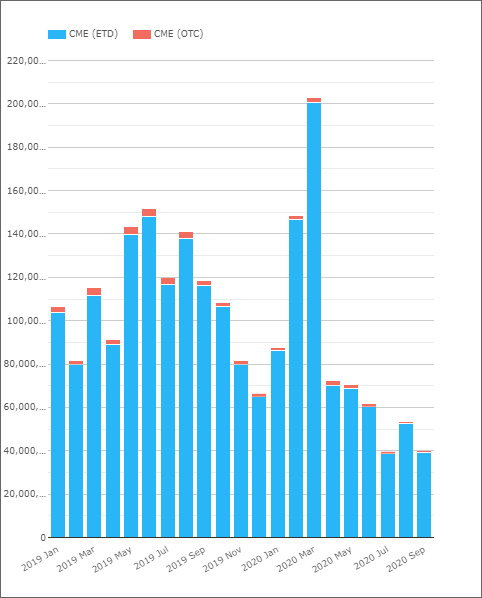
Showing;
- Notional equivalent volumes at CME in millions of USD equivalent for all interest rate derivatives.
- The top of the chart, in March 2020, represents $200 Trillion in monthly volumes!
- The chart shows how ETD volumes dominate the picture. They provide 97%+ of volumes each month. OTC is a tiny slice of the pie.
- For our typical OTC audience, let’s put these volumes in perspective. LCH SwapClear recorded a monthly volume of $71 Trillion in March 2020.
Volumes by Product Type
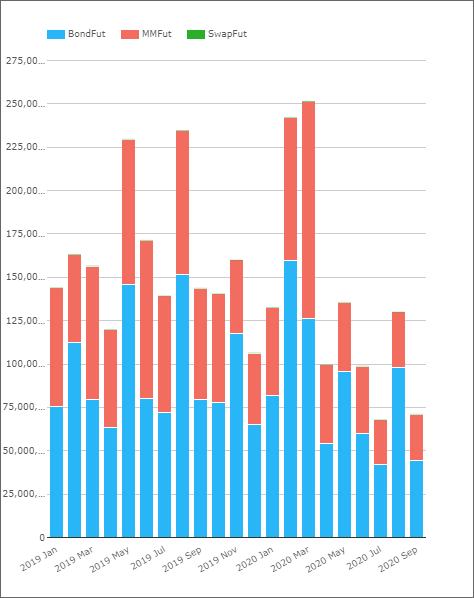
Staying with a notional-equivalent measure, we can split the volumes by product type.

Whilst many of these product types hardly register (as they are related to OTC products), it is notable that Money Market Futures represent much larger notional amounts than Bond Futures.
However, due to their difference in duration (MM futures covering the short-end), it is much better to look at this on a contracts-traded basis.
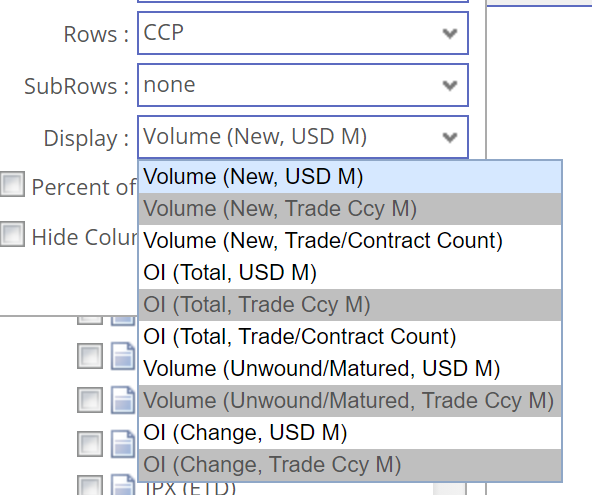
We have recently introduced this measure into CCPView, allowing you to compare turnover (and open interest) using contract counts:
Therefore, a fairer reflection of the business mix between Bond Futures and Money Market futures is shown below:
Showing;
- Bond Futures represent larger Rates market activity than Money Market futures as measured on a per contract basis.
- I found this surprising given that Eurodollar contracts trade all the way out to 5 year maturities, and money market futures cover three indices in USD alone.
- I expected spreads between Fed Funds, SOFR and LIBOR to be significant and mean that money market futures were more traded than bonds.
- This does not appear to be the case.
Proportion of Bond Futures
Restating the above chart into percentage shares:
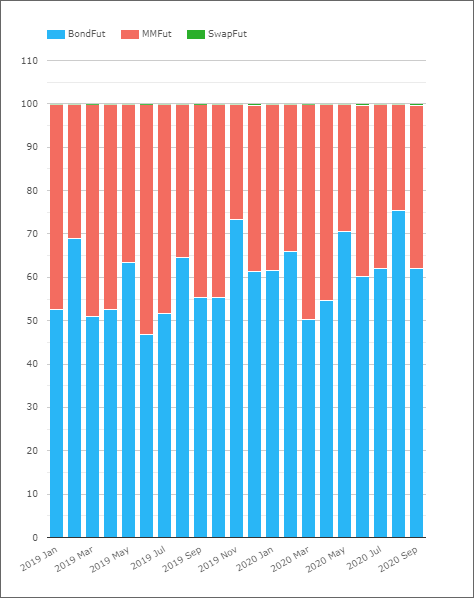
Showing:
- Bond Futures account for 60% of activity on average at CME.
- This increases each quarterly roll month to 69%.
- Outside of these months, money market futures do see the odd month when they account for more than 50% of activity – for example June 2019.
- However, even in March 2020 when rates were being slashed, money market futures only managed a 50% “market share” of CME interest rate activity.
Money Market Volumes per Contract
In terms of money market futures volumes, it is worth noting how dominant the LIBOR-linked exposures still are:
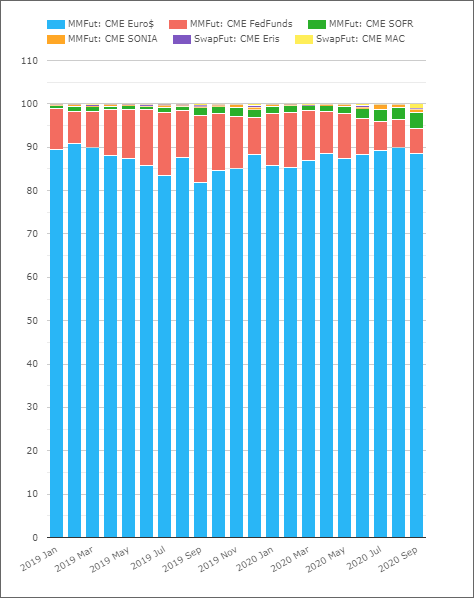
Showing;
- Eurodollar volumes (as measured by contract number) account for 85%+ of monthly activity in money market futures alone.
- Even in March 2020, Fed Funds only accounted for 11.5% of activity, despite central banks slashing rates (and Fed Funds being a “purer” hedge due to little to no credit component).
- Of note, SOFR accounted for nearly 4% of activity in September 2020. Very impressive considering the lack of activity in Fed Funds (~6%).
Outright Level of Rates
I stated at the beginning of this article that I expected overall interest rate derivative volumes at CME to be well correlated with the outright level of rates. Having got this far in the analysis, I am now concerned that assertion is no longer accurate either!
If volumes are more reliant on longer-dated products, whose volumes can remain volatile even if the short-end of the curve is tied to the zero bound, maybe volumes no longer correlate with the level of rates?
Obviously, I need a somewhat longer time period to look at this. To smooth out the quarterly spike in volumes related to roll periods, let’s look at quarterly volumes since 2016:
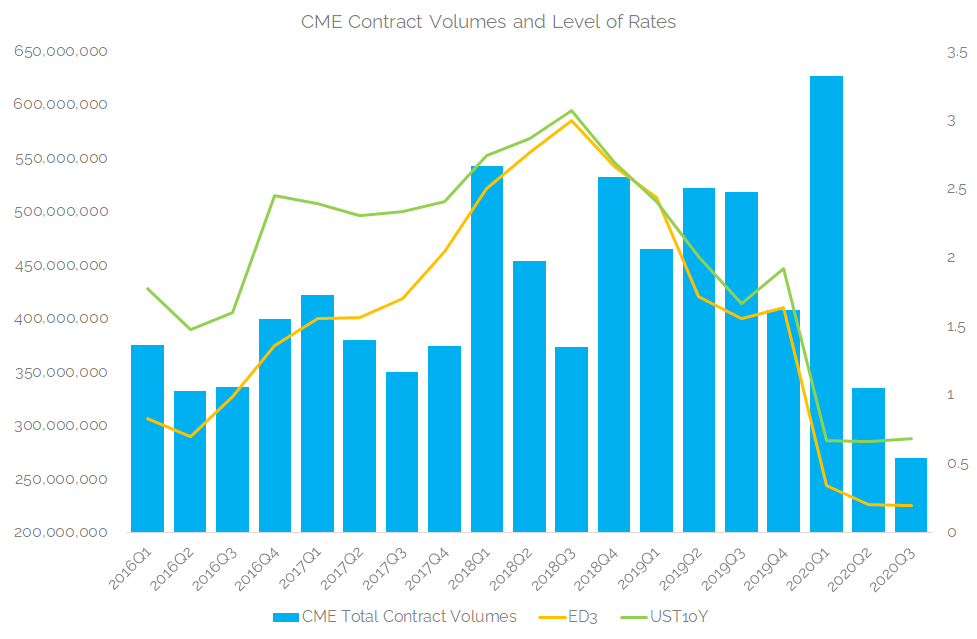
Showing;
- This is a very approximate relationship.
- It shows CME quarterly volumes across all of their Rates ETD contracts in contract numbers traded.
- The level of Rates are represented by the generic 10Y US Treasury yield at the end of each quarter (UST10Y) and the implied yield on the third Eurodollar contract (ED3).
- Roughly speaking, volumes went up throughout 2016, 2017 and into Q1 of 2018 as interest rates increased.
- Volumes were somewhat static between 2018 and 2019 (despite some very low quarters such as Q3 2018).
- Interesting to see that whilst 2019 Q4 was considerably lower than previous quarters, it actually recorded the second highest volumes for a Q4 period in our history.
- Of course, the pandemic effect caused a huge spike in volatility and hence volumes during Q1 2020.
- What is interesting is that volumes during Q2 and Q3 2020 could be considered approximately in line with where the outright level of rates now are. Q3 2020 looks to be the lowest (one week to go as at writing!) whilst Q2 2020 was the second lowest in our time-period.
I am not about to claim victory over this relationship. It is somewhat spurious (I am sure it has almost zero “statistical significance”), but it will be an interesting one to watch over the next few years as interest rates are expected to dwell near zero.
What Else Are We Missing?
Of course, CME is also home to S&Ps (equities) and WTI (oil) to name but two futures contracts.
To put the overall business in perspective, Interest Rate Derivatives accounted for monthly trading volumes of ~130m contracts in August 2020. Total contracts traded at CME across the major Rates, Credit, Equities, FX and Commodities products was nearly 300m contracts!
Looking at the chart below makes the business look pretty healthy, irrespective of what level interest rates are at!
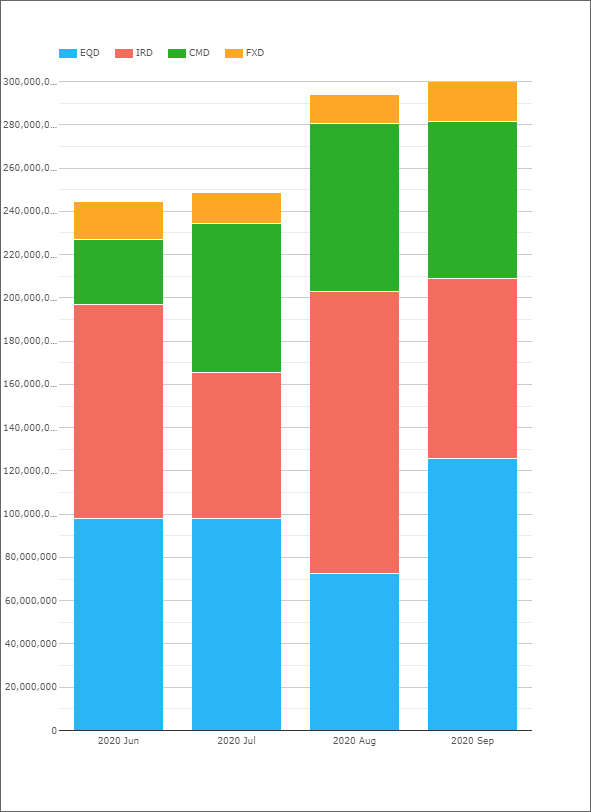
One of our main motivations for adding contract measures into CCPView was to enable this cross-asset class comparison. CME futures are well diversified on this measure.
Although I think FX still has some catching up to do in futures space with the other asset classes!
In Summary
- Interest Rate Derivative volumes can hit $200 Trillion in some months at CME alone.
- 97%+ of these volumes tend to be in exchange traded futures. OTC is a small part of the business.
- CCPView has now introduced volumes measured on a per contract basis. This allows for cross-asset class comparisons.
- The number of contracts traded at CME in Rates has recently fallen, but other asset classes at CME are doing very well, resulting in monthly volumes of ~300m contracts.