- €STR (né ESTER) will be the Risk Free Rate (RFR) for EUR markets.
- Publication begins 2nd October 2019.
- The ECB will provide a calculation of the spread between €STR and EONIA.
- The spread is likely to be around 8.7 basis points.
What You Need to Know about €STR (ESTER)
Some of our readers may be suffering déjà vu. Yes, I have already written a blog “ESTER – What You Need to Know“. However, as of the 12th March 2019, ESTER is now known as €STR:
At least this gives us a chance to catch-up on what has happened with EUR RFRs since I last wrote about them in September 2018 and January 2019. If you are looking for some background reading on ESTER, I suggest revisiting my original blog on ESTER here.
Pre-€STR and €STR
The ECB are not currently publishing €STR. They announced on March 14th that they will start publishing €STR on 2nd October 2019.
However, pre-€STR IS available and can be found on the ECB’s website here. €STR will be published every morning (with a one day delay), pre-€STR is based on final data and so there is quite a delay in the data. When I last checked, pre-€STR only included data to the end of the previous month. It is therefore meant as an indicator of what €STR will look like, and is not a benchmark on which to base transactions.
EONIA vs €STR
At the most recent meeting, the Working Group on Euro Risk-Free Rates recommended to:
Modify the current EONIA methodology to become the €STR plus a spread for a limited period, in accordance with Financial Stability Board (FSB) recommendations and IOSCO Principles for Financial Benchmarks to further anchor EONIA’s methodology in transactions;
This is ground-breaking news! I’m amazed it hasn’t received broader attention. Rather than EONIA ceasing to publish and falling back to another rate (e.g. €STR), EONIA will continue to be published, but at a fixed spread for a period of time. This is….strange? It is at least unexpected, as this did not happen with TOIS and SARON. I haven’t seen any particular reason why, other than to lengthen the transition period. Anyone who knows more reasons for this, please comment below or contact us.
EONIA vs €STR Spread Calibration
The Working Group has also provided a detailed recommendation as to how the spread should be calibrated. So we have a pretty good idea of what it will be. The suggested methodology is:
- Simple average
- Over 12 months to the end of the most recently published pre-€STR data.
- With 15% “trimming” (i.e. we look at only the middle 70% of data).
- The spread will be announced on 2nd October 2019, on the first day of €STR publication.
- EONIA will continue to be published like this until at least the end of 2021.
It has now fallen to EMMI, the current administrator of EONIA, to launch a public consultation on this recommendation from the Working Group. You can find the consultation here. The two main points of consultation are:
- Publication of EONIA will change from T to T+1 on 2nd October 2019. Does this cause any issues?
- Are there any other necessary changes required to IT or valuation systems before 2nd October 2019?
The consultation poses six questions in total, giving all market participants the chance to respond to the Working Group recommendations. Time is short to respond – it closes on April 15th 2019. Fortunately, there is a simple template to fill in here for your responses.
The Spread is 8.67 Basis Points
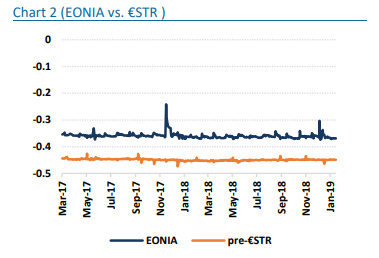
The benefit of having such a precise recommendation out of the Working Group is transparency. We can estimate what the spread will be in October. So let’s take some data and expand upon the EMMI consultation, which provides a chart we’ve looked at before:
Let’s replicate that chart and add in some calculations for the spread, using both a 15% trimmed mean (as requested) plus a 25% trimmed mean (because it is used in the €STR calculation itself):
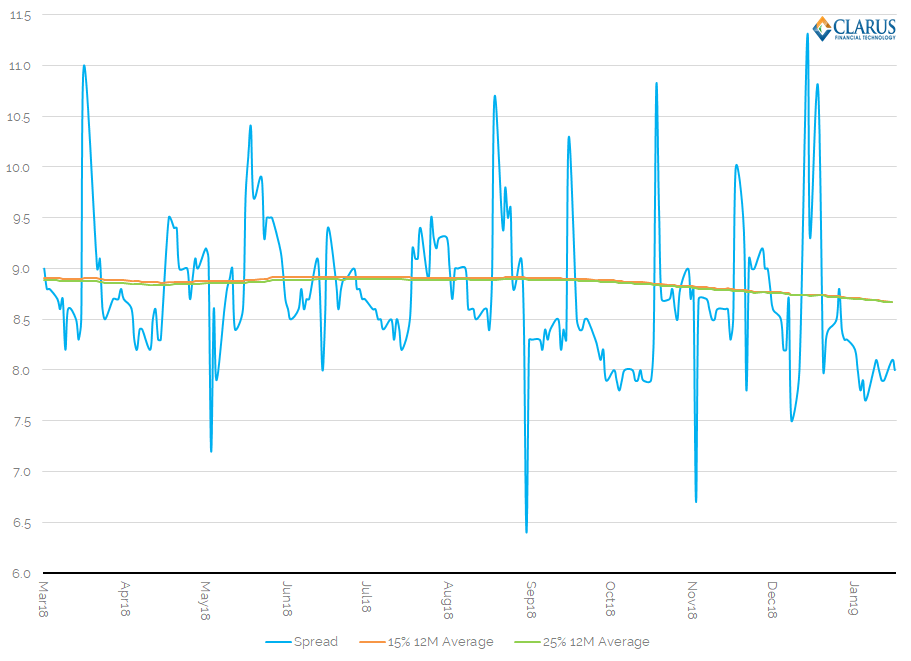
- The value of the EONIA minus €STR spread since March 2018 (blue line). This is expressed in basis points, with EONIA over €STR. It has been positive every single day since publication of pre-€STR began in March 2017.
- The vertical Y-axis is massively zoomed in – because otherwise we cannot see any variability in the spread. The chart is expanded in this way to show that it isn’t volatile, not to claim that it is!
- What is important is that we can see that a rolling 12 month (trimmed) average has been very stable since publication of pre-€STR began.
- Also, please note that the trimming range (15 or 25%) has hardly any effect on the output. The biggest change would be using a simple average with no trimming. That would move the spread higher, by about 0.2bp in the early part of the chart.
We know that this spread will be calibrated on the 2nd October, therefore we want to make sure that any new observations between now (March 26th) and the calibration date (October 2nd) do not overly impact the spread. Given the stability in the chart above, it suggests that any unusual observations in the next six months will most likely represent market conditions that are out-of-the-ordinary compared to the recent past. This therefore argues strongly for using a trimmed mean.
And as for the value of the spread?
- A 12 month 15%-trimmed average on the 29th January 2019 was at 8.67 basis points (the most recent observation of pre-€STR available).
- It has been as high as 8.92 basis points and currently sits at the lowest that we have observed.
In Summary
- ESTER is now known as €STR and is the chosen Risk Free Rate (RFR) for EUR markets.
- €STR will first be published on 2nd October 2019. Before then, we have pre-€STR to analyse and get familiar with the new rate.
- EONIA will publish alongside €STR from October. It will change to be a fixed spread to €STR.
- This fixed spread will be calibrated over a 12 month look-back horizon, using a trimmed mean.
- Using the most recent pre-€STR data available, EONIA will become a fixed spread of 8.67 basis points over €STR.