- We monitor the three-way battle for market share in €STR STIRs between CME, Eurex and ICE.
- ICE continues to dominate the EURIBOR STIR market, with Eurex witnessing a significant increase in volumes since November.
- CME hold 65% of the Open Interest in €STR futures as at the end of January 2024.
- The Clarus €STR Liquidity Dashboard is a great way to stay on top of the weekly trends.
We turn our data lens back to Europe for this blog to look at how the market shares of CME, Eurex and ICE are evolving across EUR futures.
Last time out, I noted that Eurex had kick-started their EURIBOR volumes. Let’s look at the data since then.
Market Share in EURIBOR Futures
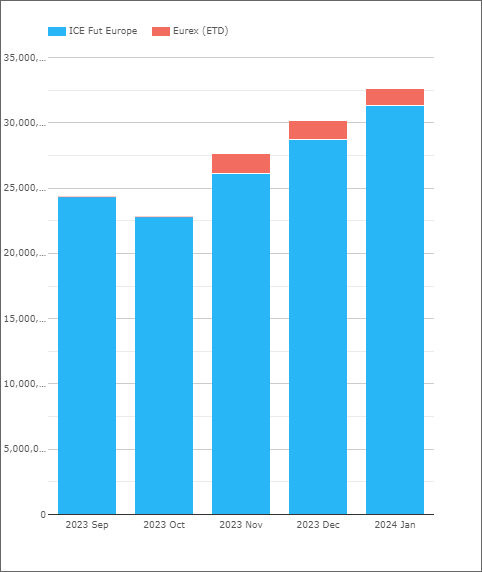
CCPView reveals a straight competition between Eurex and ICE for the largest of the EUR STIR contracts:

Showing;
- Eurex began seeing meaningful volumes in EURIBOR contracts in November 2023.
- They now see €1.3-1.5Trn notional equivalent trading each month (i.e. 1.3-1.5 million futures contracts per month).
- I asked last time out whether this is true “new” volume or market-makers trading the contract as a spread to ICE? I think the data answers that question pretty well.
- ICE volumes have gone up every month since Eurex volumes began.
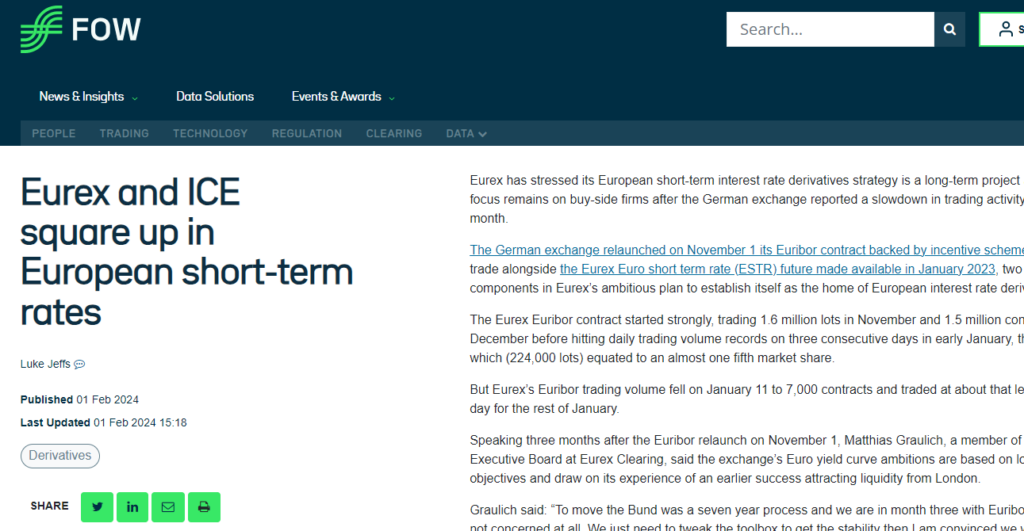
- Presumably, much of the 1.3million Eurex volume is trading as a spread to ICE? This article at FoW suggests that most volume is from Market Makers at the moment, with a focus on expanding “taker flow”:

The daily pattern of volumes in these EURIBOR contracts is certainly intriguing:

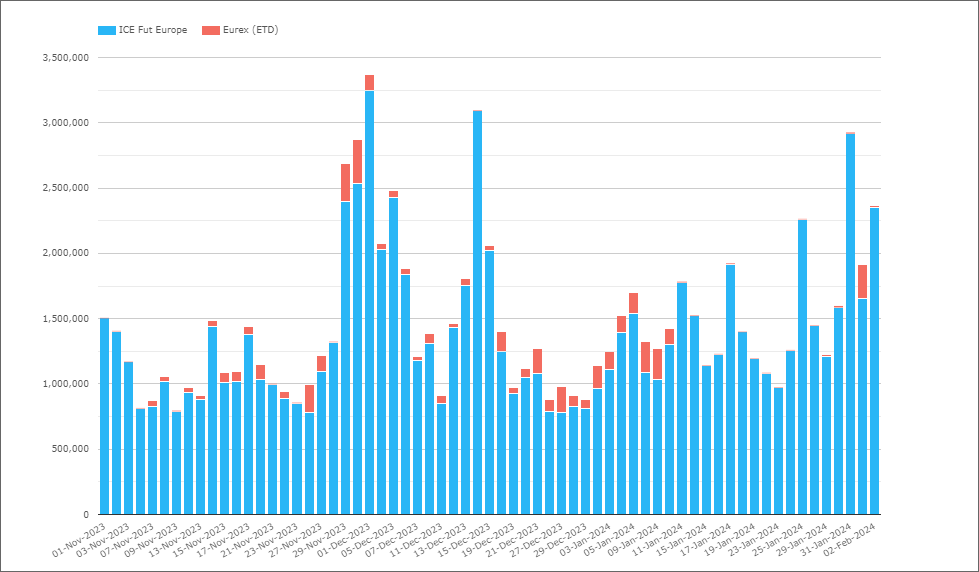
- Eurex volumes started to accelerate in mid-November, before breaking the 100,000 contract barrier on the 20th November. For reference, ICE saw over 1 million contracts trade on about 60% of trading days in November.
- Volumes at Eurex in December initially reduced, before seeing elevated volumes in a concentrated period from 18th-27th December.
- Volumes at Eurex were then extremely elevated in the first 7 trading sessions of January, before reducing to less than 10,000 contracts a day for the rest of the month.
- Our eyes probably do a better job of identifying this pattern than the statistics, but both November and January saw around 70% of Eurex volume conducted on the 5 largest days in the month – i.e. activity has been very concentrated around specific trading days.
Interestingly, whilst the aggregated monthly stats make it look like more volume at Eurex leads to more volume at ICE, that pattern is not obvious in the daily volumes.
Market Share in €STR Futures
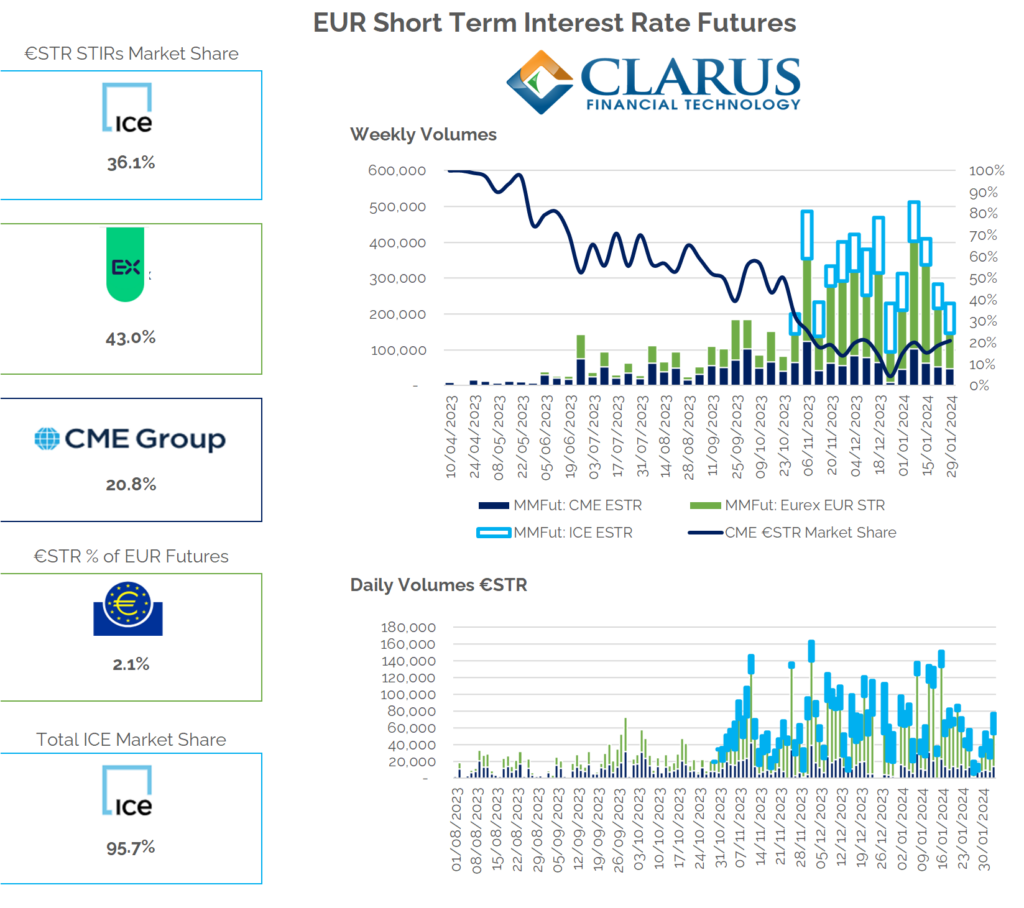
Returning to €STR futures, the market share has actually been more stable than in EURIBOR futures – which is a bit crazy to be typing considering €STR futures are not yet a mature market. The Clarus dashboard for €STR liquidity provides a nice weekly summary:

Showing;
- On a weekly basis since December 2023;
- CME market share has averaged 17%
- ICE market share has averaged 31%
- Eurex market share has averaged 52%
- This is very similar to when we last looked at €STR futures in November.
No clear winner has yet emerged for €STR futures, and they remain relatively small compared to the EURIBOR contract at ICE. It is worth noting that €STR futures make up between 30-40% of total EUR STIR volumes at Eurex, but only 2-3% of total EUR STIR volumes.
Open Interest
Finally, it would be remiss not to check in on Open Interest for each of the contracts:

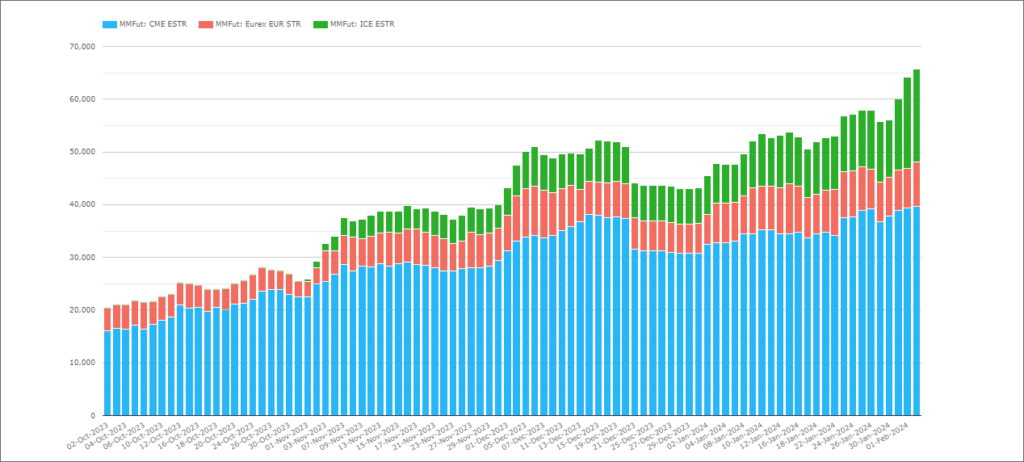
Showing;
- Open Interest has grown at each of the exchanges.
- CME has the largest share of Open Interest, accounting for about 65% at the end of January 2024.
- ICE has seen Open Interest build up quickly, now making up over 22% of the Open Interest.
- Eurex Open Interest has been relatively more stable, at 7-9,000 contracts.
For Euribor, it is a different story. Open Interest at ICE is over 4,000,000 contracts, and the recent activity at Eurex has increased Open Interest to only around 10,000 contracts. It is amazing how much volume needs to trade to even begin to move the needle on Open Interest.
In Summary
- CCPView highlights the market share changes in EURIBOR and €STR futures.
- €STR market share has been relatively stable since December.
- Eurex has the largest volumes in €STR futures, whilst CME has the largest Open Interest.
- ICE are seeing increasing activity in €STR futures, with their Open Interest consistently growing.
- EURIBOR futures are now seeing a market share battle between Eurex and ICE.
- Tracking the data is the best way to monitor these evolving market dynamics.