We have Q2 data for Clearing Brokers, showing any changes in the US clearing landscape.
Let’s dig into the data, starting with our count of FCMs by various metrics:
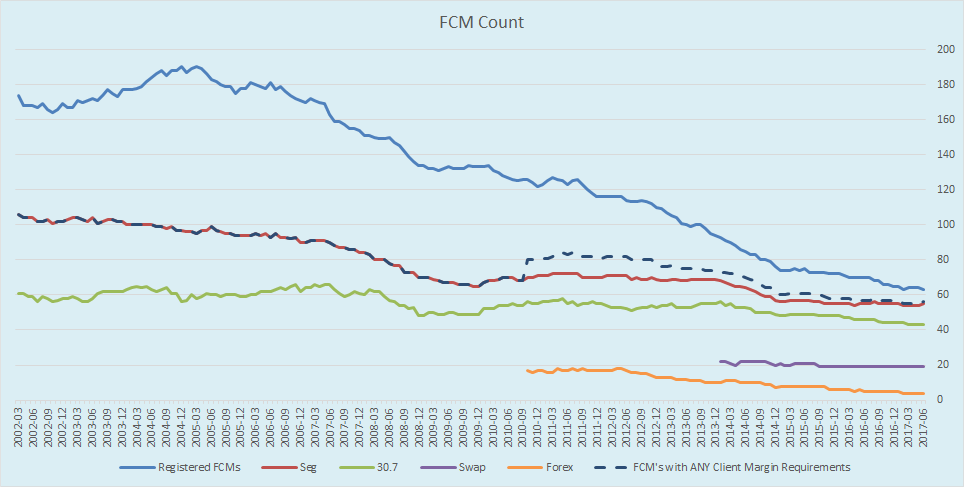
Showing 63 firms registered (down 1 from Q1 2017), and 56 firms with any Client Requirements.
Other headline metric is total client required margins, which trended down overall:
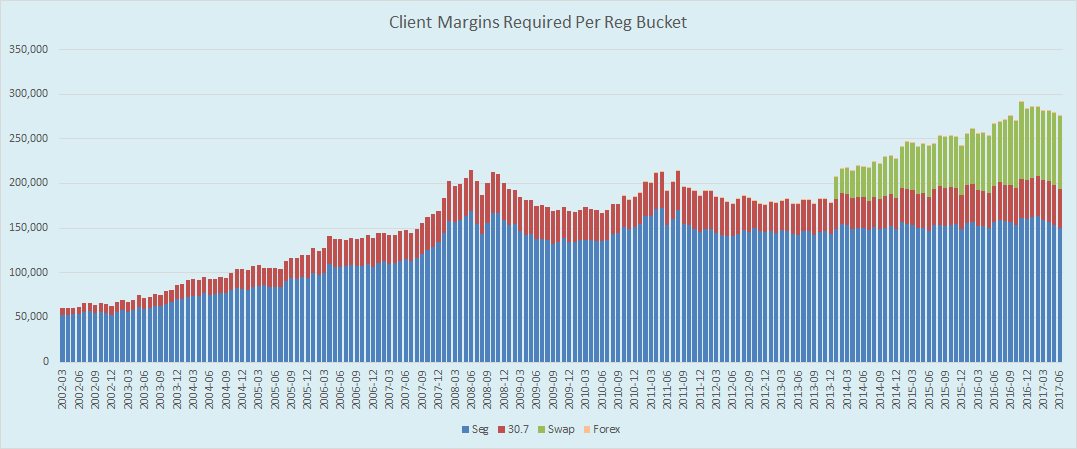
Breaking this out however:
- Total client margins dropped $7bn from 282 to 275 across all buckets
- Seg & 30.7 Futures and Options was responsible for -$10bn of that
- Swaps was up $3bn
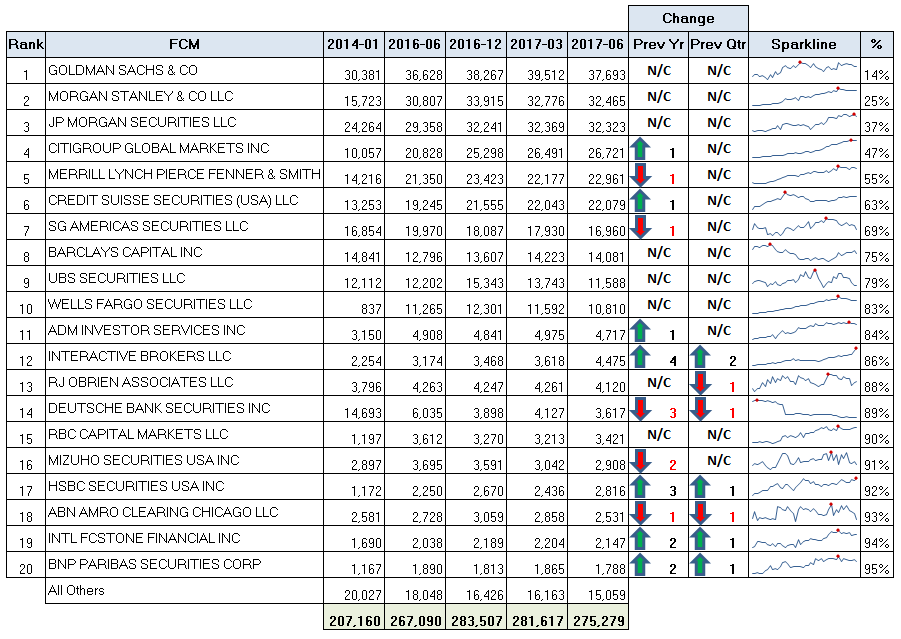
Swap League Table
New swap league table: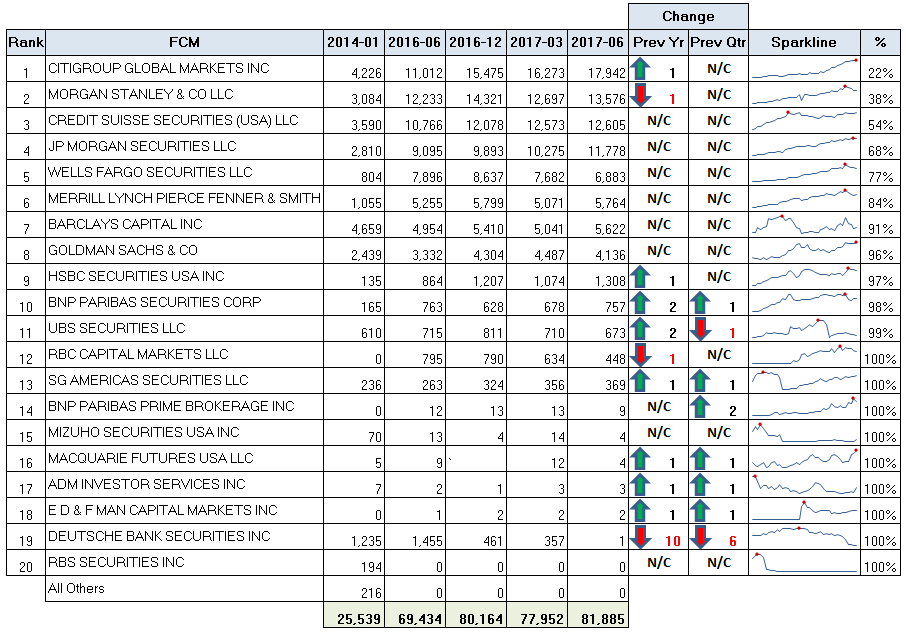
Shows us a few things:
- Citigroup continues on a tear. Now with 22% of client swaps business
- Deutsche now completely wound down in US Swaps
- Many of the smaller guys seem to be mean-reverting (off their highs)
- HSBC showing decent growth over the past year +51%
- In the most optimistic perspective, would seem we’re down to 13 legitimate swaps brokers
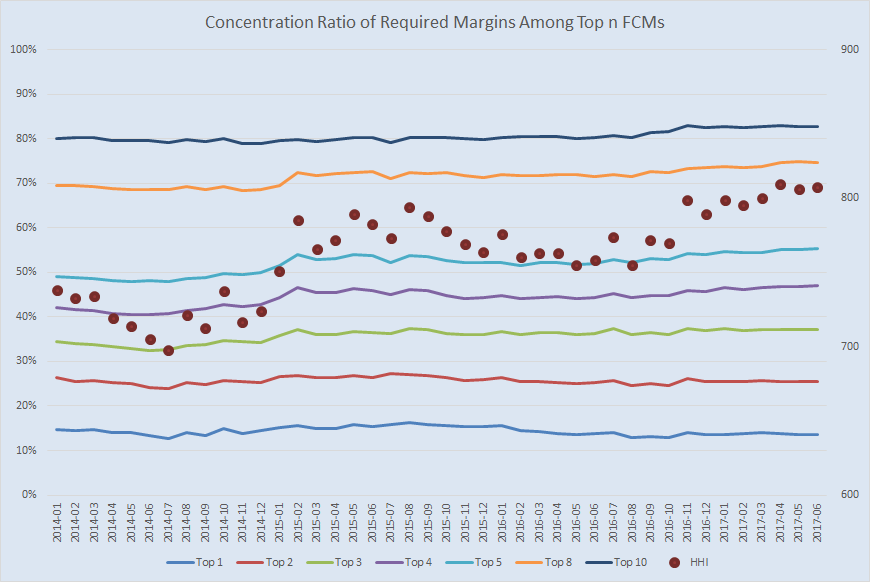
We also update our concentration analysis for swaps, which is now at all time highs as measured by the HHI index. HHI touched 1400+ in April 2017:
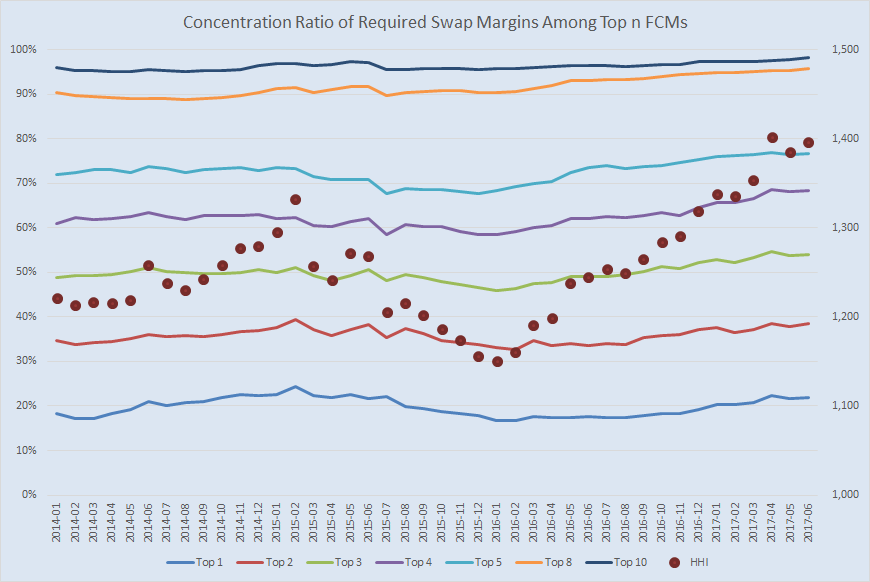
Make of that what you will, but a clear trendline of increased concentration since Jan 2016.
Seg Table
Now the SEG Rankings:
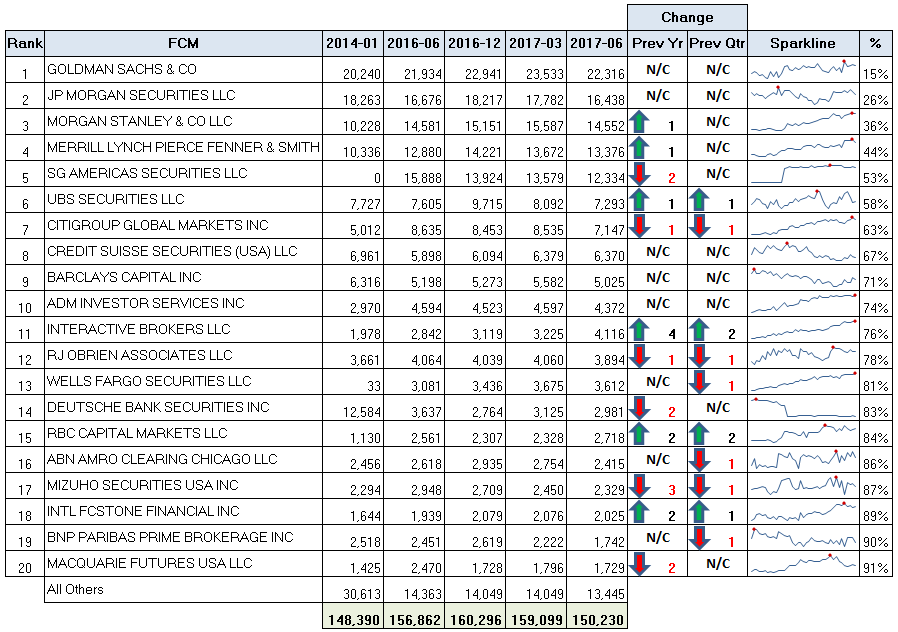
Not a whole lot of change here:
- I might point out that Deutsche is down a couple spots in Seg over the past year. Probably sensible, if you consider there were clients that probably wanted to have all of their business at one FCM.
- The sparklines tell an interesting story. Firms like Morgan Stanley, Merrill, Citi, and Wells Fargo with steady growth.
And the SEG HHI:
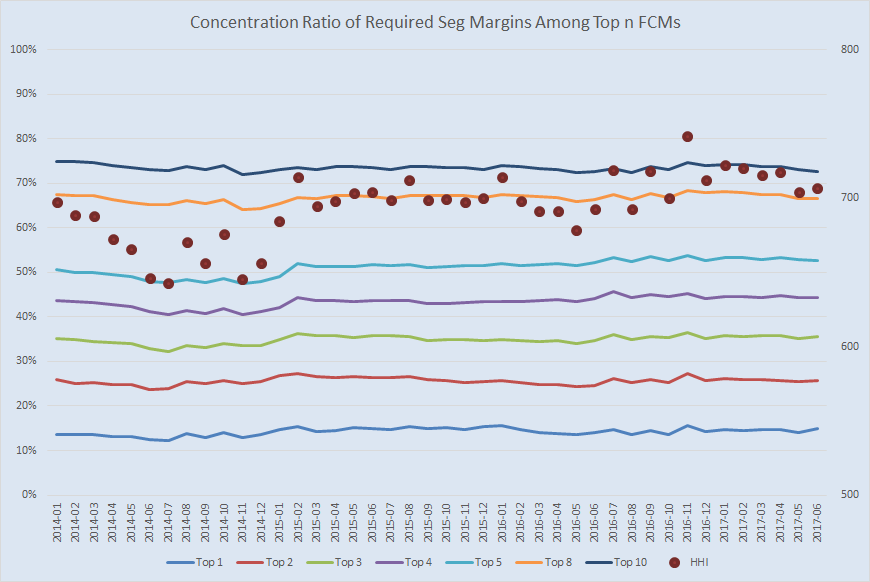
Slightly better story than in swaps!
Overall Rankings
Putting together swaps and F&O, we can see a combined league table:

And finally HHI for the combined totals:
Summary
Much of the same story. Swaps clearing seemingly getting more concentrated on the surface. Whether or not you subscribe to the theory that is harmful to the market is another thing. It’s not like I see clearing brokers buying new yachts.
Citigroup gained some business and Deutsche lost theirs (in swaps).
Lastly, if you are interested in keeping up with this data more frequently, the FIA have released a nice browser of the CFTC FCM data on their website here. It’s pretty well done – so much so that I may have to retire from my quarterly FCM tracker blog!