In my recent article, Tick data for Swaps: What is now available, I noted that it would be interesting to look at price tick data and to do so for Interest Rate Swaps. While in my earlier article, Bloomberg SDR is now live, I showed an intra-day chart of prices for 5Y IRS comparing DTCC and BSDR.
In this article, I will look at whether we can see any differences in USD Interest Rate Swap Prices in the D2D and D2C markets.
We will do so by comparing the data we see in BSDR (which is only from BSEF and so D2C) with the data we see in DTCC (which is primarily D2D, except for TW).
First Our Charts
In SDRView Professional, we can select IRS USD Libor 3M vs SA, that are On SEF and Cleared for the business day 30 May 2014.
First BBG.
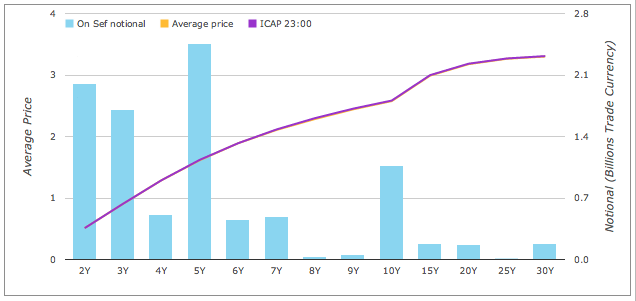
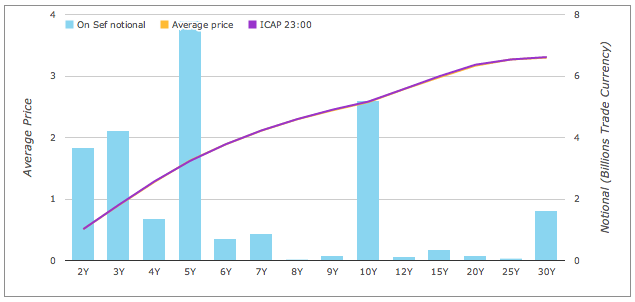
Then DTCC.
Data tables
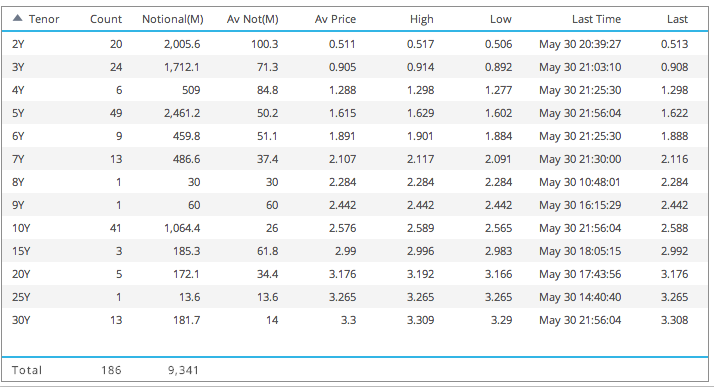
The same data in tables, allows us to make more detailed observations.
First BBG.
Then DTCC.
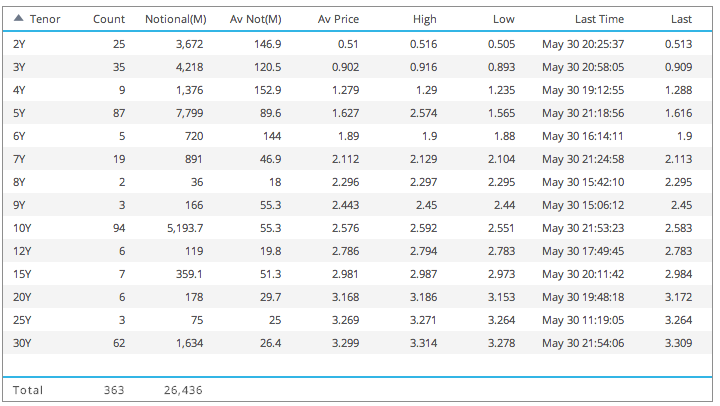
From which we can observe:
- BBG shows 186 trades or $9.4 billion
- DTCC shows 363 trades or $26.4 billion
- The tenors 2Y, 3Y, 5Y, 7Y, 10Y, 30Y each have more than 10 trades on both BBG and DTCC
- 12Y tenor is the only tenor that is not on both, with just 6 trades on DTCC
- The average notionals are lower on BBG than DTCC
- Which is consistent with our expectation that Clients trade in smaller size than Dealers
- For example: 10Y is $26m on BBG and $55m on DTCC
Lets create a table comparing the Average Prices for each tenor.
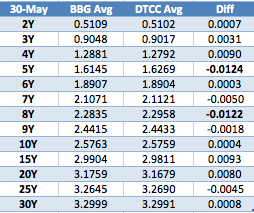
Which shows:
- For many tenors the difference is less than 1 basis point
- For example for 10Y it is 0.04 bps
- However the 5Y and 8Y have differences greater than 1 bps
- Looking at the High and Low data (see previous tables)
- For 5Y there is a high outlier of 2.574, clearly bad data, excluding this make the difference 0.1 bps
- For 8Y there is 1 trade at on BBG at 10:48 Lon, while there are 2 on DTCC with the last at 15:42, so the time gap explains the difference
Comparing with ICAP Prices
As SDRView Professional also shows indicative mid-prices from ICAP’s global brokerage operation, we can compare the last trade prices on BBG with the last price from ICAP at 23:00 Lon, 6pm NY.
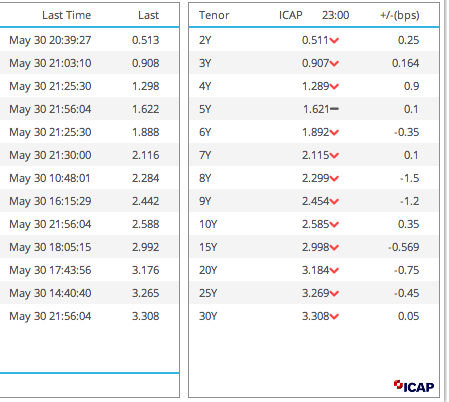
From which we see that:
- For most tenors the difference is less than 1 bps
- For example for 10Y it is 0.35 basis points and for 5Y it is 0.1 basis point
- Only 8Y and 9Y have differences greater than 1 bps
- For 8Y this can be explained by the time difference between 10:48 and 23:00
- And similarly for 9Y
Given that bid-offer on Swap prices can be 1/4 basis points and prices move over the day, looking at daily averages, high and lows is not a complete test.
We should also look at the intra-day price history.
Drill-down on 10Y Swap Prices
First the chart of intra-day prices of 10Y Swaps for BBG and then DTCC.
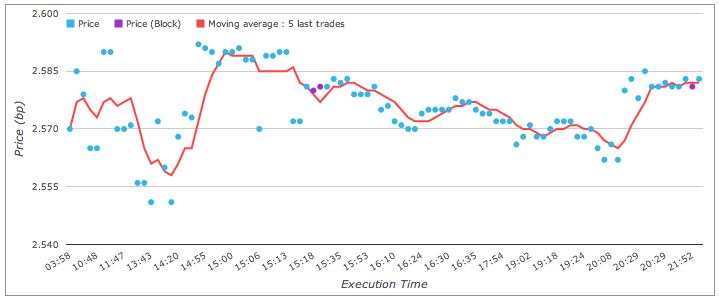
Allowing for the difference in the time axis, the shape looks comparable, with a richer curve for DTCC (given the more trade points). Generally we would say that that two price series were very close through the trading day.
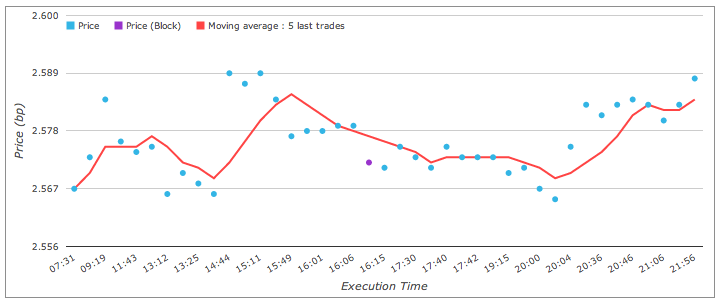
Lets try a scatter plot to compare the two series, starting at 13:00 LON, 08:00 NYC.
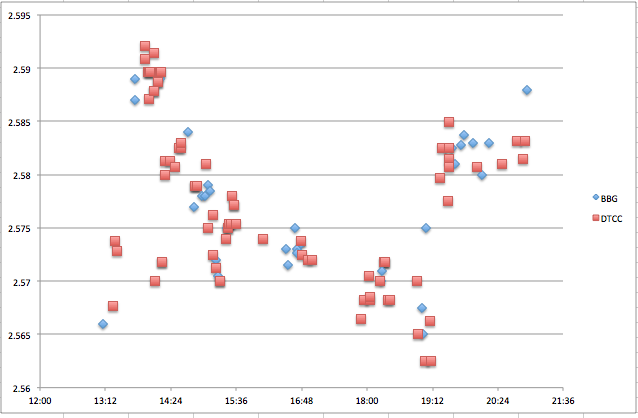
Which shows that:
- Generally blue BBG prices have red DTCC ones clustered very close to them.
- (Look vertically up from the time axis).
- For example at 16:48, lots of blue and red dots clustered within 0.25 basis points of each other
- However there are exceptions
- For example at 19:12 there is a blue dot by itself, but then at this time prices moved up from below 2.57 to above 2.58
- And also at start of trading and end of day, there are blue dots by themselves
- (Not surprising as trading is thinner at this time)
Simple Statistics for 10Y
Lets move form the visual tests to turn to some simple statistics, for the 10Y Swap prices after 8am NYC.
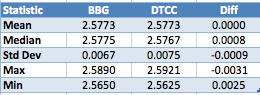
Which shows that:
- The mean of BBG (D2C) and DTCC (D2D) is exact to 4 decimal basis (hundredth of a basis point)
- Standard deviations of the two series differ by 0.09 basis points
- Max differs by 0.31 bps and Min by 0.25 bps
Generally we would say that the correspondence is very close.
And that differences are within the bid-offer and allowing for timing differences.
We could produce the same statistics for other tenor points.
But I will leave that to those of you that are interested. Just export the drill-down data from SDRView into Excel.
Summary
As BSEF only reports to BSDR, we can see D2C swap prices in BSDR.
As the IDBs dominate the On SEF volume, we can see D2D swap prices in DTCC.
Comparing the two for USD Interest Rate Swaps is interesting.
For major tenors daily statistics such as average, high and low are very close.
Almost to the point that the two series are distinguishable.
Individual ticks at the same time for D2D & D2C are usually well within 0.25 bps.
For 10Y IRS we see the exact same daily average price and very similar standard deviations.
Only prior to start of trading, or at end of day or when the price is jumping to a new level, do we see any real difference.
Comparing with ICAP’s brokerage prices also shows good comparison (allowing for time of day adjustments).
The answer to our question, “D2C and D2D, is there a difference?”
Well if there is one, it is too small for us to see with the data and analysis above.