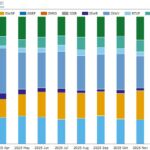
Q2 2026 shares of D2D platform core rates swaps
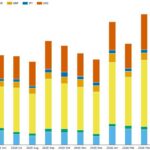
This blog reviews Q2 2026 D2D platform market shares of major currency rates swaps risk-trading, continuing the quarterly series from Q1 2026 shares of D2D platform core rates swaps. Key takeaways Q2 2026 saw the following D2D platform market share leaders and shifts in each major currency: All the charts and statistics in this blog […]
US-reported rates swaps compression: up 43% YoY
This blog looks at Q1 2026 volumes of US-reported compression of cleared “core” rate swaps (meaning OIS, fixed float IRS, and basis swaps). Key takeaways Scope and background This blog continues our coverage of US-reported rates swap compression volumes after 2025 SDR-reported IR compression and before that H1 2025 SDR-reported IR compression and 2024 US […]
Derivatives innovation: FX Initial Margin Optimization, has Capitolis grabbed share?
Capitolis has launched multilateral FX initial margin optimization (IMO) runs, taking on the long-standing FX IMO services of LSEG and OSTTRA. Word of the launch came in while I was working on this update on Clarus volumes related to FX IMO. The successful entrance of new vendors always adds interesting new angles to this type […]
US firms powered March 2026 iTraxx swaps volume growth
This blog covers credit derivatives (CRD) trading volumes in March 2026, both at CCPs and as reported in the US. We sourced the charts and statistics from CCPView, SDRView and SBSDRView. Key takeaways Notes on CRD volumes We focus on the months of March and September because the standardized CRD maturity dates on the two months’ […]
How concentrated are swap clearing brokers?
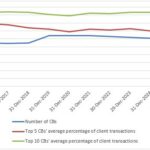
This blog gives an update on swap clearing broker concentration risk and asks whether the recent increase in the number of swap FCMs heralds an improvement. Key takeaways At the end of Q1 2025: Introduction Whilst client-cleared financial futures have been around a lot longer, client-cleared swaps started at LCH SwapClear in December 2009, about […]
Q1 2026 USD swaption volumes – up 14 percent YoY
This post continues our quarterly strikes analysis of USD swaptions, which are typically 50 percent or more of swaptions volumes in all currencies. We use SDRView data, which captures OTC derivatives trades reported by US financial firms to US SDRs. Key takeaways Swap market context If you are new to swaptions, some basics are outlined at the […]
Volumes and most active names in credit derivatives – March 2026
Today we look at issuer names most actively traded based on single-name credit default swap (CDS) trades reported to US SEC Securities Based Swap Data Repositories (SBSDRs) in March 2026. This follows on from the prior similar blog covering September 2025, as we follow the natural CDS volume peaks in March and September. We rank SBSDR reported names by […]
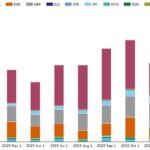
Q1 2026 cross-currency swap volumes and market shares
This blog reviews Q1 2026 cross-currency swap volumes and platform market shares, following on from our recent blog on a similar theme for the whole of 2025. We focus on US-reported cross-currency basis swaps in USD versus the five other major currencies. We use SDRView to aggregate volumes, DV01, and trade count by month and quarter. Key takeaways […]
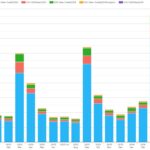
Q1 2026 shares of D2D platform core rates swaps
This blog covers D2D platform shares of core rates swaps in G6 currencies in Q1 2026. Key takeaways Read on for further analysis and explanation. All the charts and statistics in this blog were sourced from SDRView. Background We focus on the core rates swap products: cleared OIS and fixed-float IRS, of which at least […]
Swaption volumes by strike – Q4 2025
This post continues our quarterly strikes analysis of USD swaptions, which are typically 50 percent or more of swaptions volumes in all currencies. If you are new to swaptions, some basics are outlined at the start of the earlier Q1 blog. You may also wish to keep open on the side our recent blog on […]