Continuing with our monthly review series, let’s take a look at Interest Rate Swap volumes in January 2016.
First the highlights:
- On SEF USD IRS in January 2016 volume was higher than December 2015
- For price forming trades, DV01 was 10% higher
- Butterfly volume was much lower than prior months
- USD SEF Compression volumes were back down to November levels
- USD Swap Rates fell 37 bps across the term structure
- SEF Market Share shows gains for ICAP and Tullet
- Lower Compression volumes show in lower volumes for Tradeweb and TrueEx
- CME–LCH Switch trade volume was $52b, similar to Dec
- Global Cleared Volumes in G4 Ccys was lower month on month
- LCH SwapClear continues to increase market share with 89% of G4 Swap volume in the month
Onto the charts, data and details.
USD IRS ON SEF
Using SDRView lets start by looking at gross-notional volume of On SEF USD IRS Fixed vs Float and only trades that are price forming, so Outrights, SpreadOvers, Curve and Butterflys.

Showing that:
- January gross notional is >$1.2 trillion
- (recall capped trade rules mean this is understated as the full size of block trades is not disclosed)
- Just above December (by 3%) and November and remarkably consistent volume each month
- Compared to January 2015, gross notional is down 6%
And splitting by package type and showing DV01 (adjusted for curves and flys).
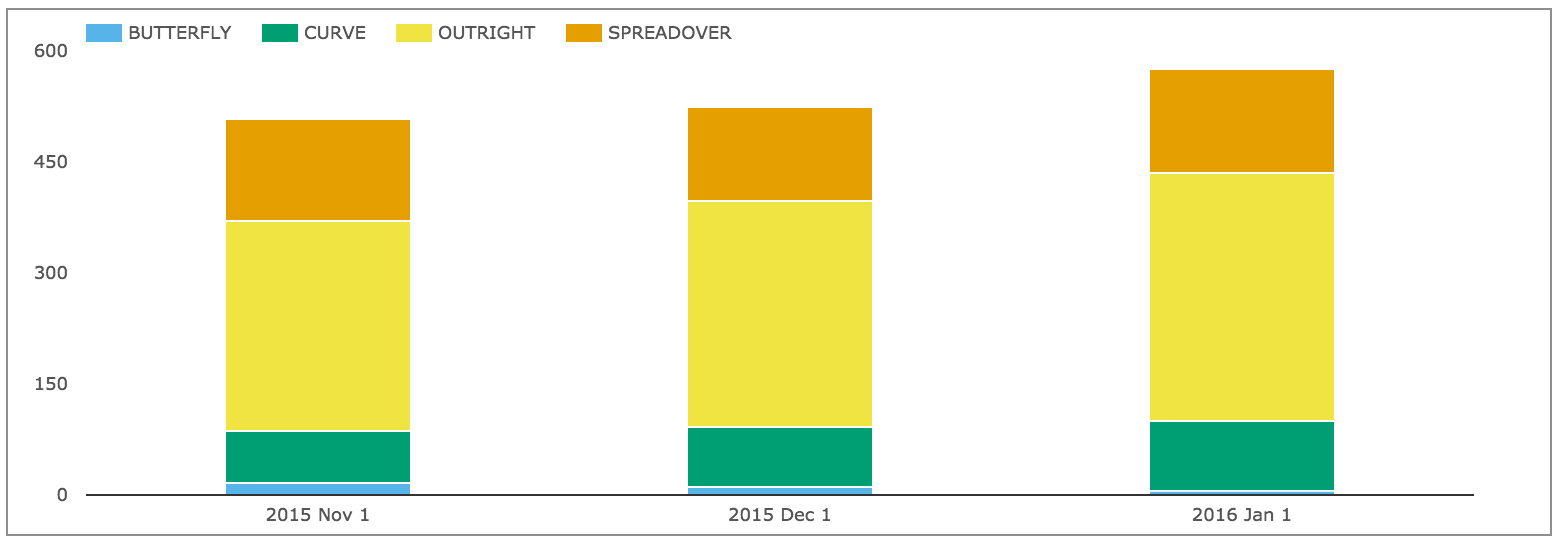
Showing that:
- In DV01 terms January was 10% higher than December
- Overall >$580 million of DV01 was traded in the month
- (recall capped trade rules mean this is understated)
- Only Butterfly DV01 was lower in January
- Curve, Outright and Spreadover were all higher
And gross notional of non-price forming trades; Compression and Rolls.
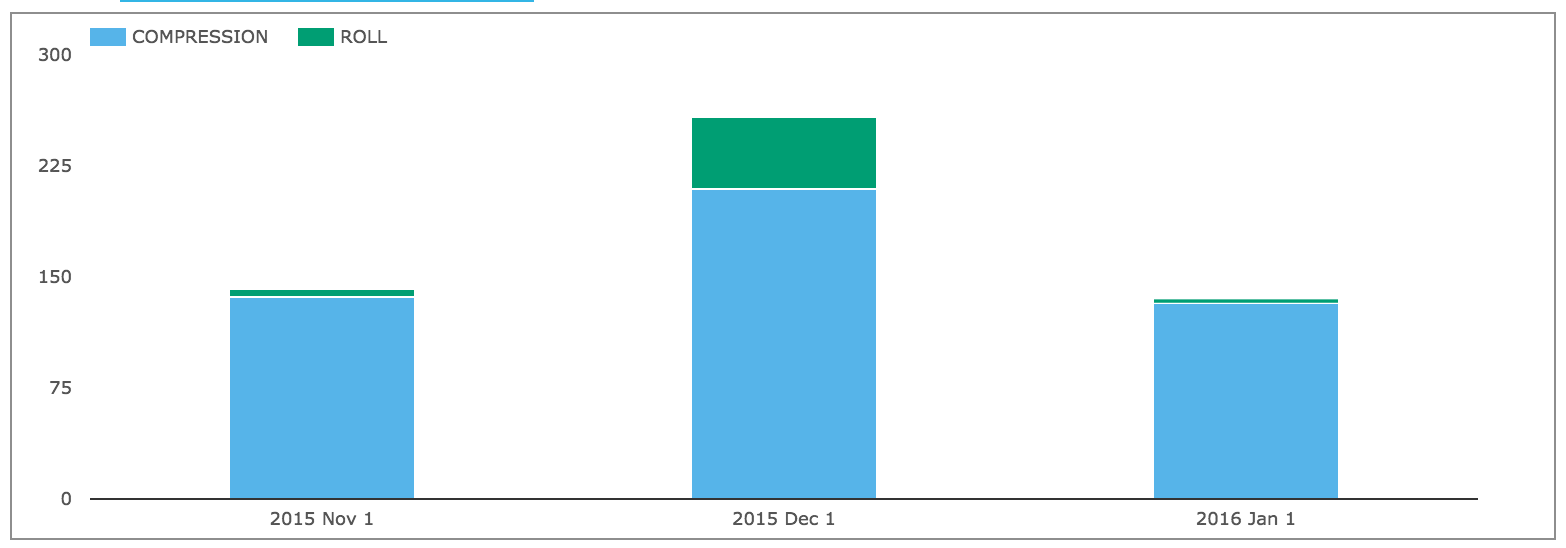
Showing that:
- Compression activity is back down to November levels
- At >$132b in Jan vs >$208b in Dec and >$136b in Nov
USD IRS OFF SEF
Comparing On SEF vs Off SEF for price forming trades.
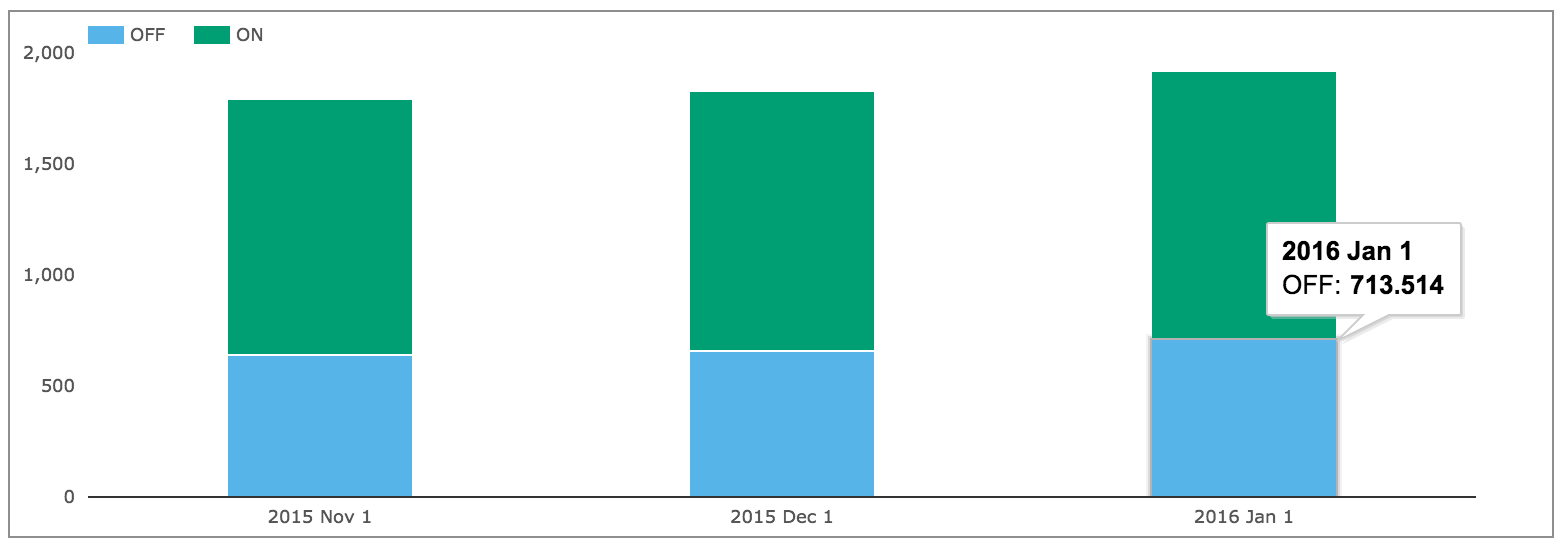
Shows that Off SEF is >$714b gross notional in January, so 37% of the total vs 63% for On SEF.
USD IRS Prices
Lets now take a look at what happened to USD Swap prices in the month.
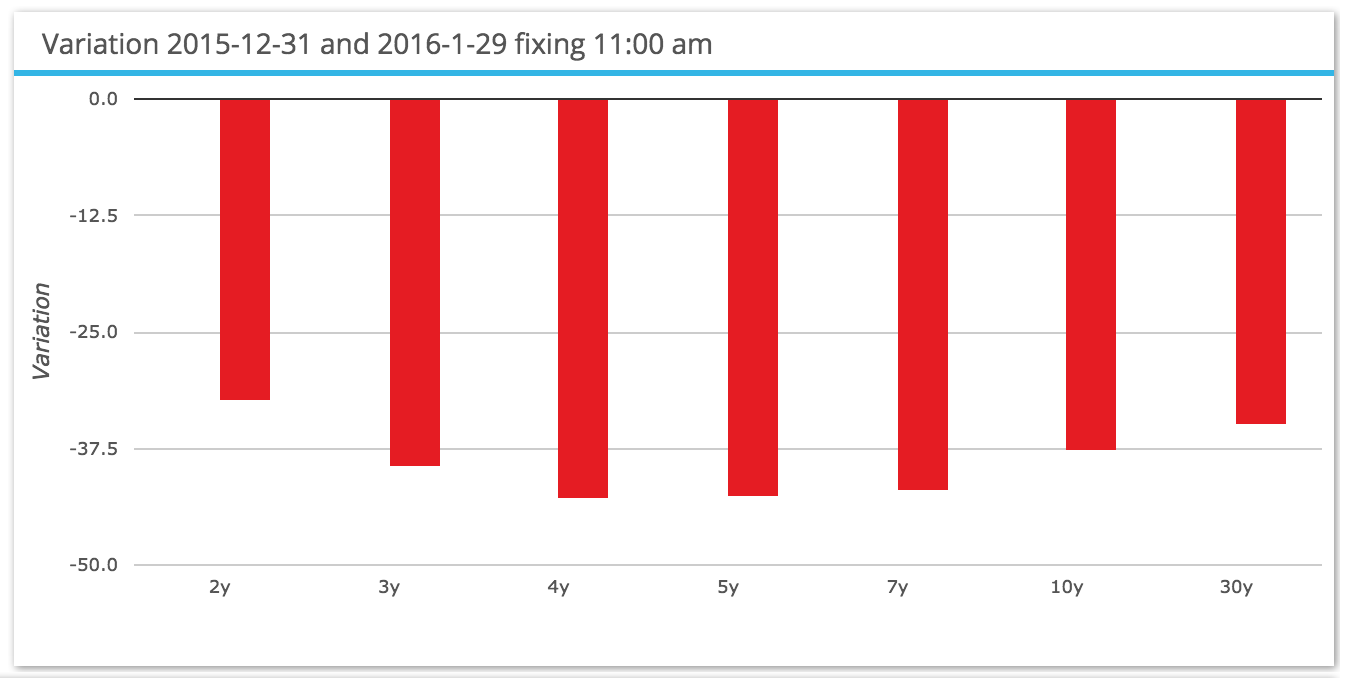
Interesting indeed, showing that:
- Rates fell around 37bps across the term structure
- A large parallel shift down
- More than reversing the rise of 15bps we saw in December
- Reflective of the January drops in equity markets and consistent with the rise in bond prices
EUR, GBP, JPY Swaps
Lets also take a look at On SEF volumes of IRS in the other three major currencies.
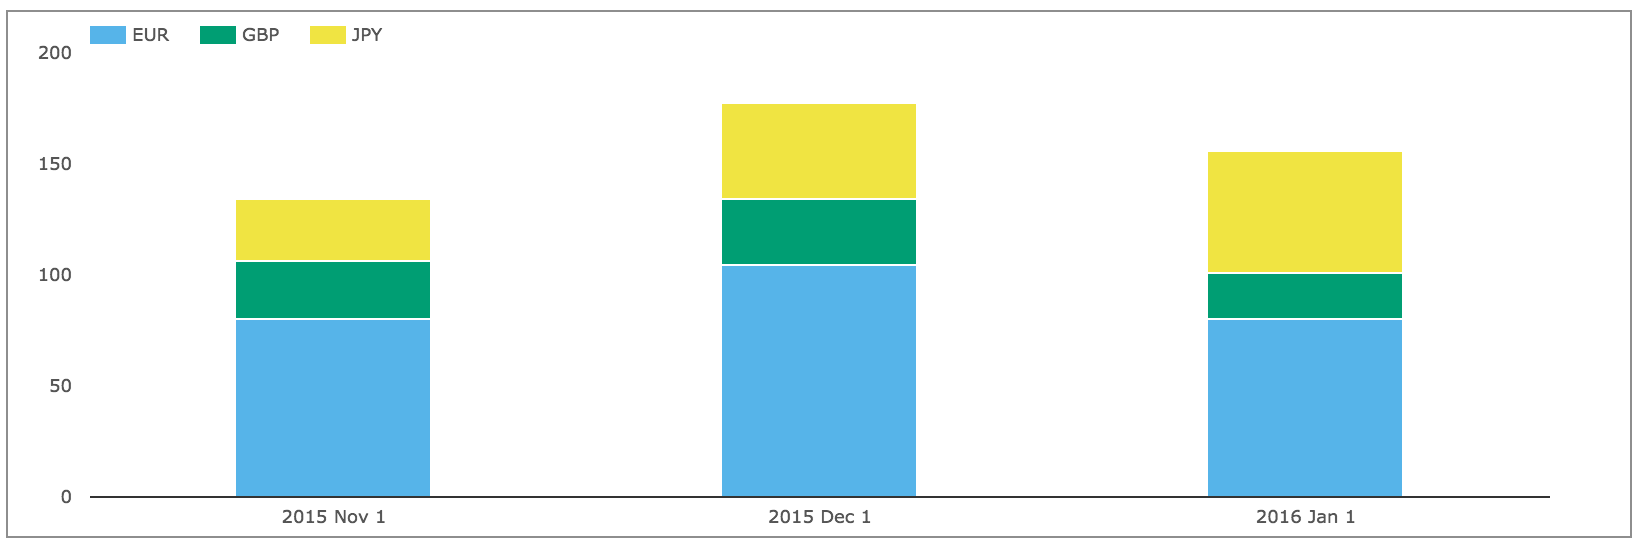
Showing that for price-forming trades JPY volumes were higher than prior months, while the overall gross notional in these three currencies of >$156b in January is just 13% of the USD volume.
And then looking at SEF Compression activity.
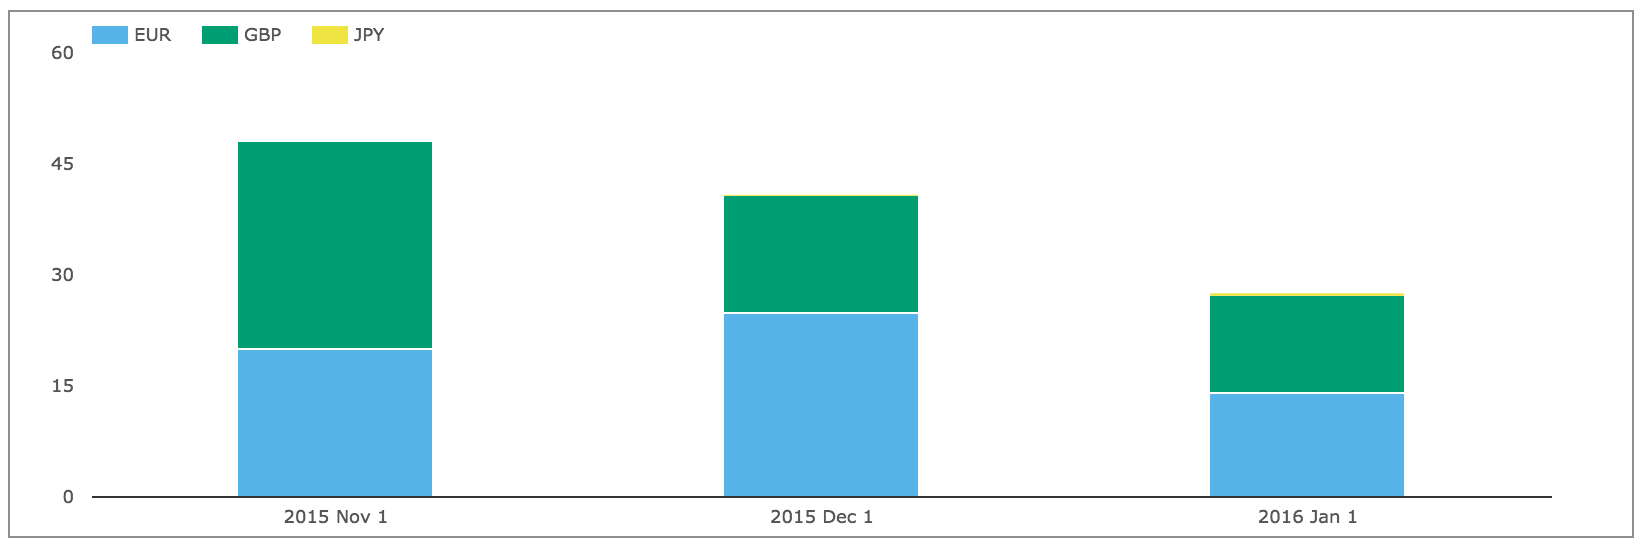
Showing much lower volumes in the month.
Thats it for SDR data.
SEF Market Share
Lets now turn to SEFView and SEF Market Share in IRS including Vanilla, Basis and OIS Swaps.
We will start by looking at DV01 (in USD millions) by month for USD, EUR, GBP and by each SEF. In a departure from our usual standard, we will include SEF Compression trades and use a chart to compare the relative share in January with the prior two months.
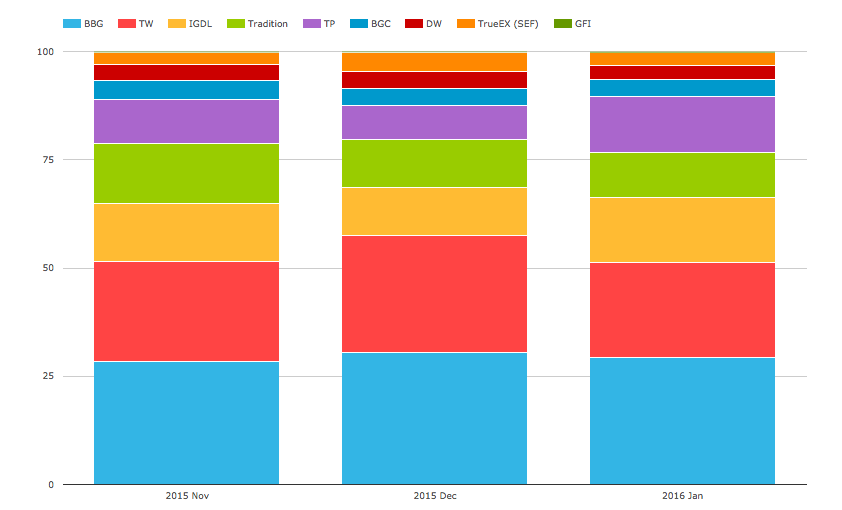
Showing that:
- Bloomberg has the largest share in each month
- Tradeweb is next, but lower in January than December
- Due to the much lower volume of SEF Compression in December
- ICAP-IGDL has a higher share than Nov and Dec
- Tradition share is similar in Jan and Dec with both lower than Nov
- Tullet share is much higher in Jan
- (More on the reason for this below)
- BGC and Dealerweb are similar each month
- TrueEx slightly down from Dec, again due to lower SEF Compressions
- GFI just registers
So what can explain IGDL and Tullet higher and Tradition lower?
Lets look at CME-LCH Switch trades.
CME-LCH Basis Spreads and Volumes
CME-LCH Basis Spreads tightened during the month with 10Y down 0.4bps to 2.65bps and the volumes of these CCP Switch trades might give us a clue.
Using SEFView we can isolate CME Cleared Swap volume at the four major D2D SEFs (on the assumption that this is all CME-LCH Switch trade activity). Lets look at this for the past 3 months.
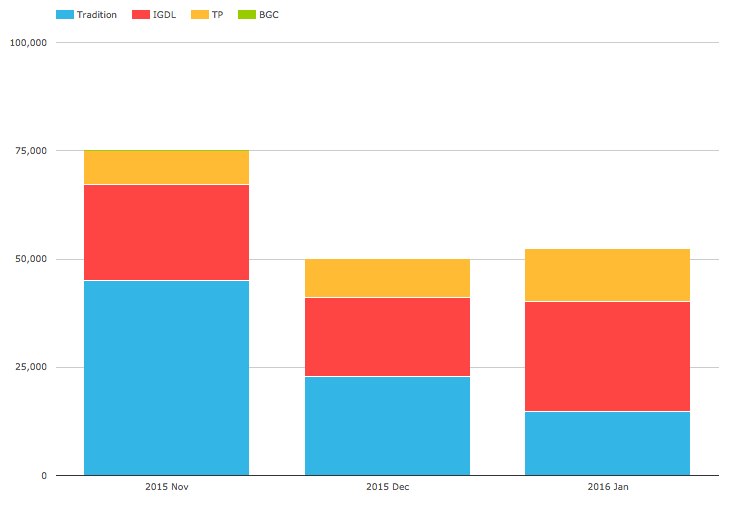
Showing that:
- Overall volume in Jan is $52 billion gross notional
- Just higher than Dec, lower than the high in Nov, but above the $35b median of prior months
- IGDL share is much higher in January at 48% than prior months
- Tradition is lower in January at 28% than prior months
- Tullet is also higher in January at 24% than prior months
This explains the relative change in overall share in the previous section and demonstrates how important CME-LCH Switch trades volumes now are to the overall volumes of D2D SEFs, generally representing 10-15% of monthly volumes for these SEFs in DV01 terms.
Global Cleared Volumes
Finally lets use CCPView to look at Global Cleared Swap Volumes for EUR, GBP, JPY & USD Swaps.
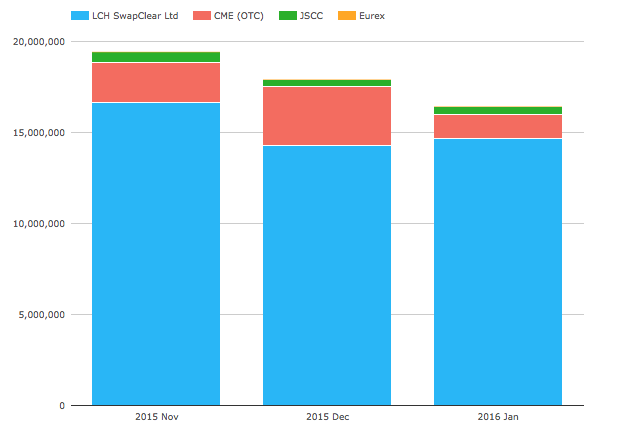
Showing that:
- Overall Global Cleared Volumes are down each month
- LCH SwapClear continues to increase its share, with 89% in Jan
- CME share is down, with 8% in Jan
- JSCC share is similar each month, with 3%
- Eurex not visible on the chart
And next USD Vanilla IRS comparing LCH Client Clearing with CME OTC on a percentage of total basis.
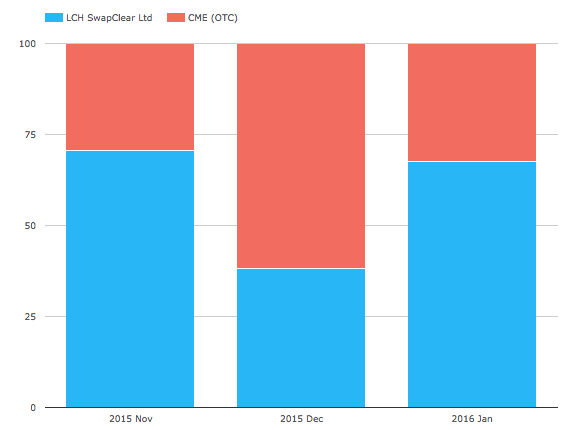
We know from the December Swaps Review that CME volumes would be much lower if a TriOptima compression run was excluded. So the meaningful comparison is November to January. This shows that November CME was 30% to 70% at LCH and January CME is 32% to 68% at LCH, so similar levels.
Thats it for today.
A lot of charts.
Thanks for staying to the end.
Our Swaps review series is published monthly.