As the financial industry moves towards the replacement of LIBOR the question asked is changing from what does IBOR Reform mean, to how I manage IBOR reform? A key subsequent question is “What is the change in value/change in risk of my LIBOR trade if it goes onto Fallbacks?” I thought that it would be interesting to see this, so here summary of how these changes in valuations/risk can be measured on a single 10 Y USD Swap trade. All analytics here have been done on our Charm risk platform using micro services. If you want to be able to do this type of analysis on your own portfolio please contact us at sales@clarusft.com
Fallbacks
As has been reported extensively, the changes to the derivatives documentation will be implemented shortly to allow trades to go onto fallbacks should LIBOR be discontinued. Practically this means from first LIBOR fixing (roll date) after the cessation of LIBOR, the trade will need to fix off the fallback index plus a spread where the spread represents the 5 year historical median between LIBOR and the fallback RFR.
The calculation of this spread between the forward-looking LIBOR and backward looking SOFR is represented by the following:

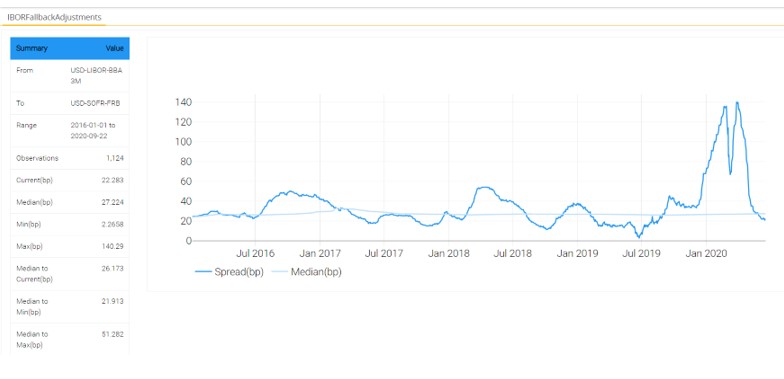
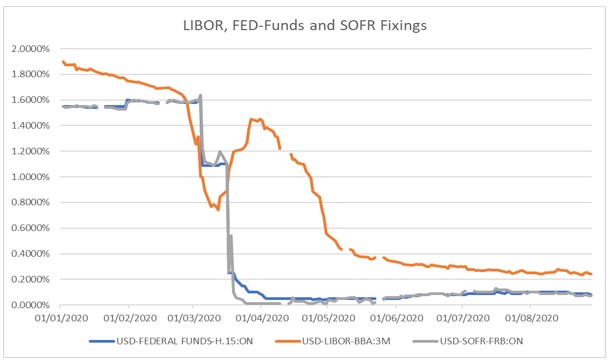
The volatility of the spread often represents both volatility in the basis market and the timing difference between a forward looking spread like LIBOR and an in arrears fixing spread like SOFR. The median spread for 3M LIBOR versus SOFR has hovered around 27 bps and it is expected to be close to this in when this is applied to fallbacks.
Constructing a Fallback Trade
Let us look at a single trade and calculate the risk measures on this trade should it go onto fallbacks.
In this exercise I am going to do a USD 100M 10Y pay fixed 1.775% trade executed on 10 Jan 2020. I will call this the ORIGINAL Trade.
1.775% was the par rate for 10-year swaps at the end of day on 10 Jan 2020. The PL at inception on this trade is therefore 0.
For us to represent the fallback trade, assuming that the cessation date of LIBOR is 31 Dec 2021, we need to split the original trade into two parts as per the diagram below:

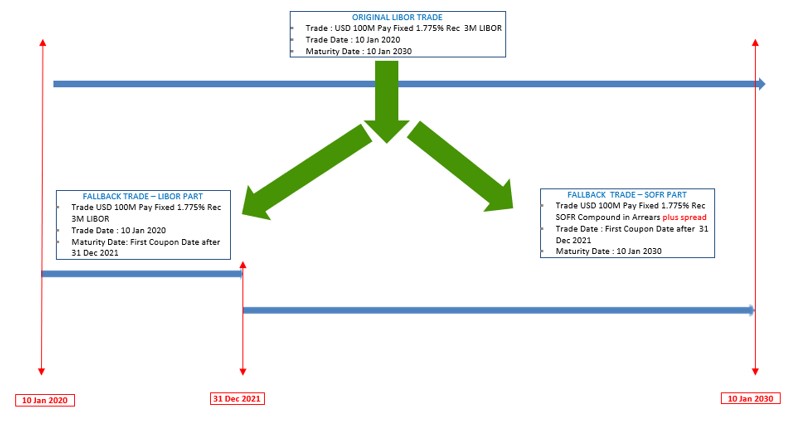
The first part of this split trade would have all the characteristics of the original trade, but it would terminate after the first roll date after LIBOR Cessation date. Let us call this the FALLBACK TRADE – LIBOR PART
The second of this split trade would be the new Fallback trade that would start on the first roll date after the cessation date, but the Floating Leg would be SOFR compounded in arrears. Let us call this FALLBACK TRADE – SOFR PART
If you add FALLBACK TRADE – LIBOR PART and FALLBACK TRADE – SOFR PART together you should be able to get to a value and risk profile for your trade if it goes onto fallbacks Lets call these two trades added together (or managed in a portfolio) as the FALLBACK TRADE.
For good measure it would also be interesting to see what would have happened if when you did this original LIBOR trade, your dealer also offered you a 10Y SOFR trade versus the same fixed rate (of 1.775%). We will call this the RFR Trade.
Risk
Let us first look at the Risk profiles of the three trades on trade date (10 Jan 2020) .
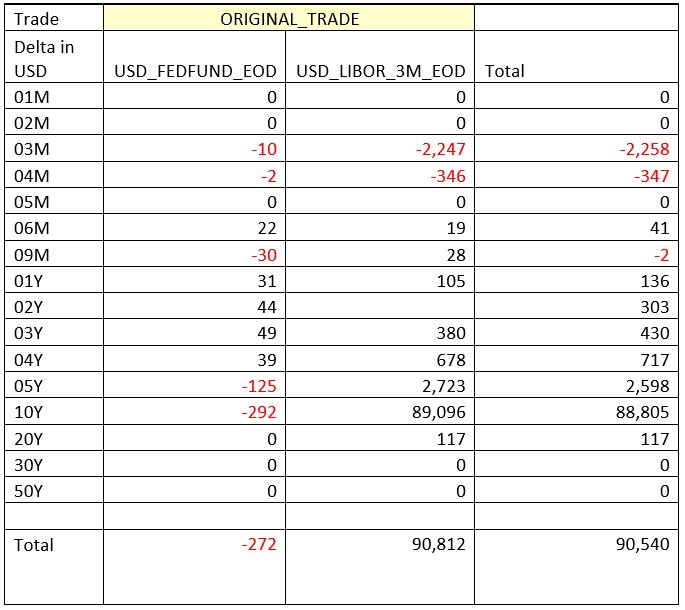
For the ORIGINAL trade (which has FedFunds discounting). The risk looks as follows:

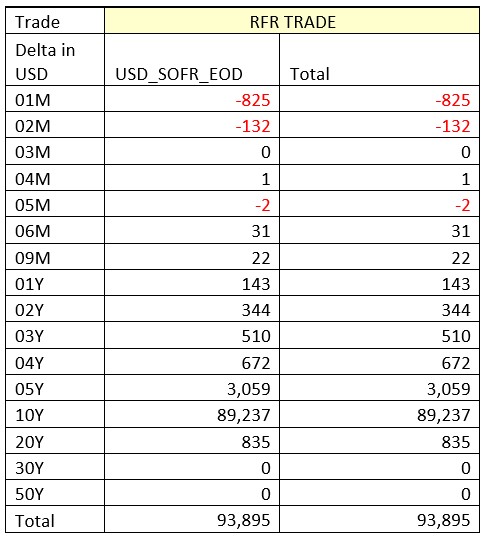
For the RFR Trade has SOFR discounting, so the risk is only to one curve.

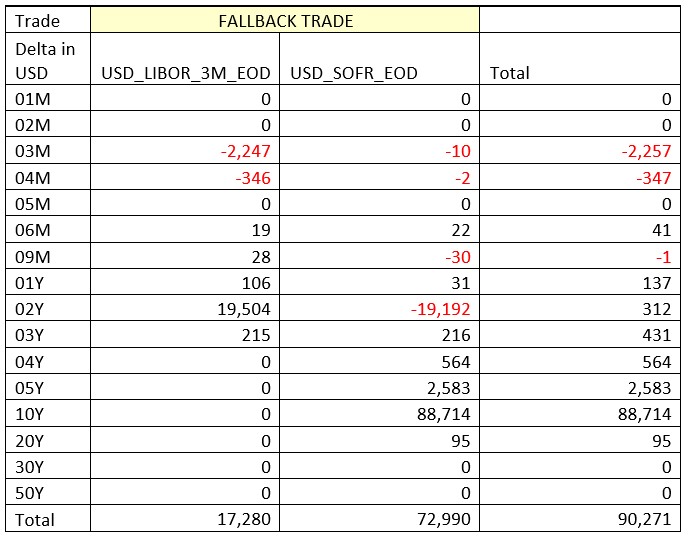
For the FALLBACK Trade, with SOFR Discounting, note the SWITCH to SOFR Risk from LIBOR Risk at the 2-year bucket.
Valuations
Next you would want to quantify the PL on the trade. Let us first look at the PL on the Original Trade over time.


The PL on this trade (that is a paid fixed) reflects the significant movement in rates over the period due to the COVID crisis. We can also look at PL of the various trades on inception date for the each of the trades.

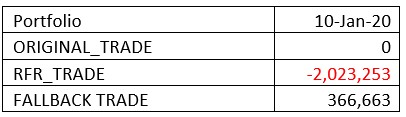
The original trade, done at PAR, has a PL of zero. Expected as this trade was a trade done at the EOD 10Y Par Rate
The RFR trade, which has a pay fixed at the same rate as the original trade has a negative PL. The PL in this trade reflected the basis between the SOFR and the IBOR Index.
The FALLBACK Trade has a PL number of +366,663. This again is to be expected as the FALLACK Trade – LIBOR part is a two year pay fixed swap with a fixed rate equivalent to the 10 Year par.
FALLBACK TRADE – SOFR Part is a forward starting 8 year pay fixed swap with on SOFR plus a spread of about 27.2 BPS. This spread is higher than the basis spread between LIBOR 3M and SOFR on trade date hence the positive PL on the trade.
As below lets zero out the PL on the ORIGINAL Trade and also zero out the inception date PL (from above). This allows use to remove the impact of LIBOR moves and the impact of the inception date PL. This gives a clear insight into the PL movements on a LIBOR trade that goes onto fallbacks.


This provides some interesting insights.
Let us start with the FALLBACK trade. Here the PL on the trade reflects the change in basis between the SOFR and LIBOR. This reflects the difference in the value of a trade (versus a straight LIBOR valuation) should you decide to terminate the trade before it automatically goes onto fallbacks. This is a number that any buy side firm should monitor when discussing valuations with their dealer.
On the RFR Trade there is a move in PL, from 10 Jan to 24 June) that is bigger than the move in the basis. This is an issue that is caused by the blowout in spread between the forward-looking LIBOR and backward looking SOFR Spreads seen in the first graph. This blowout of the spread is due to a being a “spike” in LIBOR fixings versus SOFR Fixings in early April 2020. Remember that all the LIBOR legs in this example all had a fix around 10 April. This would be a classic example of the “CLIFF” that could take place over the IBOR transition period.

Measuring this on your portfolio
I have in this blog only focused on a single trade. You would want to look at multiple currencies, multiple tenors and multiple cessation dates across a suite of derivatives products all of these products are impacted by what I have showed in this example. Knowing what the impact of IBOR reform could be on your portfolio and knowing what the value of trades would be if they go onto fallbacks will be critical to the effective management of IBOR Transition over the coming years. If you are interested in a more detailed discussion please contact us on sales@clarusft.com