Following on from my blog post of Day 3, I wanted to provide an update of Week One and also take a longer view; the Year to Date.
First two points of note:
- As Daily Swap volumes can fluctuate widely, it is generally better to look at weekly or monthly figures.
- We are observing trends and not establishing absolute numbers (more on this later).
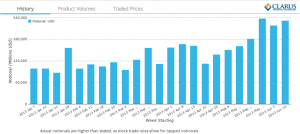
Now lets look at a chart of Cleared USD Swap Gross Notionals by Week from January 7 to June 14. (Click to enlarge)

And then the same but for Uncleared USD Swaps. (Click to enlarge).
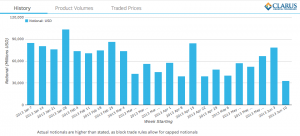

So the trend is very clear Uncleared volumes Down and Cleared volumes Up.
With the weeks leading up to and including March 11 and June 10 deadline dates showing the largest changes.
We can also make the following observations:
- The week of June 10-14, has the lowest volume of Uncleared USD Swaps of any week and almost the highest volume of Cleared USD Swaps.
- The highest being the week of May 27-31, so leading up to June 10 deadline.
- In the week of June 10-14, 88% of USD Swap volume was Cleared and 12% Uncleared.
- Cleared Swaps volumes have increased 100% comparing 4-weeks in January to the latest 4 weeks.
- Uncleared Swap volumes have dropped 60% comparing the average of 4 weeks in January to the week of June 10-14.
As with all statistics figures need to be used with a level of understanding of the assumptions and data.
In the first instance some allowance must be made to the 2013 timeline of reporting; so as the year went on more firms came online for trade reporting and more firms started to clear; which makes doing Jan to June comparisons, an exercise in faith.
Secondly those of you that read my Day1 and Day3 blogs may be wondering why I have switched from Trade Counts to Notionals.
Well it is a long winded answer, the short version is each has its imperfections. The long version is:
- A month ago I used only Gross Notionals as more meanigful.
- Then I became aware the the block and large trade capped notional rules had a much larger impact on understating gross notionals than I had expected.
- (More on this point in a future blog post).
- So I switched to trade counts.
- Then the definition of a trade and trade counts became an issue.
- Block trades are executed and published by DTCC as price dissemination events but are then subsequently allocated into many trades which are cleared.
- Bi-lateral trades become two trades when cleared.
- I could go on, …
- Whichever measure you use shows the same trends, so in some sense it does not matter.
- However people have a tendency to want, quote and remember absolute numbers.
- So I have now decided that the Notional measure has the least drawbacks, so I will use this.
- At least for today and the known future and perhaps a bit of the unknown future, ….
In summary as any good economist will tell you, we need more and better data.
So we need more weeks to pass to establish the trend noted above.
As always check back on SDR View to update your view, add color, learn nuance, quote more figures, click around, …
One thing is clear, the deadlines for mandatory clearing have been met.
Regulators, Sell-side, Buy-side and Service providers have succeeded in a huge effort.
Lets hope it takes us to a better place.
Or at least more interesting times.