- We analyse sovereign bond trading volumes from Bloomberg and Tradeweb APAs and MTFs.
- Tradeweb APA sees the largest volume of trades.
- MTF market shares are roughly 50/50 between these two D2C platforms.
- 67% of German Bund volumes were executed on-venue.
- Only 18% of French OAT volumes were executed on-venue.
Bond Trading by Venue
Armed with our Bloomberg and Tradeweb data sources, let’s take a dive into Sovereign Bond trading this week. As we all know, this should be easier than it is proving, but we can at least see a large slice of the markets by interrogating our available Bloomberg and Tradeweb data.
Some notes before we get onto numbers and charts;
- This week, we look at all bonds classified as either “Sovereign Bonds” or having a “State Guarantee”.
- We take data from the Bloomberg APA and the Tradeweb APA. This typically covers trades transacted off-venue or on a “Systematic Internaliser” – i.e. by a bank acting as principal to a client trade.
- We also take data from the Bloomberg and Tradeweb MTFs.
- To get a complete view of the market, we would also need to consume transparency data from all MTFs listing Sovereign Bonds, and all APAs reporting sovereign bonds.
- This task would be made much simpler if we had any faith that the ESMA registers were complete. But given how ESMA still hasn’t updated its’ register to list even the APAs on the FCA’s register, we are still falling way short of the bare minimum transparency requirements.
First, the overall data;
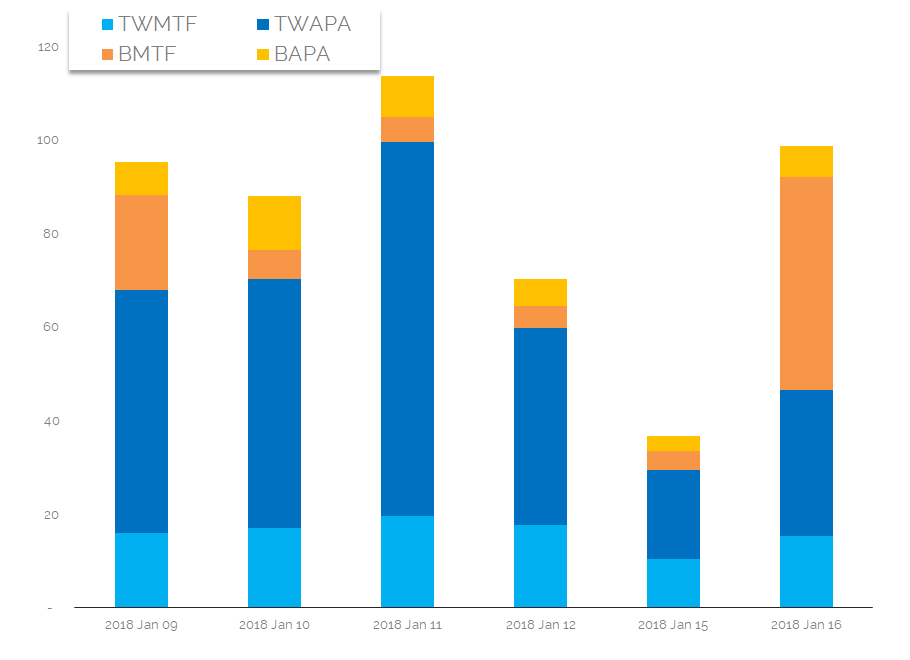
- We show total notional volumes (in billions of EUR) transacted across six trading days in the middle of January 2018.
- We gain transparency into a market that has an Average Daily Volume of at least €85bn (total volume over six days was €500bn+).
- Across the six trading days, the Tradeweb MTF (TWMTF) saw a volume of €96bn.
- The Bloomberg MTF saw a volume of €86bn (47% plays 53% BBG vs TW, similar to the IRS market).
- These volumes are relatively small compared to those reported to the Tradeweb APA. This saw €277bn reported over the period, much larger than rival Bloomberg’s APA at €43bn.
- Overall, 64% of volumes were transacted off-venue. This covers all sovereign bonds, not just those deemed “liquid”.
APA Data by Currency
Let’s focus on the APA data seeing as it is a larger data-set. First, by currency:
Showing;
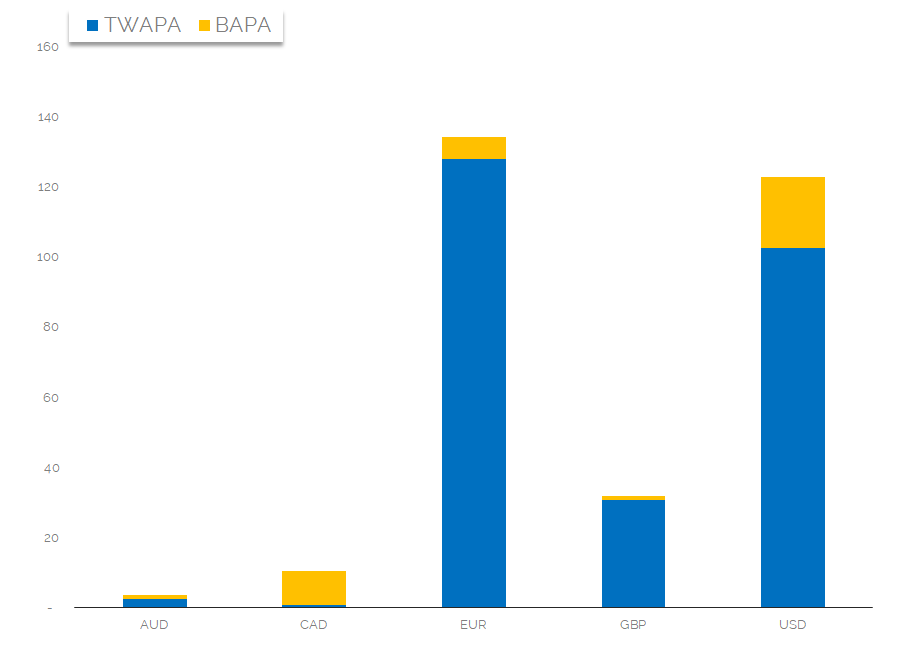
- Sovereign Bond volumes reported to APAs between 9th-16th January split by the top five currencies.
- Generally, Tradeweb sees the vast majority of trades reported to its’ APA.
- Across the five currency pairs, the Tradeweb APA has a “market share” of 87%!
- Bear in mind that this figure is hugely skewed by the large number of USD and EUR bonds reported to TWAPA.
- For example, in CAD, the Bloomberg APA has a “market share” of 93%.
- It suggests that we may see a monopoly type effect in trade reporting. No one wants to be the only person reporting a particular bond to an APA!
APA Data by Issuer
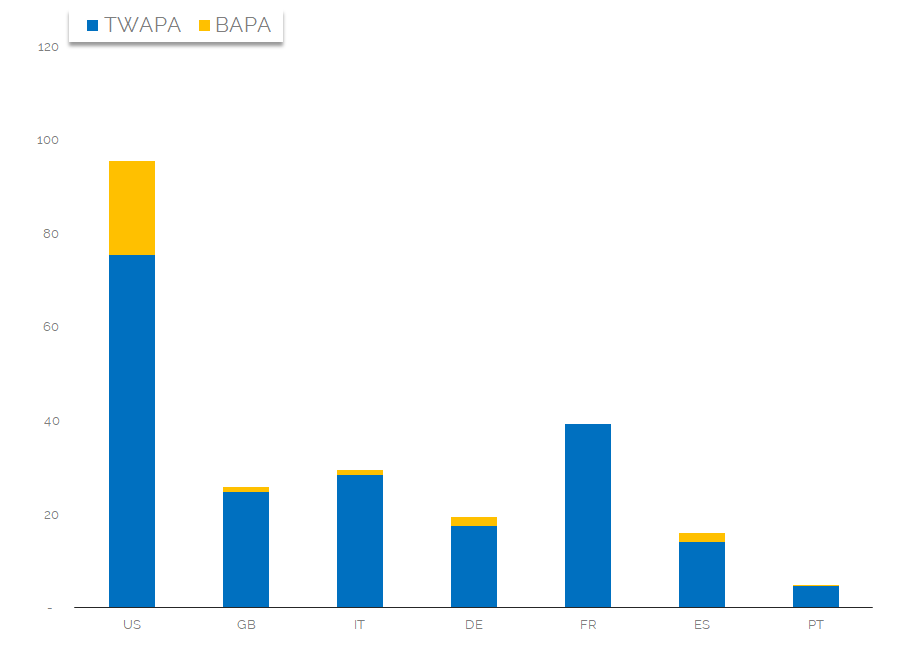
It’s taken me two months…but I’ve finally found a useful feature of ISINs! We can infer the country of issuance from the first two letters of the ISIN. What does this geographic split look like for the APA data?
Showing;
- A huge volume of US trades.
- UK (GB = Great Britain) are larger than Germany – I find that very surprising, particularly when you compare relative size of Bund vs Gilt futures markets.
- These seven countries account for 72% of total volumes. There is a long tail past these, with another 41 countries!
- Outside of US bonds, TWAPA has a ~95% market share for bond trades reported to APAs.
- 47% of the BAPA volumes are US bonds.
Average Daily Volumes
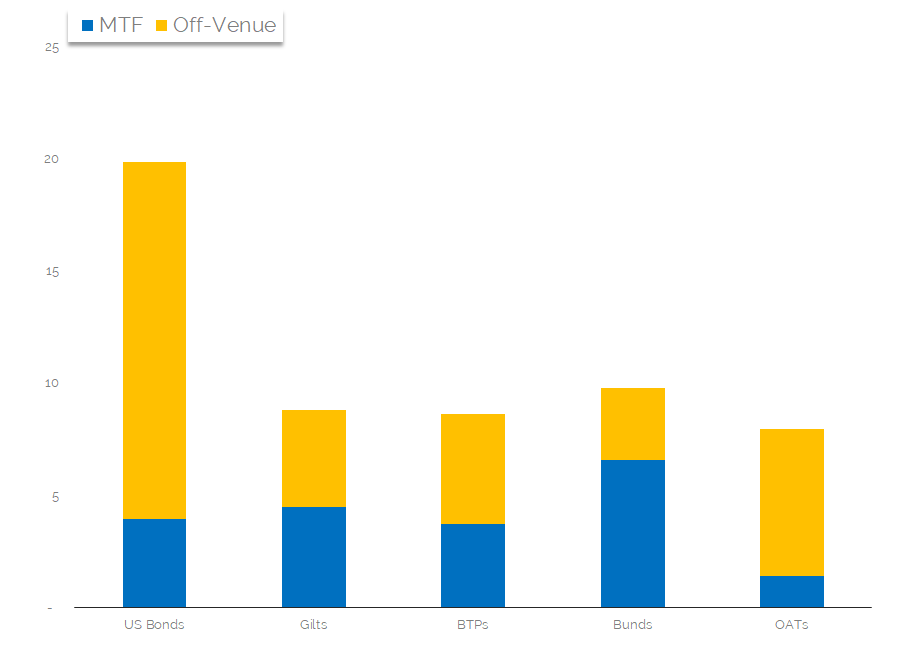
Armed with this data, let’s look at ADVs for the major bond markets – US bonds, Gilts, Bunds, BTPs and OATs.
Showing;
- US Bonds dominate reporting. With an average daily volume of nearly €20bn equivalent, they are nearly twice as large as any other issuing country.
- The size of Gilts (UK), BTPs (Italy), Bunds (Germany) and BTANs (France) market are very similar (~€10bn a day).
- The chart is also split to show what portion of bonds trade on venue (i.e. either the Bloomberg or Tradeweb MTF) and which are reported to an APA and hence traded off-venue.
- Only 20% of US Bonds were traded on-venue.
- 51% of Gilts (UK) traded on-venue.
- 43% of BTPs (IT).
- 67% of Bunds (DE)!
- But only 18% of OATs (FR)….
In Summary
- We do not have all of the data.
- But we now know that ADVs are around €10bn in each of the major bond markets across Europe.
- The Tradeweb APA saw over three times as much volume reported to it than the Bloomberg APA.
- Overall, 36% of volumes were transacted on-venue.
- On-venue volumes increase to 40-70% for the major European bond markets (excluding France).