In this article I will review 2015 US Swap volumes as reported to US Swap Data Repositories (SDRs).
2015 was an interesting year, not because of market structure change; this having already been implemented in 2014, but due to increased volatility as the Fed “will-they-wont-they-when-will-they” played out.
The summary:
- On SEF vs Off SEF volume trends
- Compare 2015 with 2014 quarterly volumes
- Price forming trades: Outrights, Spreadovers, Curves, Butterflys
- Non Price forming trades: Compressions and Rolls
- Swap subtypes: Spot, Forward, MAC, IMM
- Swap Prices
Lets see what the data shows.
On SEF vs Off SEF
In SDRView we aggregate transaction level data from US SDRs, for Rates these are DTCC and Bloomberg.
First gross notional for USD Swaps Fixed v Float and all transaction types to compare On SEF with Off SEF.
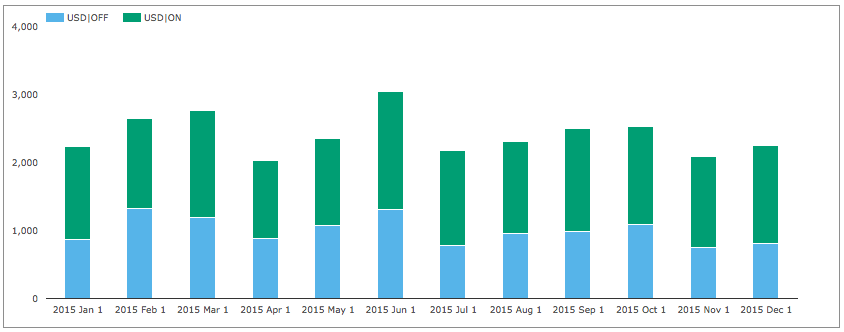
Showing that:
- Over $2 trillion gross notional is reported each month
- Off SEF decreases over the year while On SEF increases
- June was the highest volume month
- April was the lowest volume month
(Recall that block trade rules mean that the gross notional is somewhat understated due to capping of notionals, nevertheless this does not impact the trend, it just raises the absolute levels).
USD Price Forming Trades
In practice the raw data from an SDR needs to be enriched to extract more meaningful information.
We do this enrichment in SDRView to identify transactions that are price forming, transactions that are packages e.g. Curve and Butterflys and transactions that are not price forming e.g. Compression and Rolls.
So lets compare 2015 quarterly volumes with 2014 volumes and do so using DV01 for USD pricing forming trades: Outrights, SpreadOvers, Curve and Butterflys.
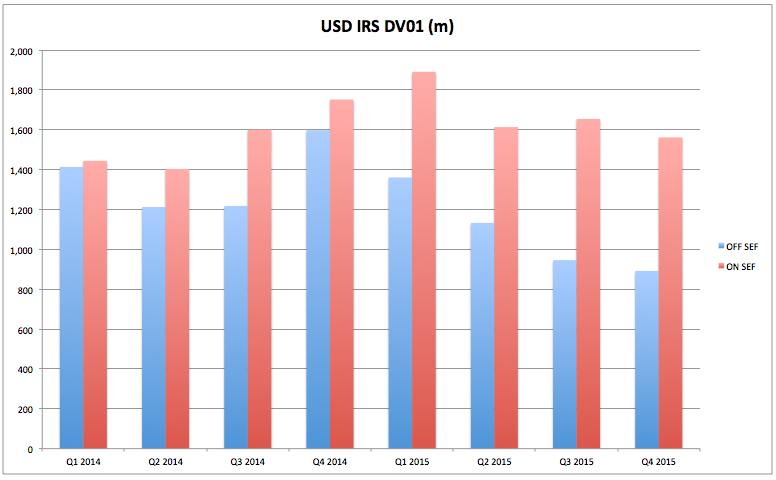
Showing that:
- Off SEF and On SEF were at parity in Q1 2014
- (Mandatory execution on SEFs was in Feb 2014)
- Off SEF has decreased significantly and continues to do so
- On SEF has increased but reached a steady state
- In Q4 2015 On SEF was > $1.6billion DV01
- While Off SEF was >$0.9billion DV01
- Q1 2015 was the highest On SEF month with > $1.8b DV01
Lets use pie charts to compare 2014 to 2015 and also include Cleared or Uncleared segments.
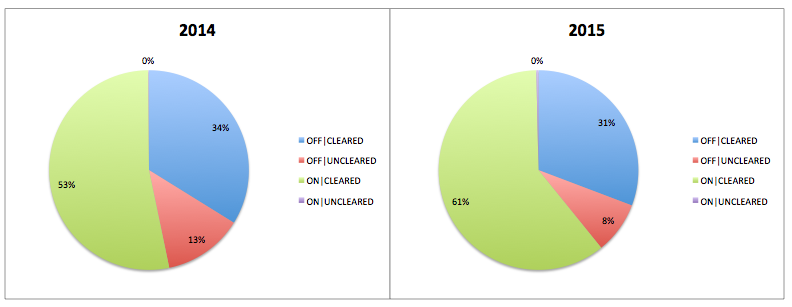
Showing that:
- On SEF Cleared has increased from 53% in 2014 to 61% in 2015
- Off SEF Cleared has decreased from 34% to 31%
- Off SEF Uncleared has decreased from 13% to 8%
- On SEF Uncleared (for Swaps) is negligible
We will come back to price forming trades.
ON SEF USD Compression and Rolls
Next lets look at non price forming USD trades; Compression packages and IMM Rolls.
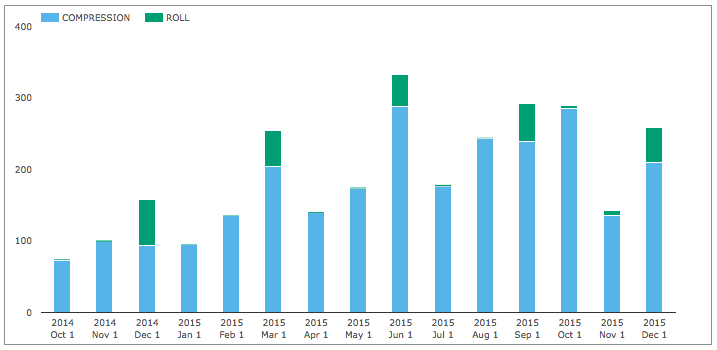
Showing significant increases in On SEF Compression over the period with June and October 2015 being the highest months with > $300 billion gross notional in each month.
And IMM Rolls steady in each quarterly month at > $50 billion gross notional.
Both clearer in the quarterly volumes chart:
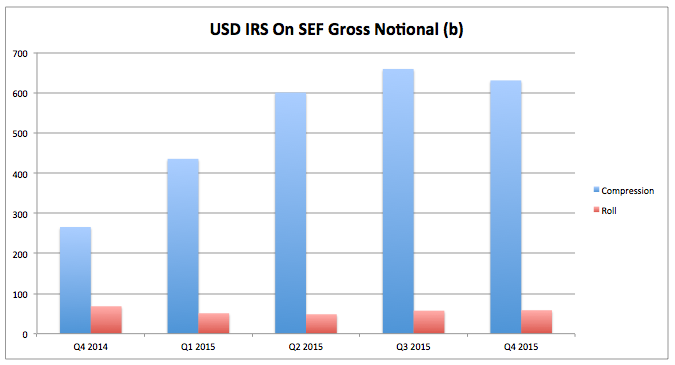
On SEF USD Compression at $600b a quarter, represents approximately 15% of total On SEF USD volume.
On SEF USD Packages
Lets now look at how much DV01 is traded as Outright Swaps vs Packages that have more than one leg.
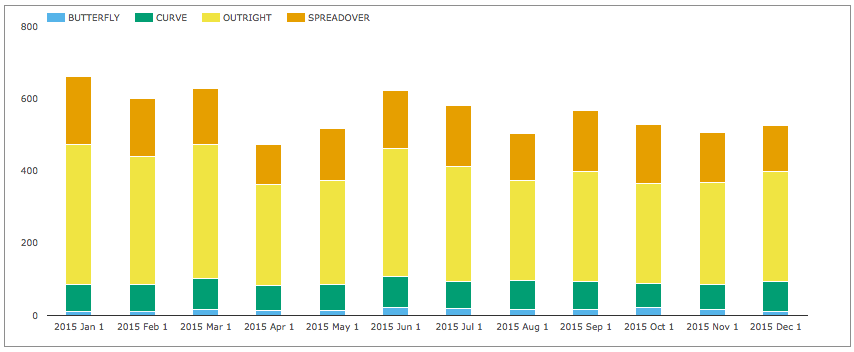
Showing that:
- Outright Swaps at > $300 million DV01 are 56% of the volume
- Spreadover Swaps at > $150 million DV01 are 27%
- Curve (Spread) Swaps at > $75 million DV01 are 14%
- Butterfly Swaps at > $16 million DV01 are 3%
- Similar levels of each type trade each month
- With more variability in Outrights and Spreadovers than Curves and Butterflys
On SEF USD Swap Subtypes
Lets now looks at the Subtypes of Swaps that trade On SEF, again using DV01.
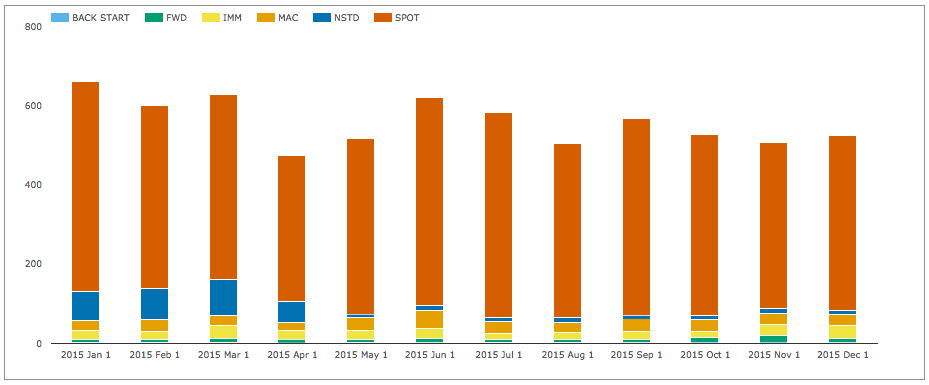
Showing that:
- Spot starting are the most common with >$460m DV01 and 83% of the volume
- MAC swaps are next with with > $32m DV01 and 5%
- (There is no increase in MAC Swaps volume over the year)
- Non Standard Swaps seem to have decreased markedly since April from 12% to 2%
- (Needs further investigation to verify this and identify reasons)
- IMM Swaps next with > $23m DV01 and 4%
- Forward start Swaps with >$9m DV01 and 2%
Off SEF USD Swap Subtypes
Lets compare this with Off SEF Swap Subtypes.
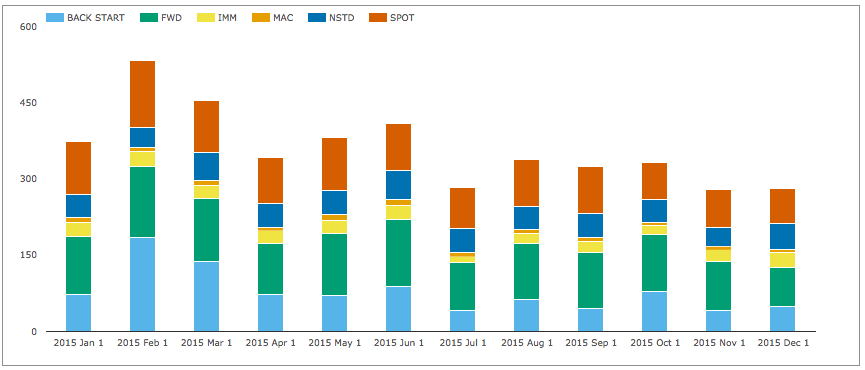
Showing that:
- Forward start are the most common with >$110m DV01 and 31% of the volume
- Spot start are next with > $90m DV01 and 26% of volume
- (These must be non MAT tenors or other exemptions)
- Back start, presumably reported after trade date, are down from Q1, but still 21%
- Non Standard Swaps are > $47m DV01 and 13%
- IMM Swaps are > $23m DV01 and 7%
- MAC Swaps are > $9m DV01 and 2%
We have noted before that Forward Start Swaps are the largest Swap Subtype not traded On SEF. Comparing the Off SEF $110m DV01 with the On SEF $9m DV01 shows that greater than ten times volume is Off SEF.
USD IRS Prices
Lets now switch focus to what happened to market prices using SDR USD Swap prices and a daily VWAP.
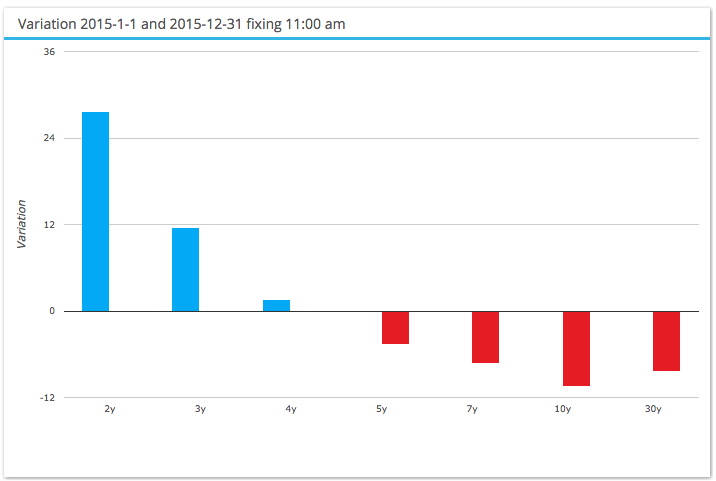
Showing that:
- 2Y Swap rates increased by 27 bps
- Consistent with the Fed Rate Rise of 25 bps
- The Swap Curve flattened with 4Y as the pivot
- 10Y Swap rates dropped 10 bps
And a chart of daily prices to show the trend and observed volatility.
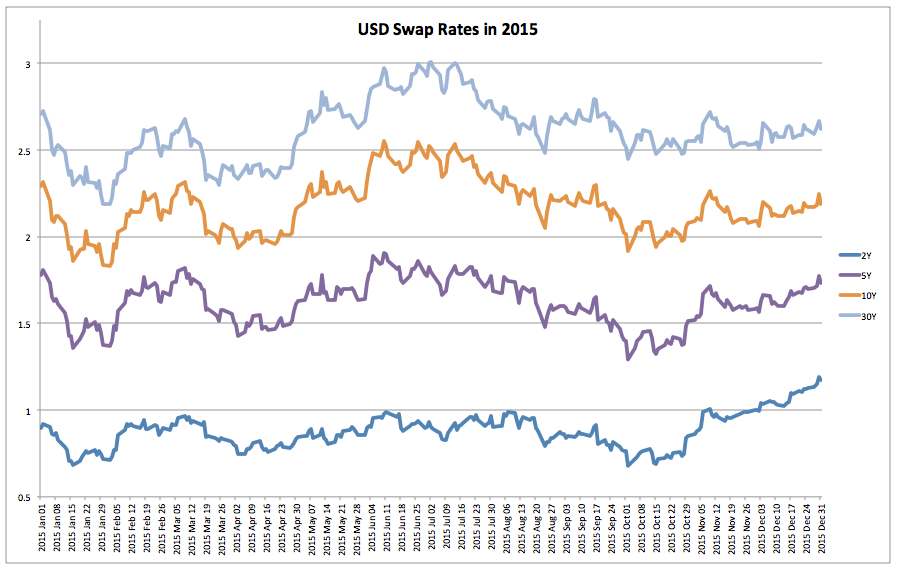
Showing both Up and Down trends in the year, culminating in a rise from mid-Oct onwards with:
- 2Y Swaps at a low of 0.70% and high of 1.19%, a range of 49 bps
- 5Y Swaps low 1.29% and high 1.90%, a range of 61 bps
- 10Y Swaps low 1.83% and high 2.55%, a range of 72 bps
- 30Y Swaps low 2.19% and high 3.00%, a range of 81 bps
And one of the big stories of the year; Negative USD Swap spreads.
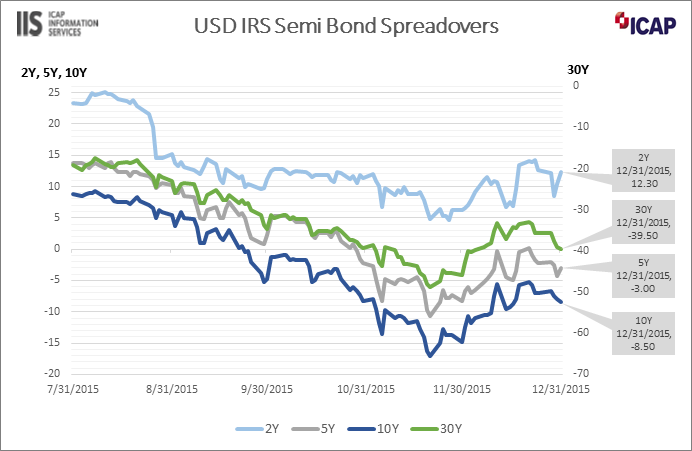
Showing that Spreadovers ( Swap spreads over Treasuries), which are generally positive reflecting the lower risk of US Government debt, turned negative in longer tenors, with the move starting in August 2015:
- 2Y Swap spreads down from +25 bps on 31-Jul to 12 bps at 31-Dec
- 5Y Swap spreads down from +14 bps to -3 bps
- 10Y Swap spreads down from +9 bps to -8.5 bps
- 30Y Swap spreads down from -19bps to -40 bps
Significant moves indeed.
EUR, GBP, JPY Swaps
Before we end, a couple of charts for the three other G4 Currencies.
First price forming trades, On and Off SEF.
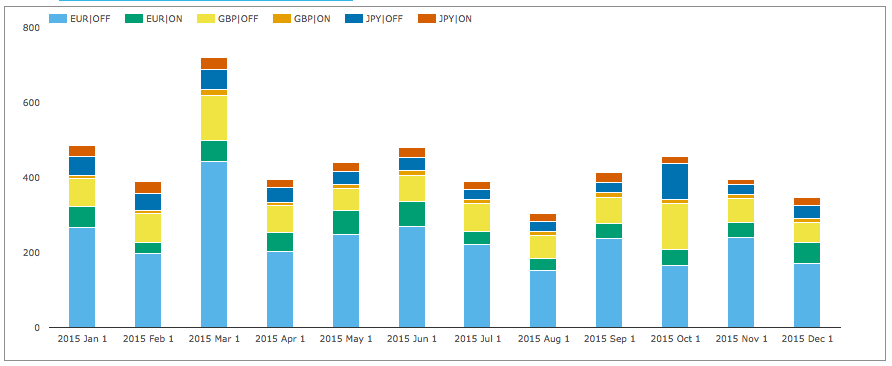
Showing that:
- Off SEF for EUR and GBP are the largest
- Overall DV01 is approximately $400 million
- USD Swaps DV01 is approximately $2.4 billion
- Making these three currencies one sixth of USD
- No obvious trend in terms of increases or decreases
And non-price forming trades that are On SEF.
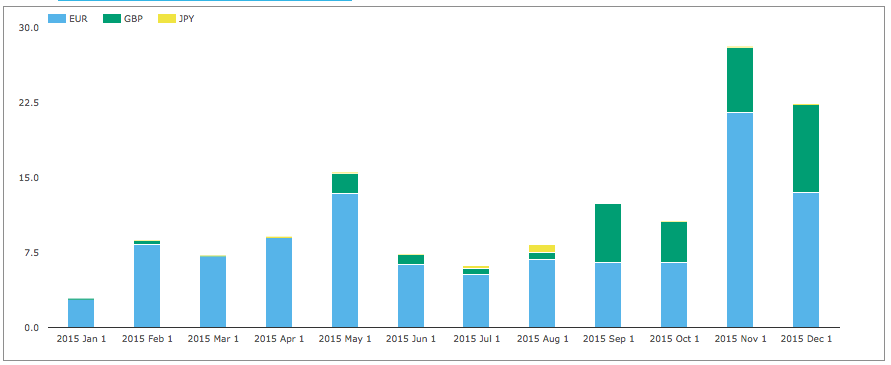
Showing a marked increased in EUR and GBP SEF compression activity from September onwards.
Wrap Up
Thats it for today.
Thirteen charts and only managed to summarise some aspects of SDR data.
I am tempted to add one more chart, if only to get beyond the superstitious 13.
But lets leave it there.
Those of you interested are welcome to try SDRView.
Next time I will look at Swap Execution Facilities.
And what the 2015 data from these shows in terms of market share and trends.