Last week marked the end of the package trade relief for MAT swaps dealt with US Treasury securities. As of Monday June 16th, all such packages needed to be executed under the trade execution requirement. Some folks will say the entire market is driven by such packages, so we should expect to see massive changes in activity. So I went looking for it.
DATA
Lets start by looking at the trailing 5 weeks of data:
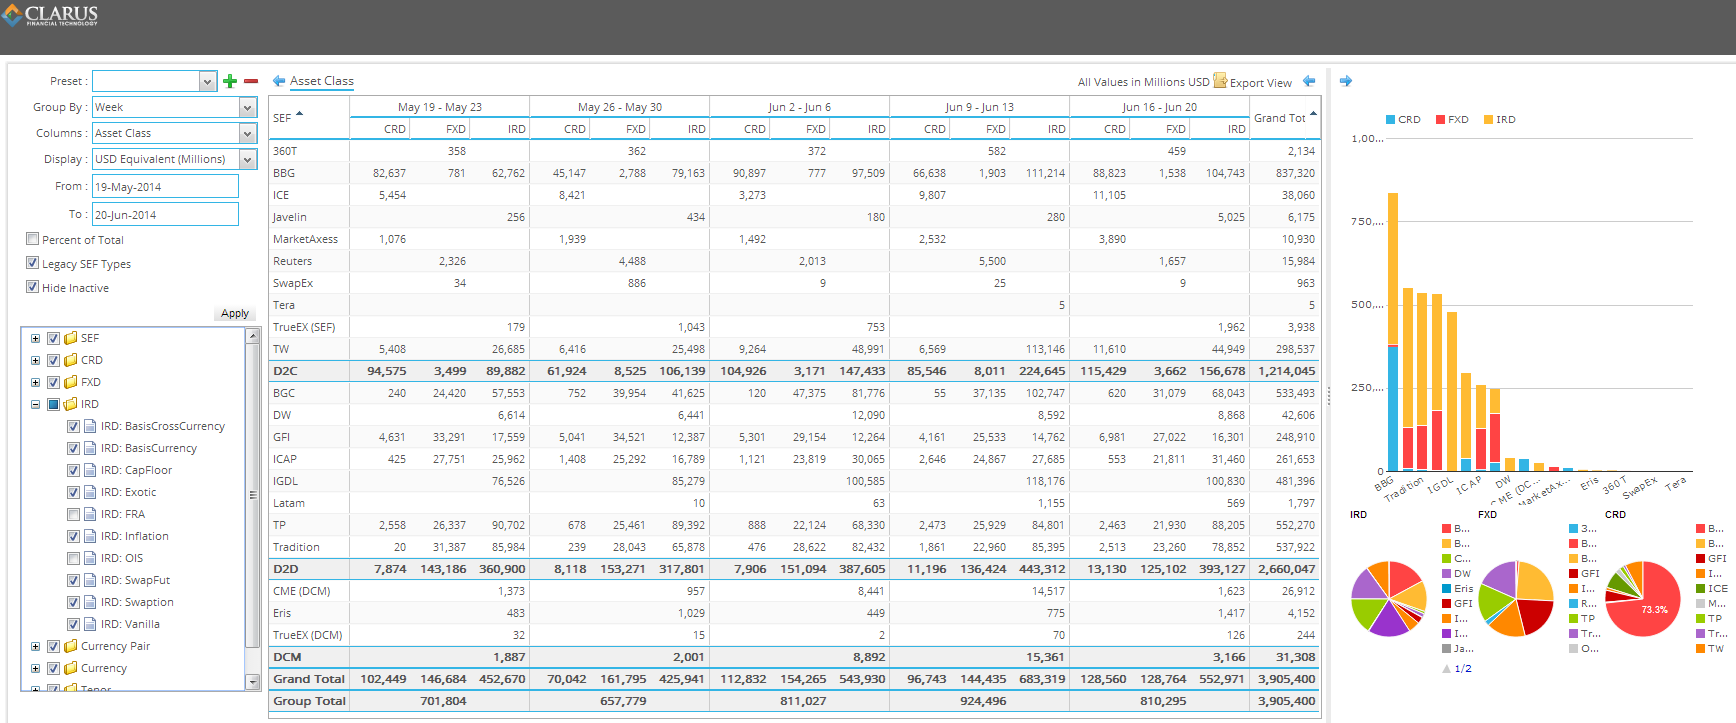
My commentary on last weeks data:
- Worth mentioning ICE. While you can see a general up trend over 5 weeks, if you go back many months and look at weekly data (as our SEFView subscribers can do), you’ll see this has been a slow, healthy grind upwards.
- Healthy activity from Tradeweb again, but not quite the banner week as they put up last week. The previous week seemed to have lots of block activity, more on that below.
- Nothing here points to any major change from the roll-off of relief from spread over treasury MAT packages
DURATION
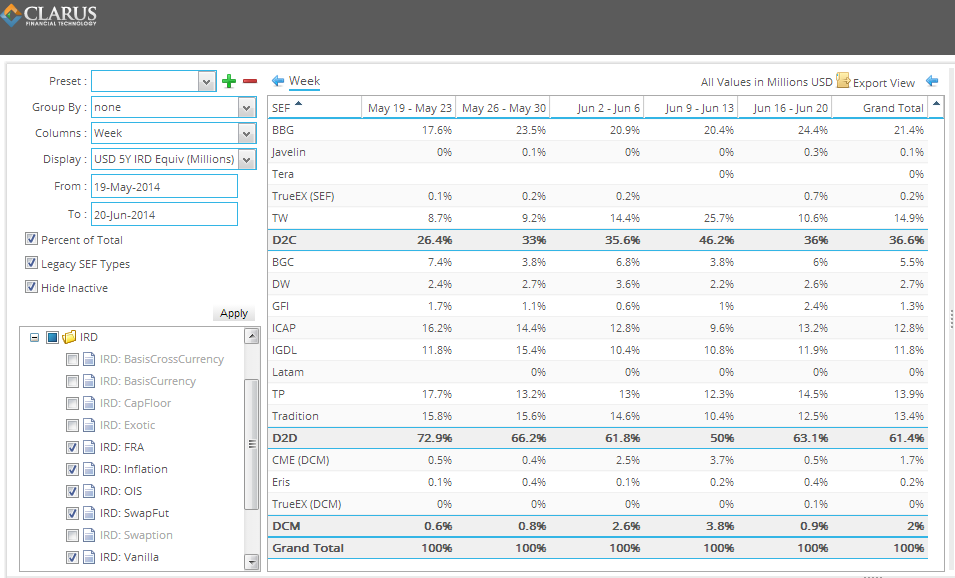
For sanity checking sake, I like to look at the 5YR duration-adjusted figures. This paints a nice picture of all of the rates activity. Note that this includes FRAs, OIS, and all other short-dated vanilla products.
BLOCK TRADES
Worth noting that some SEF’s clearly denote block trading activity within their daily dissemination of data. While none of the IDB’s report any block interest rate swap trades (or rather, do not transact these on SEF as they are not required), we see quite a bit of activity on the Client SEFs. Of particular note is Tradeweb’s numbers from last week. Would seem 84bn of the 113bn they reported in that week were block trades.

SPREAD OVER TREASURIES
I set out to determine what the spread over treasury (USD IR swap vs US Treasury package trade) market looked like pre and post the June 16 date.
For those of you out there that have tried to do an analysis like this, you quickly realize that the data is not rich enough to clearly determine what is what. Again, some of the things people generally want to know when looking at SDR and SEF data, but are unable to determine:
- SEF data shows positional information; SDR data shows trade level details
- SEF data shows actual trade/position size; SDR data caps trades above a threshold
- SEF data shows which SEF the trades/positions were executed; SDR data simply says it was dealt ON or OFF a SEF
- SEF data is provided in a myriad of data formats; SDR data is generally delivered in a somewhat common format
- SEF data is End-Of-Day; SDR data can be digested in real time
- SEF data allows you to imply if it was D2C or D2D activity; SDR data does not give any hint as to inter-dealer or client
- Neither SEF nor SDR data shows components of a package
On the final point, package trades; while we are not able to see components of a package, we can start to make some guesses. In fact, in last weeks blog, Amir examined possible package trades coming through to SDRView from the Bloomberg SDR. Now, I want to use some creativity to possibly un-sheath spread over treasuries.
First, a big assumption. When spread over treasuries are executed, they are quoted in basis point spreads over a US treasury bond. Because the US treasury market is priced to five decimals, and the spread quote is never more than 4 decimals (hundredths of a basis point), the underlying swap transaction comes through quoted to 5 decimal places. As an example:
- Bond yield = 2.12345 %
- Spread quote = 4.5 bp (.0450%)
- Resulting Swap price = 2.16845 %
So stick with me. If we then:
- Assume that no vanilla, non-packaged, outright swaps are quoted to 5 decimals
- Assume that no other packaged swaps are quoted to 5 decimals
- Acknowledge that we are potentially neglecting 10% of the market because you will have resulting spread trades that end in a “0”, eg 5.32850 (only “4” decimals)
Given all of the above, we can produce total activity for such spreads over treasuries. I mined SDR data from SDRView to come up with the following:
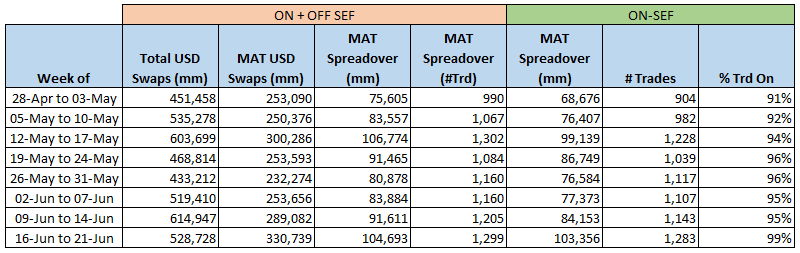
So let me walk you through this:
- Second column “Total USD Swaps (mm)” is the notional of all USD fixed/float, vanilla swaps transacted that week, across the active SDRs, both On and Off SEF
- “MAT USD Swaps (mm)” is the notional of those swaps which meet the MAT criteria (this runs about the 50-60% mark, deserving of an entirely different blog)
- “MAT Spreadover (mm)” is the notional of swaps that are both MAT, and meet my criteria for 5-decimal price quotes
- “MAT Spreadover (#Trd)” is the trade count for those trades
- The final 3 columns then examine the MAT spreadovers, but only those denoted to be On-SEF
So if we believe the assumptions, we can then draw some conclusions:
- Spread-over business is a decent (20%) part of the market
- It appears that the relief has indeed caused all (99%) of such trades to be traded On-SEF
- The spread-over business was largely On-SEF before the relief. While they may not have been executed electronically, they made their way onto a SEF (likely the IDBs?)
Does this jive with what you’d expect to see? Leave a comment or reach out to us over email. I’d be interested in some clarity here.
Until next week…