Continuing with our monthly review series, let’s take a look at Interest Rate Swap volumes in September 2016.
First the highlights:
- On SEF USD IRS Septmber 2016 volume was 5% higher than August
- Curve trade volume was down and Outright up from prior month
- SEF Compression activity was a healthy $200 billion in USD IRS
- USD OIS Volumes at >$2.4 trillion, again exceeded USD IRS ($1.8 trillion) for the second month
- Is it time to consider a MAT filing for USD OIS?
- SEF Compression in EUR & GBP at $89 billion was 44% of USD
- Much higher than the 19% ratio of EUR, GBP, JPY IRS to USD IRS (price forming)
- SEF Market Share shows Tradeweb increasing its lead over Bloomberg from the prior month
- TrueEX with a stonger numbers than prior months
- CME–LCH Switch volumes at $38b is back up from the low in August
- CME-LCH Basis Spread is up 0.3 bps on 10Y and 0.45 bps on 30Y
- Global Cleared Volumes were up for the third consecutive month
- LCh SwapClear up 12.5%, CME up 6%, JSCC up 21%
- In Asia, volumes reversed the down trend of the prior 3 months
- In LatAm, volumes were again up, with CME up 40% from prior month
Onto the charts, data and details.
USD IRS ON/OFF SEF
Using SDRView the gross-notional volume of On and Off SEF USD IRS Fixed vs Float price forming trades (Outrights, SpreadOvers, Curve/Flys).

Showing:
- September 2016 On SEF gross notional is > $1,160 billion
- (recall capped trade rules mean this is understated as the full size of block trades is not disclosed)
- 5% higher than August 2016 and 5% lower than September 2015
- September 2016 Off SEF gross notional is > $683 billion
- Same as August 2016 and 10% lower than September 2015
- And On SEF vs Off SEF is 63% to 37%, similar to the YTD average
And splitting by package type and showing On SEF DV01 (adjusted for curves and flys).
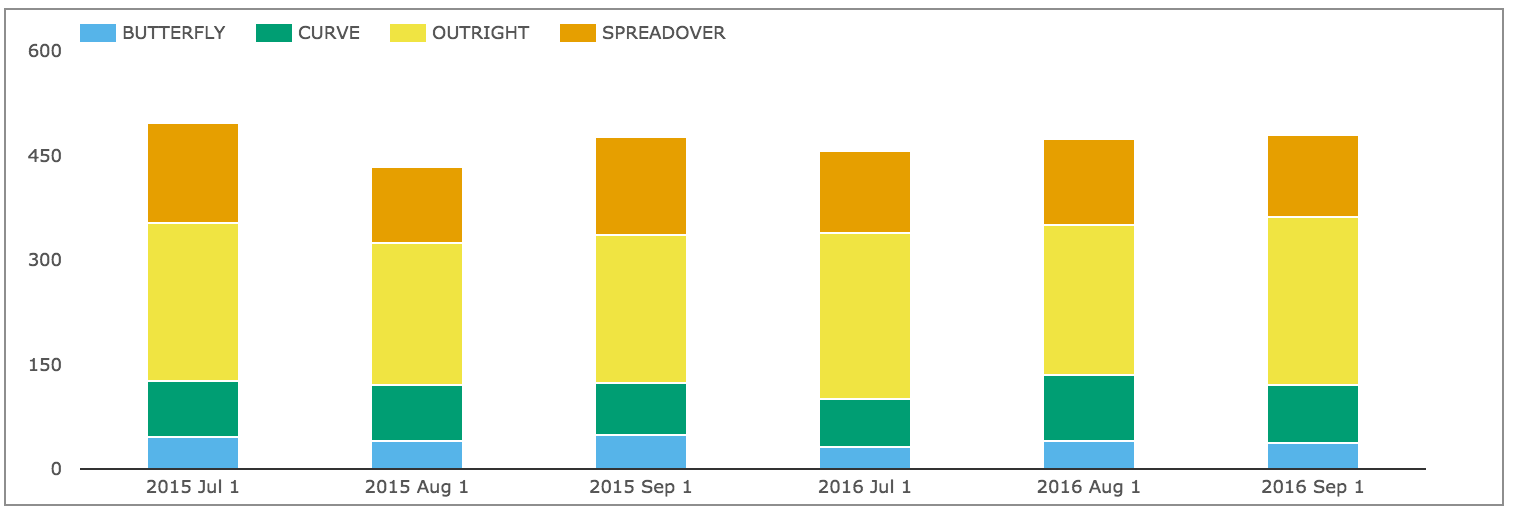
Showing:
- In DV01 terms September 2016 was similar to August 2016
- Overall >$478 million of DV01 was traded in the month
- (recall capped trade rules mean this is understated)
- Compared to September 2015, DV01 was also similar
- Curve trades were down 15% from their high in Aug 2016
- While Outrights were 11% higher than the prior month
- Butterflies and Spreadovers similar
And gross notional of On SEF non-price forming trades; Compression and Rolls.
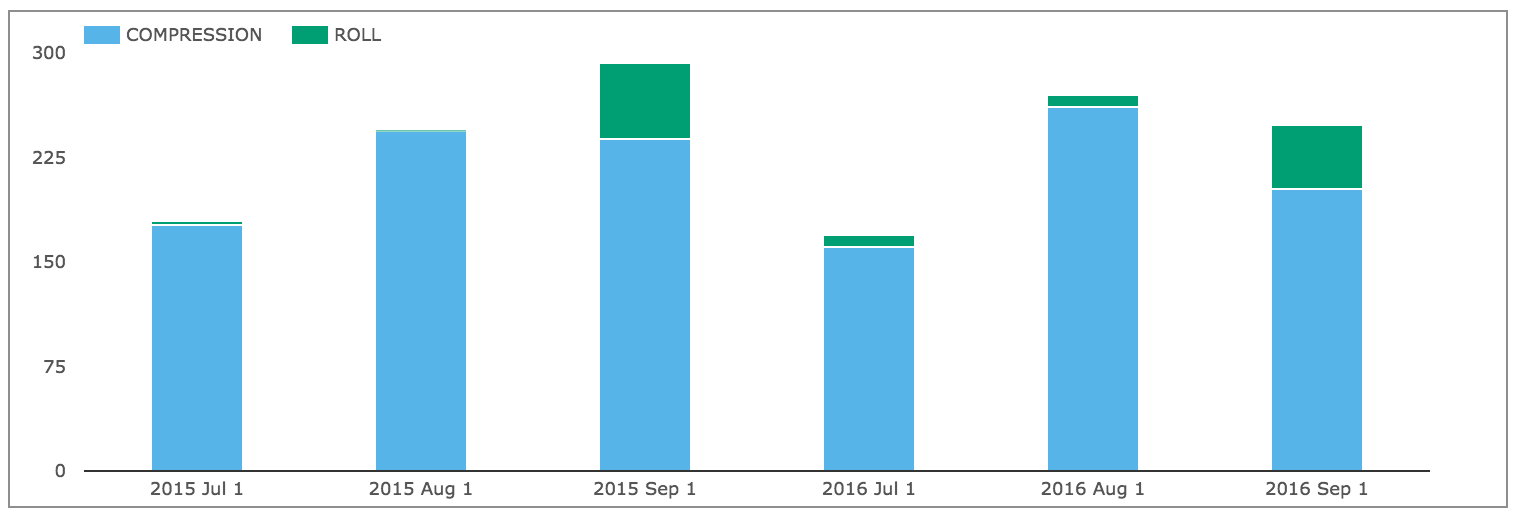
Showing:
- Compression in September 2016 was >$202 billion
- Down 22% from August 2016
- And down 15% from September 2015
- September 2016 is an IMM Month
- With >$46 billion of IMM Rolls
- Down 17% from to September 2015
USD OIS Swaps
Lets check and see how volumes in USD OIS Swaps have performed.
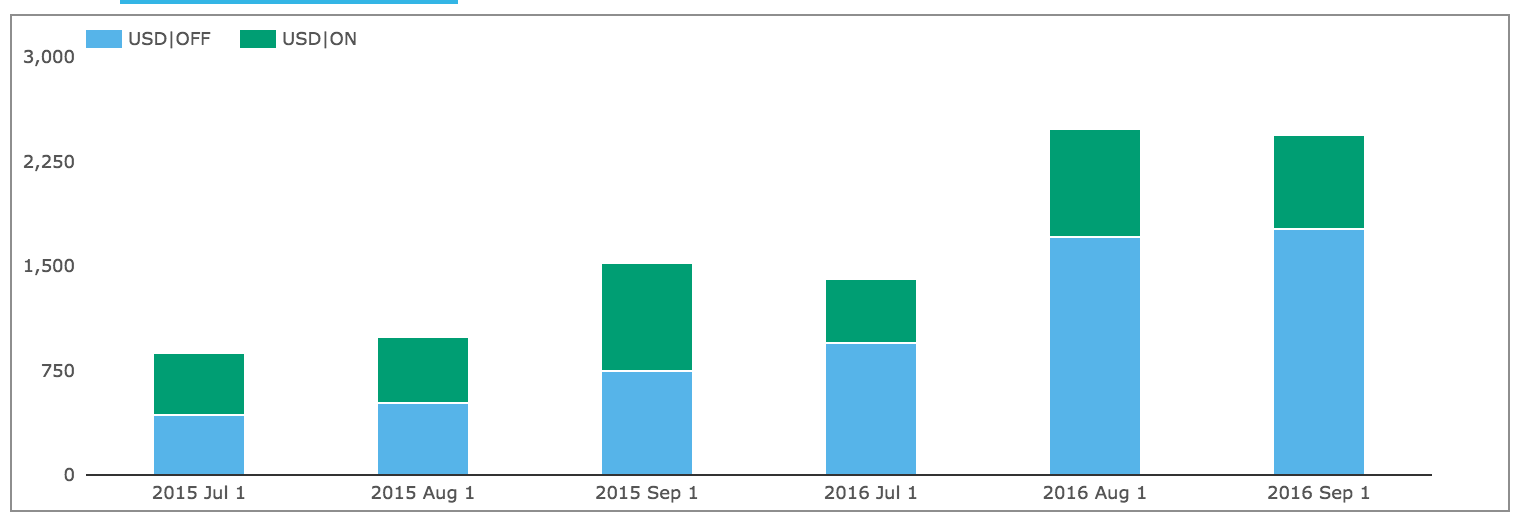
Showing:
- Volumes are at similar higher levels as August
- September 2016 Off SEF gross notional is > $1,764 billion, up from > $1,712 billion in August 2016
- September 2016 On SEF gross notional is > $676 billion down from > $764 billion in August 2016
- (recall capped trade rules mean this is understated as the full size of block trades is not disclosed)
- The combined total at > $2.44 trillion is similar to August 2016
- And higher than even the > $1.83 trillion of USD IRS in September 2016
- Granted OIS Swaps are shorter maturity, so far lower in DV01 terms than IRS
- But this is the second consecutive month that we see USD OIS higher than USD IRS
- Time to consider a MAT filing for USD OIS?
- Certainly a topic worth delving into on another day
USD IRS Prices
Lets now take a look at what happened to USD Swap rates in the month.
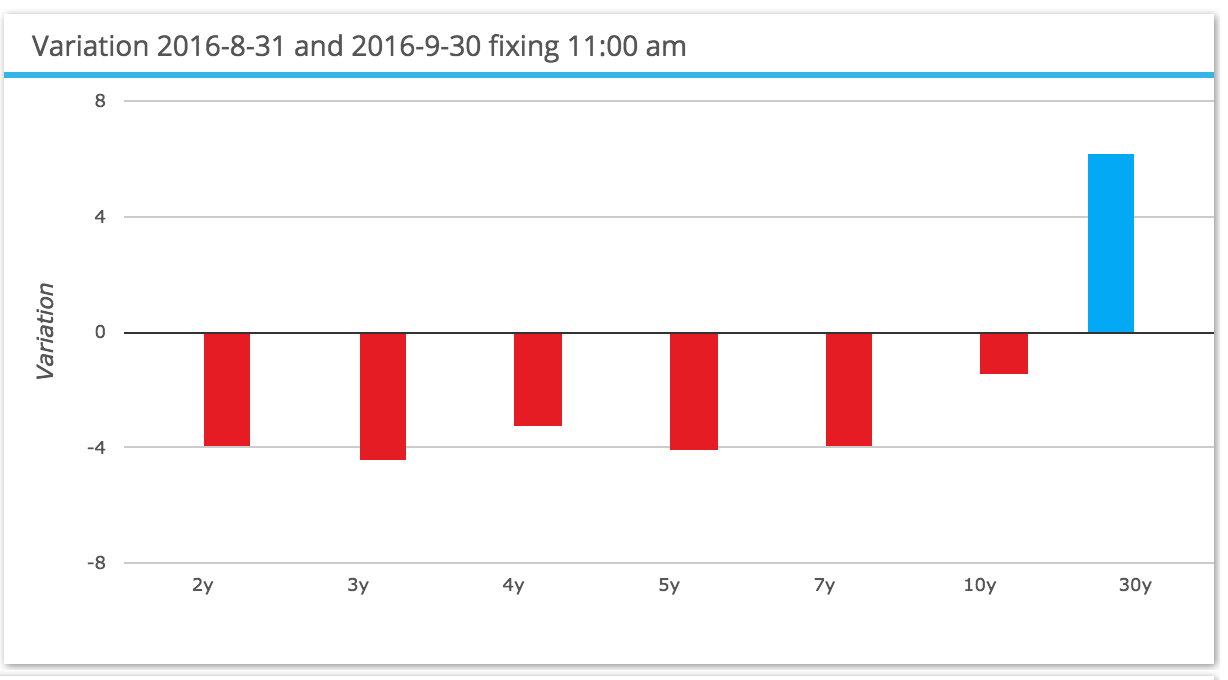
Showing:
- Rates down 4 bps below 7Y
- Rates up 6 bps for 30Y
- A Pivot up of the curve with 10Y as the anchor
- Almost the mirror opposite of the August move
- Just not as pronounced
EUR, GBP, JPY Swaps
Next On SEF volumes of IRS in the other three major currencies.
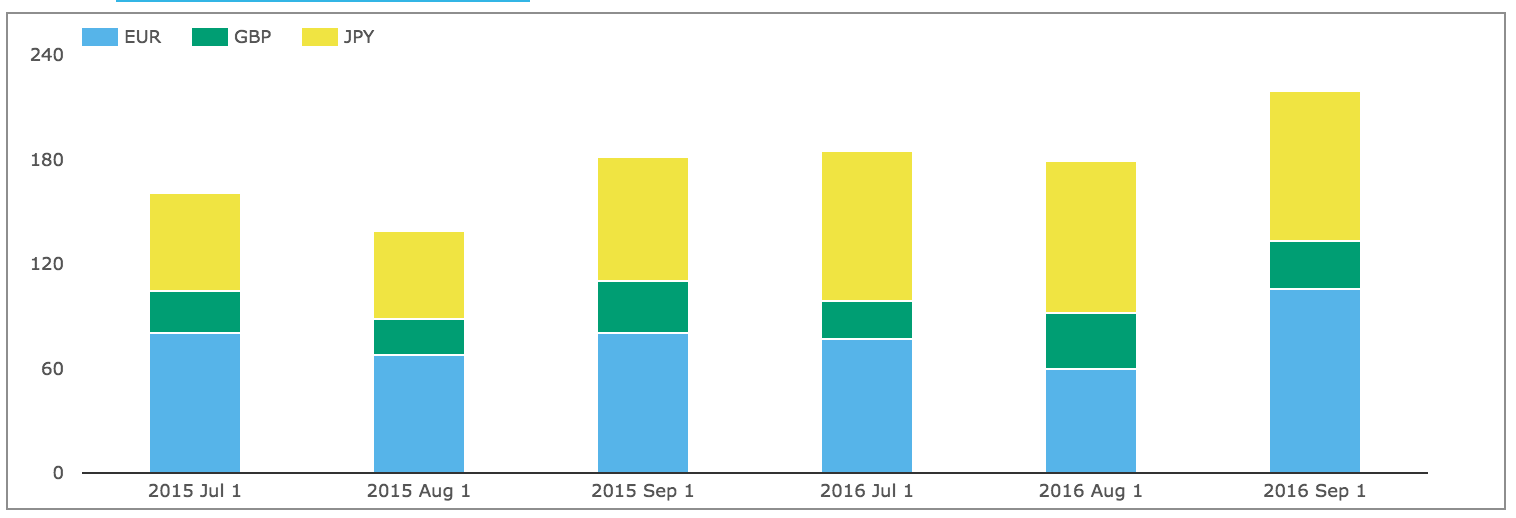
Showing:
- Volumes in September are up 22% from August
- EUR in particular is up $60b to $106b (though lower than the $146b in June)
- GBP and JPY similar to August
The overall gross notional in these currencies of >$220 billion is 19% of the USD volume, close to the 18% YTD average.
And then SEF Compression activity.
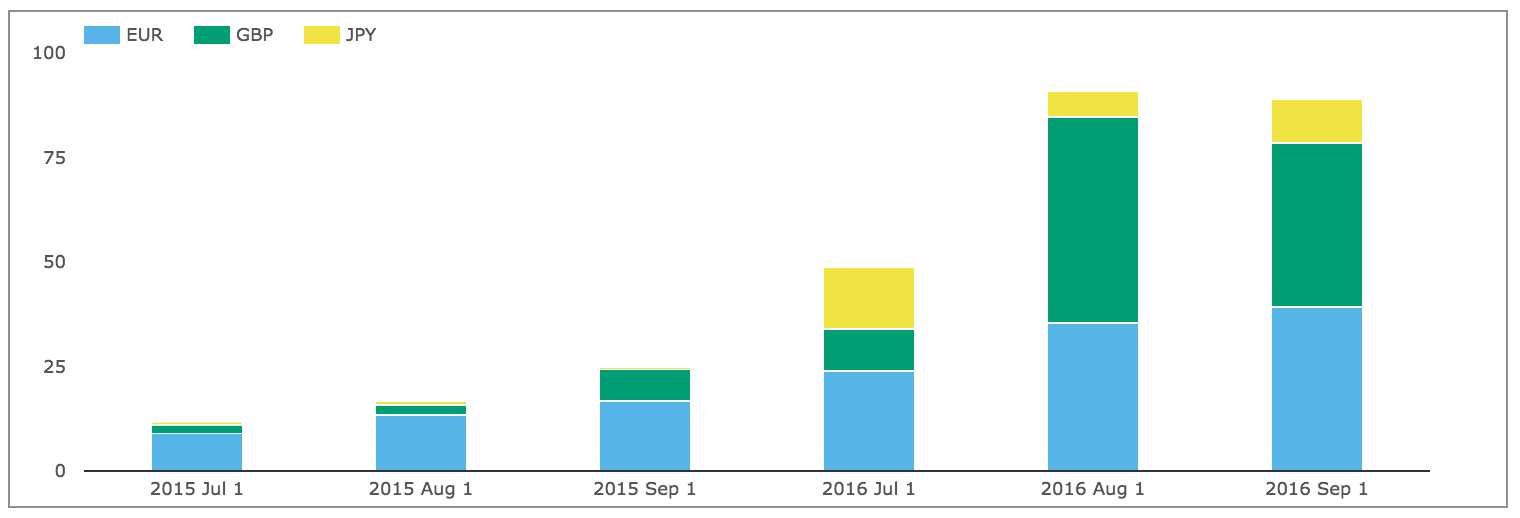
Showing that September had similar higher volumes to August, with EUR & GBP both significant and the overall volume of > $89 billion is similar to the prior month. It also compares well to the $202 billion of USD IRS as at 44% it is far higher than the 19% for price forming trades.
SEF Compression in EUR & GBP has been slower to take off than USD IRS, so perhaps we are now seeing some pent up demand creating higher figures, which may revert down. Time will tell.
EONIA and SONIA
Again similar to USD, lets check how volumes in EONIA & SONIA have performed.
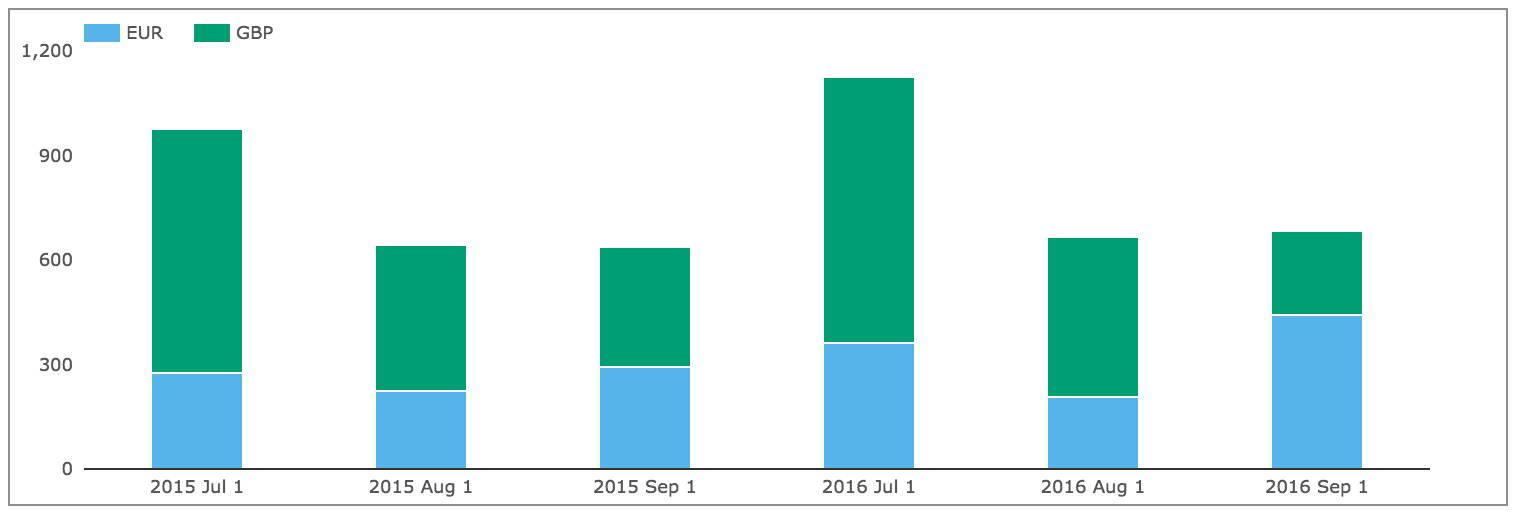
Showing that overall volumes in September at > $680 billion are similar to August, but down from the highs of July (and June, not shown).
Compared to the $2.4 trillion of USD OIS, the $680 billion of EONIA and SONIA is 28%, much higher than the 18% ratio for EUR, GBP, JPY IRS to USD IRS.
SEF Market Share
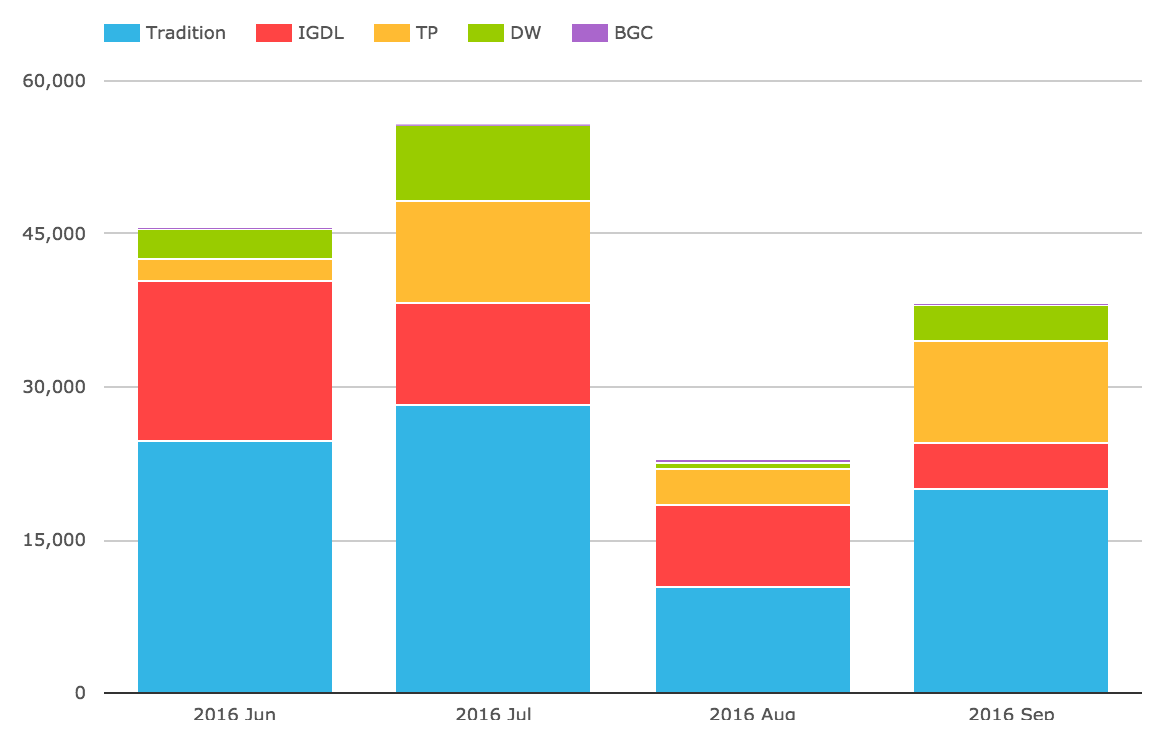
Lets now turn to SEFView and SEF Market Share in IRS including Vanilla, Basis and OIS Swaps.
DV01 (in USD millions) by month for USD, EUR, GBP and by each SEF, including SEF Compression trades and use a chart to compare the relative share in September 2016 with the prior three months.
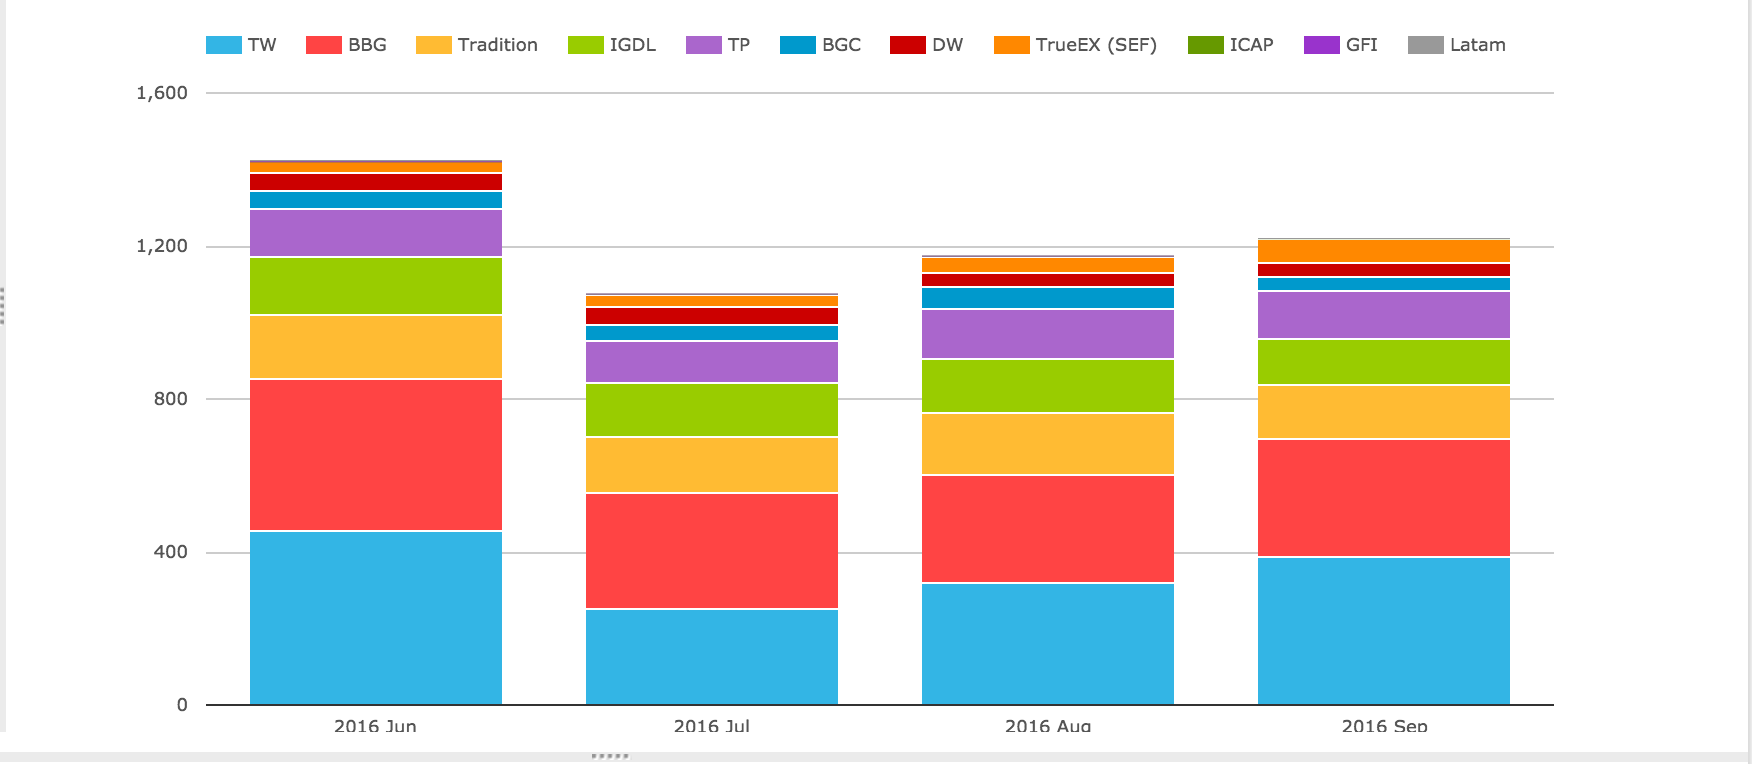
Showing that:
- August volume at $1.22 billion is higher than the $1.175 billion in August
- Tradeweb is on top, increasing its lead over Bloomberg from the prior month
- Tradition, Tullet and ICAP next, in that order
- TrueEX with a strong showing, much higher than prior months
- Dealerweb just above BGC
In gross notional terms $1.75 trillion of USD IRS traded On SEF in August.
From SDRView data above, we know that $1.16 trillion of price forming capped gross notional and $250 billion of capped compression and roll volumes was reported, making the understatement $340 billion, or put another way the SDR figure of $1.41 trillion understates by 24% the actual notional.
CCP Basis Spreads and Volumes
In SEFView we can isolate CME Cleared Swap volume at the major D2D SEFs (on the assumption that this is all CME–LCH Switch trade activity). Lets look at this for the past 4 months.
Showing:
- Overall volume in September was $38 billion, up from the Aug low
- But not back up to June and July
- Tradition maintains a healthy lead with 53% share in gross notional terms
- Tullets also with a stronger month
CME-LCH Basis Spreads themselves have crept up from the prior month, with 10Y at 2.75 bps up from 2.45 bps and 30Y at 3.90 bps up from 3.45 bps.
Global Cleared Volumes
Now onto CCPView to look at Global Cleared Swap Volumes for EUR, GBP, JPY & USD Swaps.
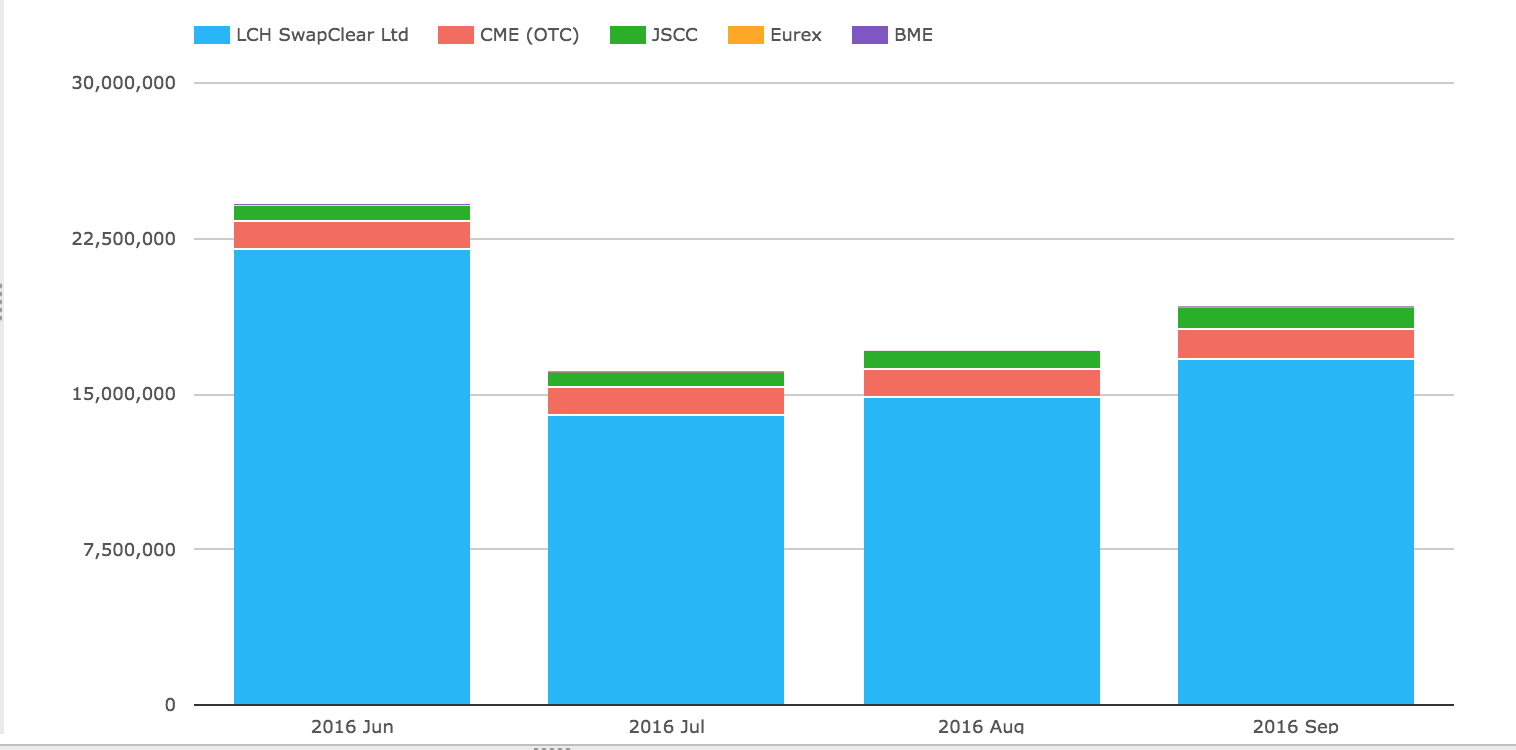
Showing:
- Overall Global Cleared Volumes are up in the month
- LCH SwapClear volume at $16.67 trillion, is up 12.5% from August
- CME volume at $1.5 trillion, is up 7%
- JSCC is above $1 trillion for the first time, and is up 21% (in usd terms)
- Eurex with $33 billion, is a little higher than the $28b in August
- BME we recently started publishing and starting to show volume in EUR Swaps each month
Asia and LatAm
Before we end lets look at some charts for Asian and LatAm currencies.
First the volume of AUD, HKD, SGD Swaps (including Vanilla, OIS, Basis, Zero Coupon).
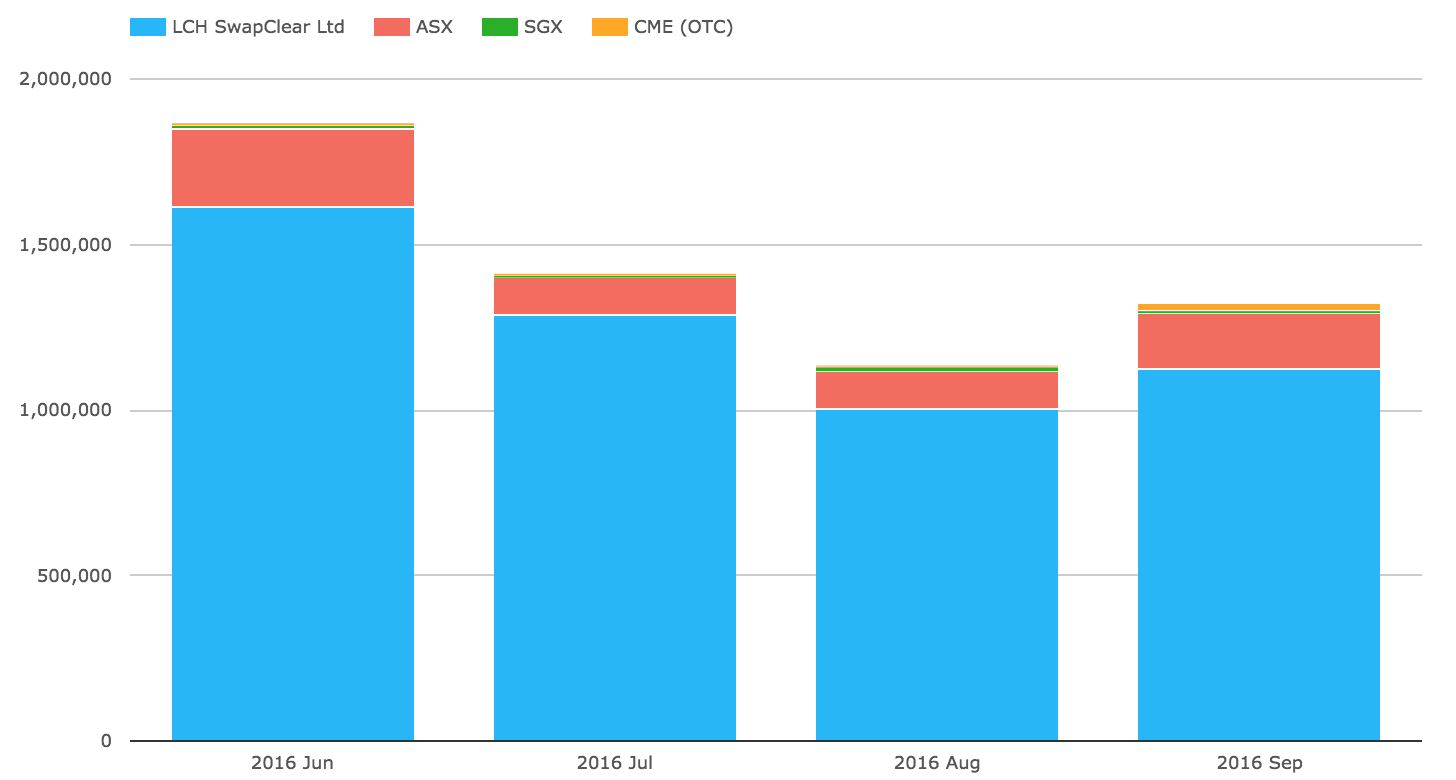
Showing:
- The down trend has been reversed
- LCH SwapClear up to $1.12 trillion from the $1.0 trillion in August
- ASX at $169 billion, up from $114 billion
- CME at $20 billion, up from $3.4 billion
- SGX at $7 billion, down from from $14 billion
Second the volume of MXN and BRL Swaps.
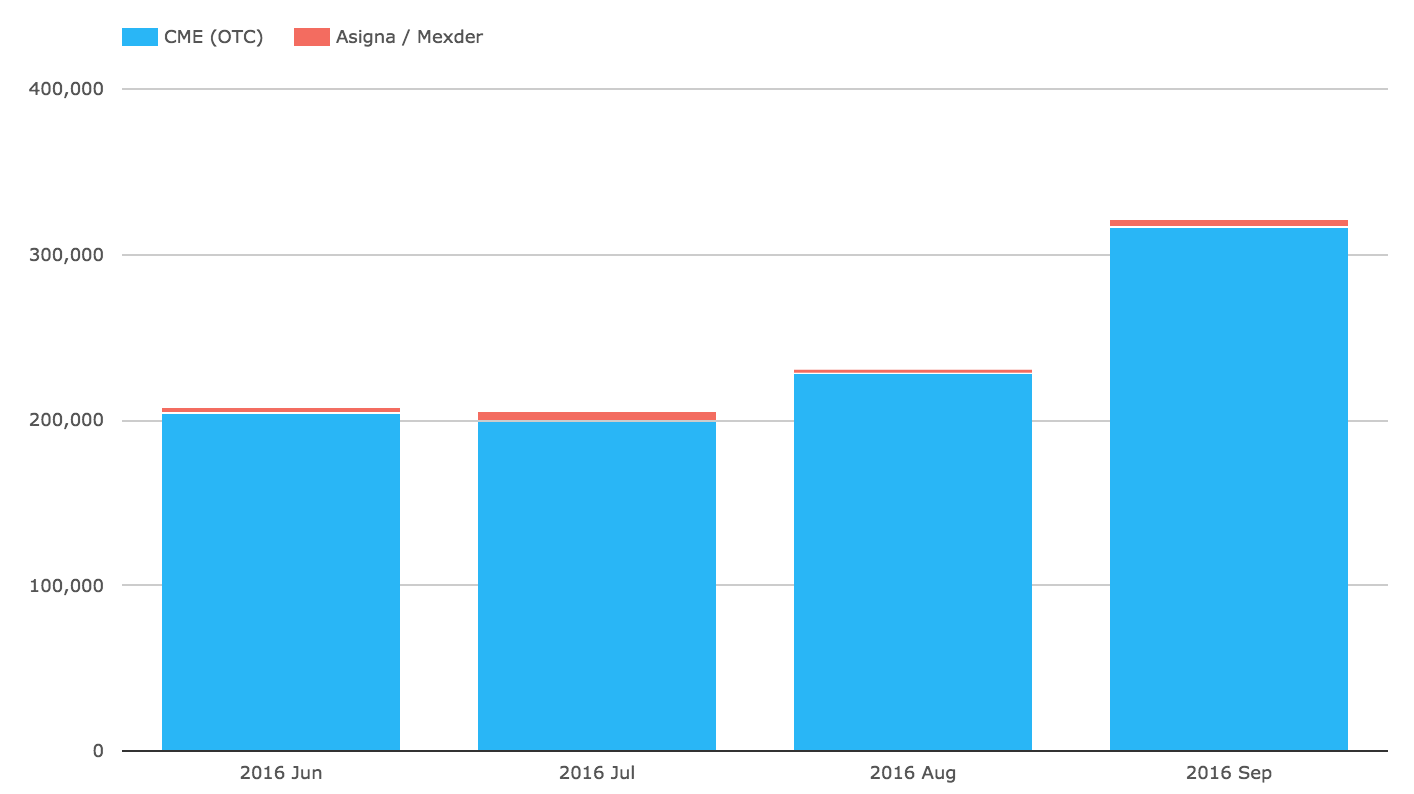
Showing:
- CME with $317 billion in September, up from $229b in August
- Asigna/Mexder at $4.7 billion up from $2.2 billion
That’s it for today.
Thanks for staying to the end.
Our Swaps review series is published monthly.
Thanks. Nice info. How do you identify the rolls? Do you look for swaps with IMM dates and matching notionals? (i.e. a sell of the September date, a buy of the December date, with the same notional and index?)
Hi David – we wrote a blog on this a while ago here:
https://www.clarusft.com/the-imm-roll-for-swaps-what-is-it-and-what-are-the-volumes/
In brief, we do this on a trade-by-trade basis looking for matching time-stamps, with matching notional/dv01 amounts among other matching criteria (tenor, index etc).