
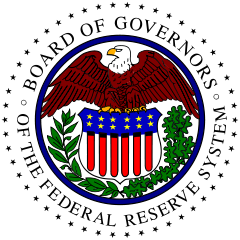
Like many of you, I was tuned into CNBC last Tuesday to keep an eye on what the Fed decided to do with rates. Perhaps like many others, I also had SDRView Professional up and running on my desktop to see how the swap market was behaving. Here is what the 5YR USD swap was doing up to and through the 2pm EST Fed announcement.
I found it interesting that rates began to taper off ahead of the announcement, but also striking that if you look at the 2pm (14:00) vertical line, there is a fair degree of white space on either side, with apparently nothing happening.
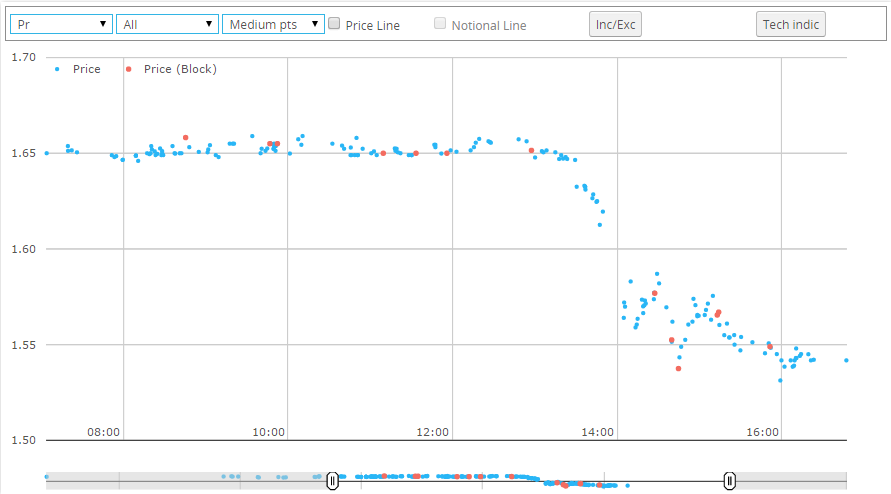
For good measure, the 10Yr. Showing the same pre-rate announcement tapering behavior, but better trading apparently through the 2pm announcement time (dots on either side). Also a fair degree of blocks executed around that time (in red dots):
I thought it worthwhile to benchmark this activity versus a “normal” day in the swaps market, as well as versus other Fed announcement days. Just how does the swap market typically behave?
The Metrics
Clearly in terms of price-action, the swap market does not typically move ~10bp over the course of any afternoon. However, it would also not be fair to label this atypical. So price action is explicitly not something I went to look at. Rather, I went to see if the time period before (and after) the fed announcement is typical in terms of:
- Trade Counts
- Block Trade Activity
- Average Trade Size
- Time gaps in trading activity
To benchmark the Fed-days, I had to decide what days to look at. I considered using the entire pre-Fed announcement week of data. But then I run the risk of muddying the analysis with perhaps Mondays and Fridays being typically slow days anyhow. I decided to pull trading activity on the same day in the prior week.
Extra Credit: Who knows why last weeks Fed announcement was on a Thursday instead of the usual Wednesday?
So my analysis includes “Fed-Days” of 17-Sep, 29-Jul, and 17-Jun. And “Normal” Benchmark days of 10-Sep, 22-Jul, and 10-Jun.
For all dates, I limited my universe to:
- 8am through 4pm EST
- USD, Fixed Float, Vanilla, Spot starting SA 3M Libor swaps
- Removed all swaps related to Compression, List, and Rolls. This leaves me with just the price-forming trades: Outrights, Spreadovers, Curves and Butterflies.
- On-SEF only. It’s quite encouraging to see that adding in Off-SEF activity does not add that many trades to the picture for this particular universe.
- I split up the data into time-chunks as well, to distinctly look at:
- 8am through 15 minutes prior to Fed announcement (eg 8:00am -1:45pm EST)
- The 15 minutes before and after the Fed (eg 1:45pm EST – 2:15pm EST)
- The rest of the day (eg 2:15pm – 4:00pm)
By way of example, for the most recent Fed-Day, I can see the following in terms of trade counts and trade sizes, across all tenors:
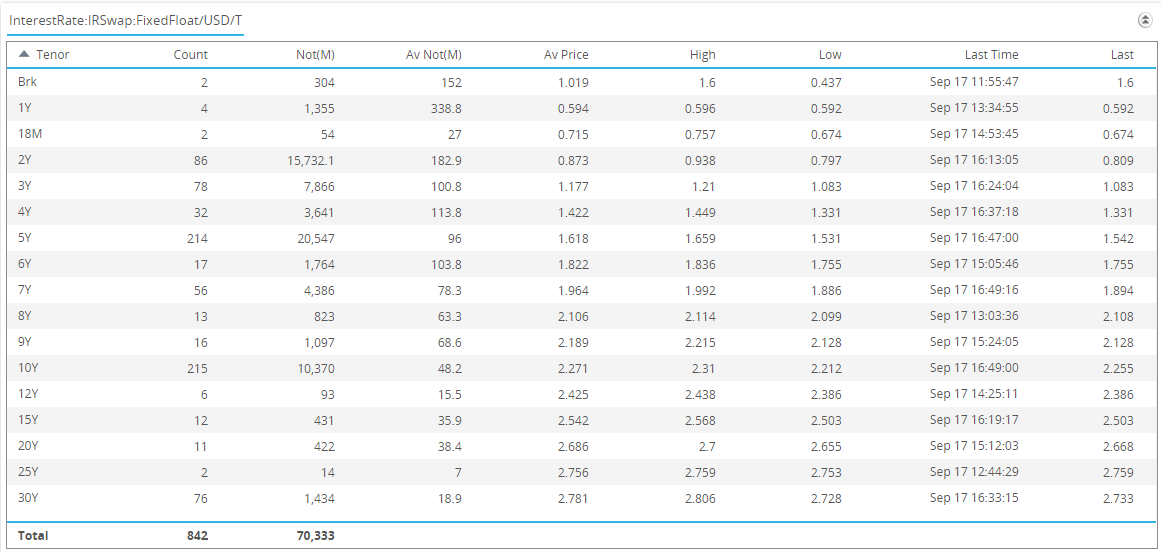
Which shows what we expect – that the most active tenors are the 2s, 5s, 7s, 10s and 30 year. So in a final attempt to limit my universe, I chose to only observe the most active ones – the 5yr, 10yr and 30yr swap tenors. In so doing, I changed my volume analysis to DV01 based (rather than notional based), so that we can speak about the activity in the same terms.
What is Normal
What might surprise non-swaps folks is that a “normal” day is not terribly active. There is no HFT, or guys repeatedly hitting their <RETURN> key putting through millions of trades. The normal days in my sample set revealed that for this universe of 5s, 10s and 30 year swaps, On-SEF, spot starting vanilla, price-forming trades, between the hours of 8am to 4pm EST, there were on average:
- 338 swaps traded per day
- 9% of those trades were block
- Average DV01 is ~45k
- A swap of this type traded roughly every 90 seconds. So if the guy next to you just traded a swap, it’s likely that nobody else has done anything for the past 3 minutes!
How Does a Fed Day Compare?
So below are my metrics that I compiled for “Normal Days” as well as my “Fed Days”:
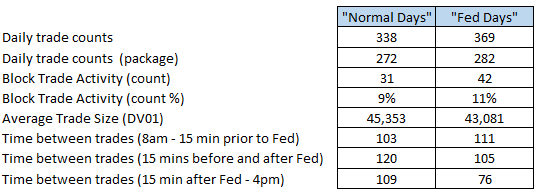
So with my small data set, this lets me conclude:
- Fed Days are indeed more active than most, by witness of the trade counts. But only slightly.
- Fed Days have slightly higher block trade count. Remember that this analysis was looking at On-SEF activity. For those of you that might consider On-SEF block an oxymoron, remember that many blocks are reported through the SEFs. My colleague Chris just reported on this earlier today.
- Only 338 such trades occur on normal days. And if you consider package transactions as 1 trade, that number drops to 272 (that include a 5, 10, or 30yr).
- The frequency of trading activity on normal days is fairly stable throughout the day as you would expect. We do, however, witness heavier activity going into the close on Fed Days. I should make clear that this is the amount of time, in seconds, between consecutive transactions, counting a package as 1 trade.
- On the larger “Fed Days” data set, I could not corroborate any “blank space” of long lags between trading activity around the Fed decision. Though in our one data point above (the 5 Year on 17-Sep) this seemed very evident.
Summary
I feel as though I have only scratched the surface here. If I had more time and appetite, I would:
- Use a larger “benchmark” data set
- Look at both average/normal Fed Days, and then individual Fed Days to spot any particularly odd dates
- I’d probably want to observe what happens off SEF as well
- Observe price action and liquidity around particular times of day
- Observe blocks and trade sizes in the different time windows before, during, and after the announcement
- I’d also be interested to look at swaption activity
Too much to observe really.
Alas, you can do this yourself on SDRView.
Let us know what you find!