I last looked at USD OIS Swap Volumes in August 2015 and given that there is talk of a second Federal Reserve rate hike in June or July, I thought it would be interesting to look at what has been happening to volumes.
First the highlights:
- USD OIS volumes are massively up and now comparable to USD IRS
- Mar-May 2016 volumes are up 130% in gross notional compared to Mar-May 2015
- $1.8 trillion gross notional was reported in May 2016 to US SDRs
- Due to capped notional rules, we estimate the actual notional as $2.3 trillion
- SEF data shows BGC gaining in May, ICAP gaining in April and together with Tullet dominating volumes
- Global Cleared Volumes show $4.8 trillion of USD OIS in May
- In April and May Global Cleared USD IRS volume was lower than USD OIS
Now all the details with charts, data and more.
USD OIS Swaps
In this article I will look specifically at USD OIS Swaps. These are short dated trades with a fixed leg and a float leg based on the Fed Funds Rate. USD FedFund Swaps, are a type of Basis Swap, which are longer-dated and FedFunds vs Libor.
Lets start by using SDRView to see USD IRD product volumes traded by US persons in May 2016.
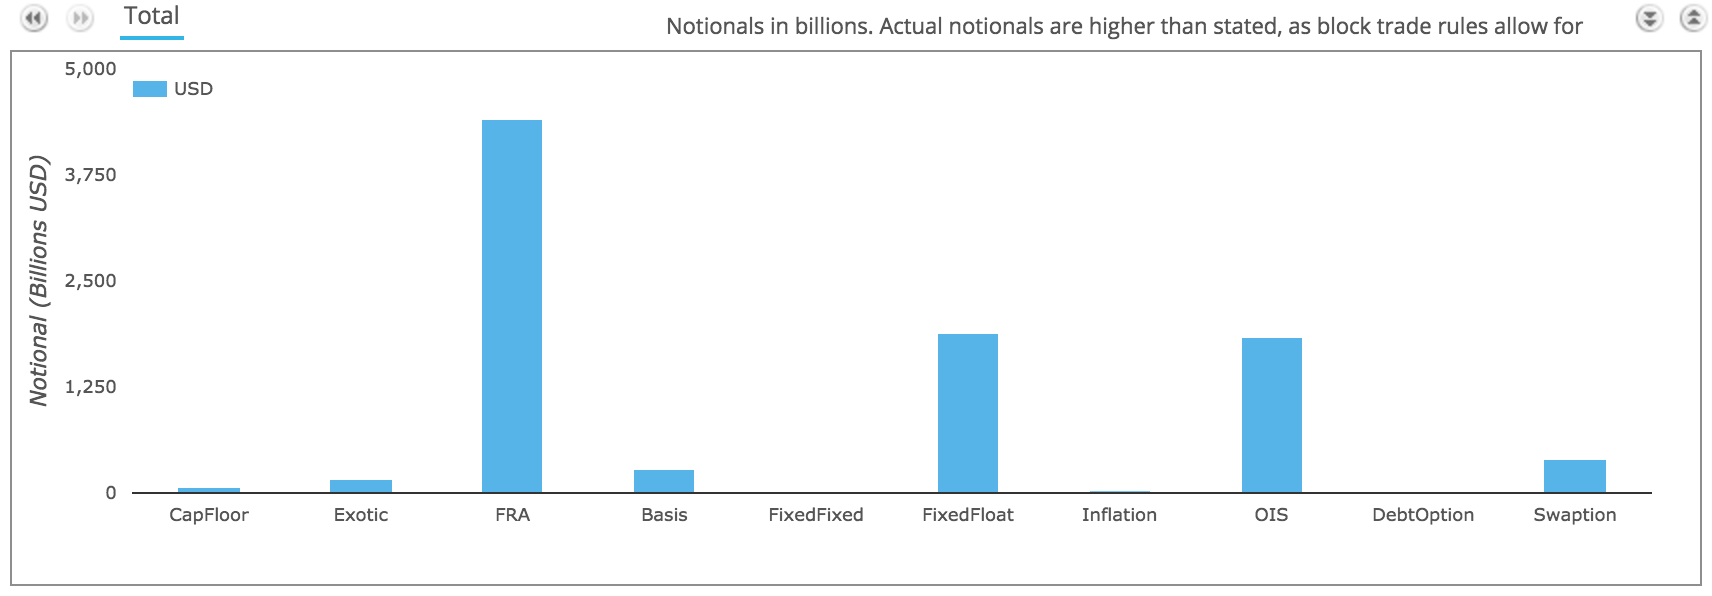
Showing that USD OIS volume in May 2016 was >$1.8 trillion gross notional, very similar to USD FixedFloat Swaps and certainly far higher than the >$900 billion figure we observed in July 2015.
Volume Trends
Now lets look at monthly volume in the past 3 months compared to a year earlier, first by trade count.
Showing that:
- Trade counts are significantly higher in 2016 vs 2015
- March 2015 had 888 trades compared to 1,103 in March 2016
- May 2015 had 562 trades compared to 1,212 in May 2016
- Quarterly volumes are up 72%
- Cleared Off SEF trades are the highest count each month
- (Recall that OIS Swaps are not Mandatory to be on a SEF)
- Uncleared Off SEF trade counts have increased the most
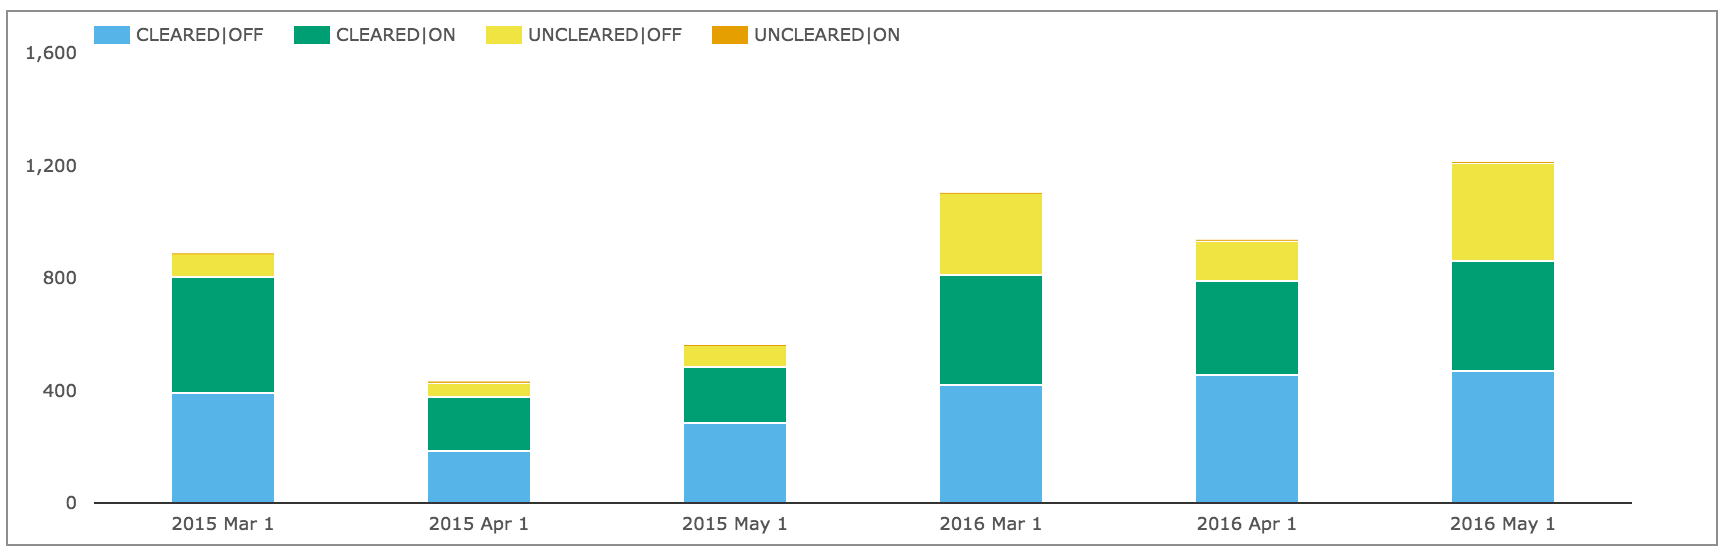
And next the same period but by gross notional.

Showing:
- An even more pronounced increase for each comparative month
- A Quarterly increase of 130%!
- Uncleared Off SEF is massively up at >$580 billion in May 2016
- Cleared Off SEF is up at > $610 billion in May 2016
- Cleared On SEF is up at > $635 billion in May 2016
And gross notional by week for the past 8 weeks.

Shows that the week starting 16 May saw massive volume, over three times the norm and Uncleared Off SEF in particular was huge.
How Much Bigger is the Market?
Now we know that Capped Notional rules means that these volumes are under-stated, so lets split the above figures by how much is Standard (Actual Notional) and how much Capped and do so for On SEF and Off SEF.
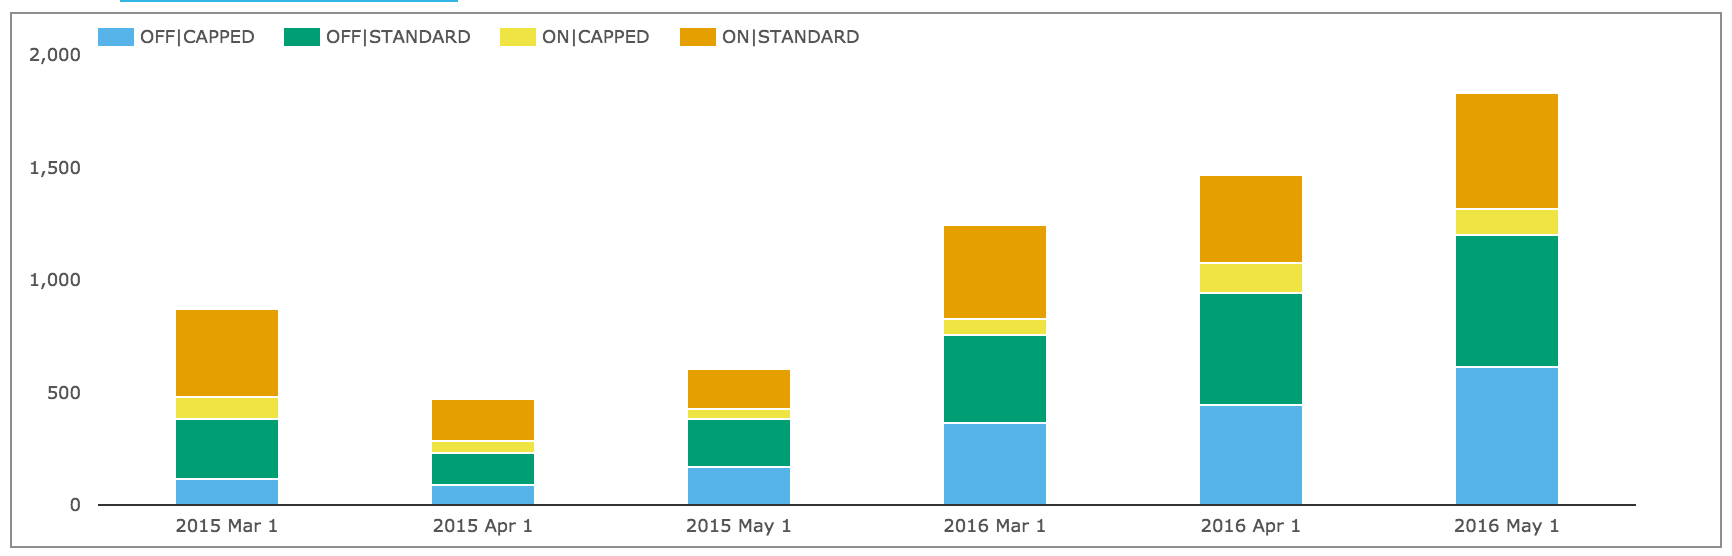
Showing that:
- Significant volume is Capped
- May 2016 Off SEF has $615b Capped vs $580b Standard (223 vs 593 trades)
- May 2016 On SEF has $124b Capped vs $510b Standard (44 vs 352 trades)
- The Off SEF Capped portion each month is much higher than the On SEF one
Is it possible for us to get a better estimate of the actual Notional traded?
Yes using SEFView, we know that $729 billion traded On SEF in May vs the $634 billion shown in SDR.
This is equivalent to saying that the $124b of Capped Notional was actually $219b of actual notional.
Using the same percentage for Off SEF, would mean increasing the Off SEF Capped $615b to $1.09trillion, meaning that we would estimate a total of $1.6 trillion traded Off SEF.
We can then estimate an overall total of $2.3 trillion in May 2016.
As the number of trades was 1212, we can say the average trade size was $1.9 billion!
Clearly a wholesale market with a few large trades between major financial firms.
Maturity Profile
It is also interesting to look at what maturities trade.
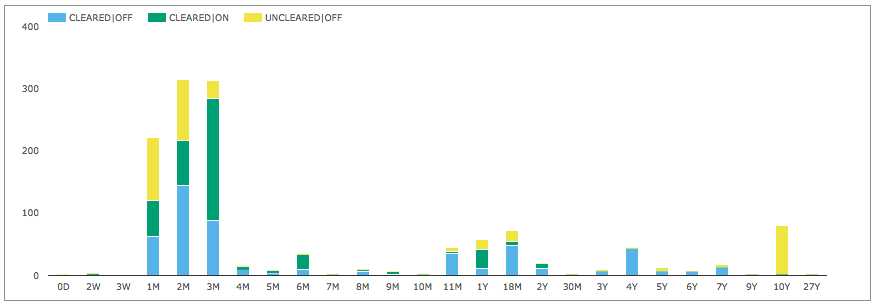
Showing that:
- 1M, 2M, 3M are by far the most common (with 300 trades each in May)
- 6M, 11M, 1Y, 18M and 4Y have between 35 and 70 trades each
- 10Y also has 80 trades, all Uncleared and Off SEF
SEF Market Share
Next lets turn to SEFView and look at SEF market share.
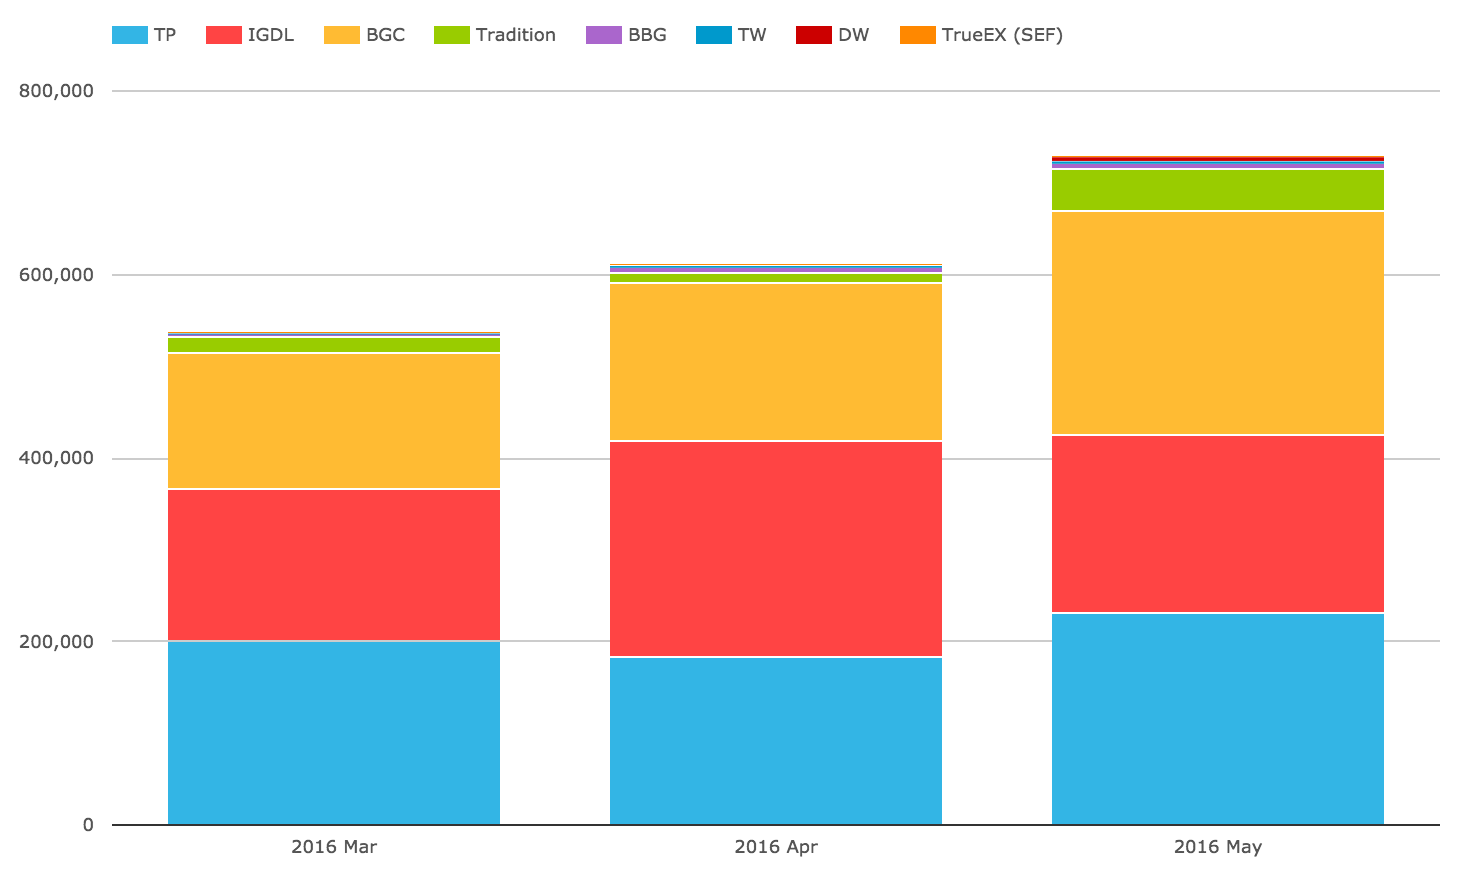
Showing that:
- BGC has gained share to be the largest in May
- ICAP has lost share in May
- Tullet, ICAP & BGC are the three leaders each with around 30% for the 3 months
- Tradition share in May is also up, but remains a distant fourth
Global OIS Swap Volume vs US
So far we have been looking specifically at US persons volume reported to US SDRs.
Lets see whether the same trend of increasing volumes is seen in Global Cleared Data
Using CCPView we can compare USD IRS and OIS Volumes for each month YTD at LCH SwapClear.
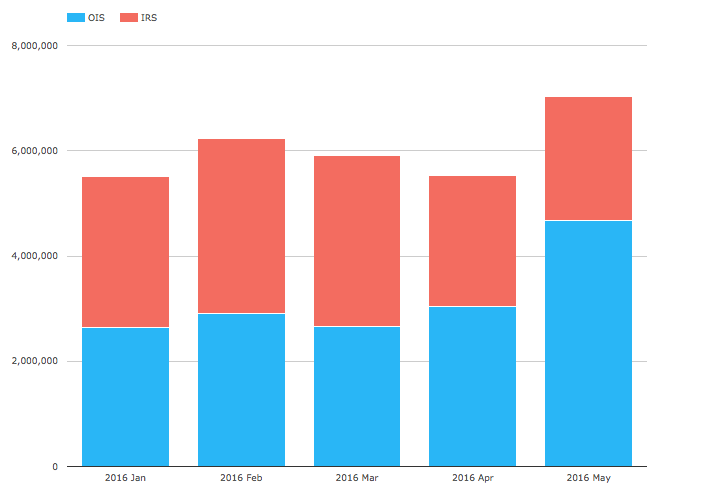
Showing that:
- In April and May for the first time USD OIS volume was higher than USD IRS
- May 2016 USD OIS volume was $4.8 trillion
- Up from the $2.8 trillion in Mar 2016
- While USD IRS volume has declined over the past 3 months
In summary the same trend of massively increasing USD OIS volumes in April and May that we see in US SDR data is also seen in Global Cleared Data. (Perhaps not surprising given the overlap in the datasets).
It will be interesting to see whether such high volumes continue into this month.
And whether the Fed raises interest rates the second time in June or July.