You’re likely aware that we’ve been the de-facto “janitors” of the SDR data. However, to date, our focus has been on swaps traded in Interest Rates, Credit, and FX. This week I turned to the world of equity derivatives to see what’s lurking in there.
To begin with, I had to grab some raw data. Out of the 4 SDRs that we monitor (DTCC, CME, ICE, and BSDR), the only place I could find any equity derivatives data is on DTCC. So I gathered up all of trades reported in March 2016, a mere 847,648 trades!
First thing I did was remove the 7,860 trades dated prior to March 1, 2016 (late reports, including 20 trades reported with execution timestamps in the year 1970!). This brings us down to just 839,788 trades.
Being the good janitors that we are, I next went on to observe the various data types:
- Trade (New Trade): 31.68%
- Terminations: 38.02%
- Increase: 26.32%
- Amendments: 3.97%
- Novations: 0.01%
For today’s analysis, I don’t really care about terminations and other post-trade data, I only want to see “New Trade” activity. This means I get to delete 68% of the records – and back down to a more manageable 266,045 trade records.
Next up, let’s look at the Cancellations and clean up the cancel & replace garbage. Of the 266,045 Equity Derivatives that we’re playing with:
- New – 80 %
- Cancel – 12 %
- Correct – 8 %
We need to be careful here. First, I removed all “NEW” and “CORRECT” trades that had been cancelled by a later report. Then I remove the CANCEL messages. This leaves us with just those “NEW” and “CORRECT” trades that are currently unique. Great, now we are down to just 203,285 trades, and this should be the universe of new equity derivative swaps dealt in March.
HEADLINE STATISTICS
Let’s look at some headline Stats after doing this first round of culling:
- No Trades flagged as Block
- 38 Trades flagged as Cleared. I do recall a press release about OCC clearing variance swaps, but I’ve confirmed that is not happening, so not sure what these are.
- Collateralization:
- PC (Partly Collateralized) – 51 %
- FC (Fully Collateralized) – 22 %
- UC (Uncollateralized) – 16 %
- OC (Other?) – 11 %
- End User Exception:
- Blank – 87 %
- No – 12 %
- Yes – 0 % (only 7 trades)
- Indication of Price Effecting Term. In other words “There’s some stuff we haven’t told you about that you’d need to price this trade):
- No – 98.5 % (this is encouraging)
- Yes – 1.5 %
- SEF Executed:
- Off – 99.7 %
- On – 0.2 % (seems about right from what we see in SEF data from the IDB’s)
- Blank – 0 % (only 9 trades)
So what currency are all of these equity derivatives denominated in?
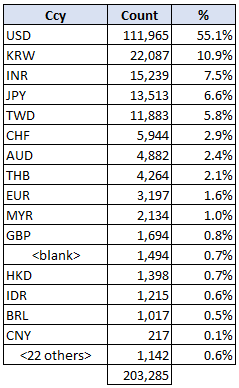
So just slightly more than ½ the trades were in USD. The next largest amount was in Korean Won, which is an active equity derivatives market on their own shores. There were some equity derivatives denominated in currencies that I did not immediately recognize; of note, there were 6 trades in the Pakistani Rupee, and 4 in the Uganda Shilling!
Let’s also not worry about the 1,494 trades that do not have a currency – whoops!
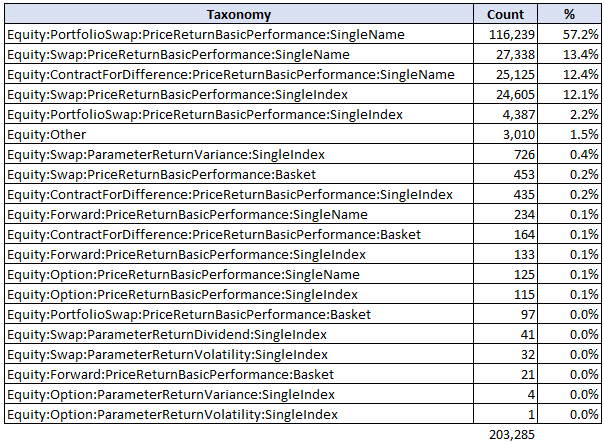
PRODUCT TYPES
So the more interesting aspect here is what kind of trades are reported. Here is a breakdown of the Taxonomies (product classifications) within the Equity data:
If those taxonomies don’t make much sense to you, you’re not alone. At least I’m with you. Luckily, ISDA has a decent description of some of the taxonomies here.
Generally speaking, the translation seems to be:
- Swap:PriceReturnBasicPerformance – Standard Total Return swap, so one side pays the return on the asset(s) vs some interest payment(s). Either on a single name equity, an index, or a basket.
- PortfolioSwap:PriceReturnsBasicPerformance – Standard TRS on a basket of equities. It’s unclear to me how a “PortfolioSwap” on single names is different to a “Swap” on a basket.
- ContractForDifference – CFDs. Which are more popular overseas due to lack of taxes aka “betting”, leverage, 24 hour trading, etc.
- Forwards – Hmm, I presume akin to bullet swaps or CFD?
- ParameterReturnVariance or ParameterReturnVolatility – Variance or volatility swaps on a tradable index or single name
- “Other” – The mind boggles – perhaps a wedding cake on Mars.
CAN WE MAKE SENSE OUT OF ANY OF IT
Looking at the data, I was drawn to the “Single Index” data. Primary reason being the Single Name data gets massive, with thousands of underlying names; whereas for indices, I can make out some common standards such as the S&P 500 index.
So if I look at the top three Single Index activity, I need to choose between:
- Swap:PriceReturnBasicPerformance:SingleIndex – (The index future lookalikes) – 24,605 trades
- PortfolioSwap:PriceReturnBasicPerformance:SingleIndex – (Surely not a basket of indices right?) – 4,387 trades
- Swap:ParameterReturnVariance:SingleIndex – 726 trades
It turns out, the cleanest and most manageable data set is the “Swap:ParameterReturnVariance:SingleIndex” – aka Variance Swaps. So let’s look at those, and walk before we run.
WHAT IS A VARIANCE SWAP
A variance swap is a pure play on volatility. Two parties agree to exchange a future payment based upon the actual (realized) volatility over a period of time.
For example, if implied 1M volatility in the S&P 500 is 15%, and I think the actual realized volatility will be higher, I can enter into a variance swap struck at 15. If the actual observed volatility over the next month ends up being 20%, I make money on the difference (20 – 15).
More sophisticated readers will see that I have mixed the terms variance and volatility there for convenience. The payout of a variance swap is actually based upon – wait for it – the variance. So to be clear, we need to remind ourselves that Volatility (σ) is a measure of the standard deviation, while Variance (σ2) is the square of volatility.
Some quick highlights of variance swaps:
- Variance swaps typically have a notional amount quoted in approximate Vega terms (a dollar value per volatility point). For example, 100,000 USD vega notional.
- Given any strike (quote in volatility, eg 15%), you can determine the variance notional:
- Variance Amount = Vega Notional / Strike*2
- The payout at the end of the period is:
- Payout = Variance Amount * ( Observed σ2 – Strike σ2 ).
Of course, both parties need to determine and agree the observed variance using official daily closing prices in order to determine the final observed variance.
If you want to get more under the hood, here is the JP Morgan document I referenced for a refresher.
LET’S SEE SOME REAL TRADES
So let’s go back to our 726 variance swap trades in march 2016, and see if we can make sense of them. For starters, here are the indices we see trades against:
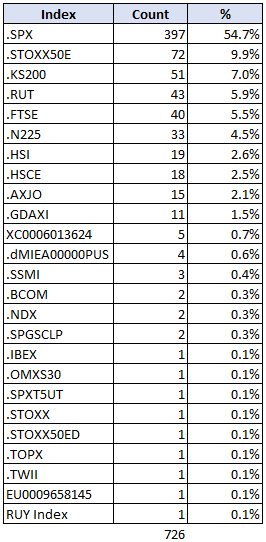
726 trades in the month of March works out to be 33 trades per day. In the S&P index, the 397 trades arrives at a figure of 18 trades per day. Not bad.
As is typical with SDR trade reporting, the data is all over the place:
- The “PRICE_NOTATION” field sometimes shows the strike in volatility (eg 20), sometimes in variance (eg 400), and sometimes it is quoted as a fraction (eg 0.04).
- The “ROUNDED_NOTIONAL_2” field sometimes shows the variance notional, but sometimes that is blank, or sometimes it is 2 or 3 times larger than the Vega notional (but then what would that be?)
Alas, after all of the scrubbing and data enrichment, we get to a pretty clean set of data. Here is a sample ticker of the cleansed data:
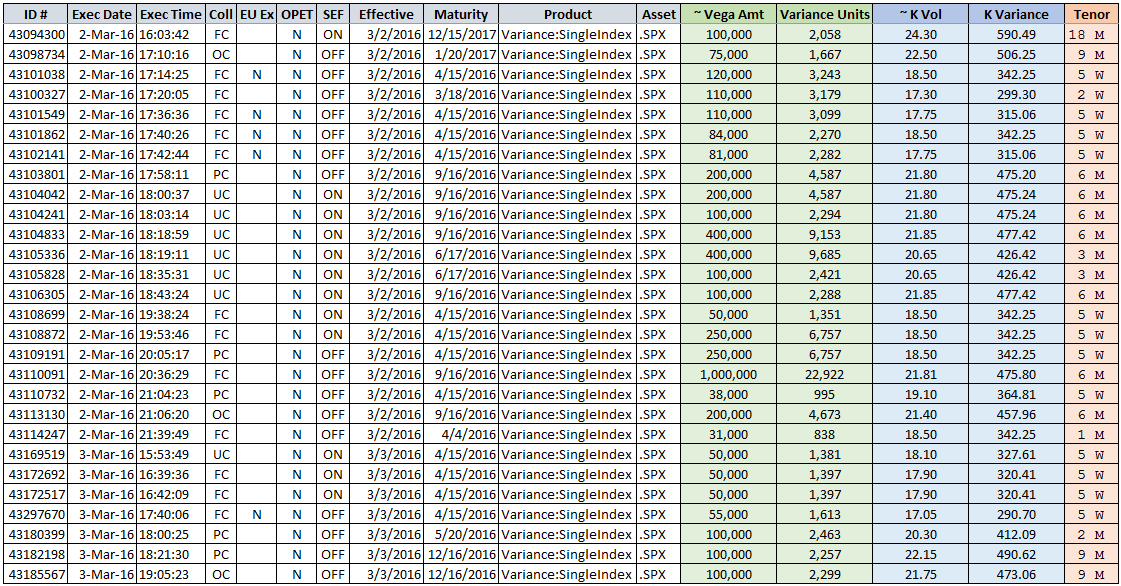
Some help on the fields:
- ID: Trade ID from the SDR Source (DTCC in this case)
- Coll: Collateralization status (Fully, partly, other)
- EU Ex: End User Exception – presumably the client here is exempt from something (perhaps clearing, if these were clearable)
- OPET: Other Price Effecting Term – When this is set to “Y”, it means there is some other data element the reporting party is not telling you that would impact the price. Luckily, only 7 of the 397 S&P Variance swaps in our data set are flagged as “Y”.
- SEF: On or Off SEF venue. My gut tells me that most variance swaps on SEF are on the IDBs, and hence I might suggest this flag could tell us that it is an inter-dealer trade.
- ~Vega Amt: The approximate Vega Notional
- Variance Units: The notional in terms of variance
- ~K Vol: The strike, in terms of Vol
- K Variance: The strike, in terms of Variance
- Tenor: A broad-brush attempt to categorize trades into a Tenor for some aggregation
FRUITS OF OUR LABOR
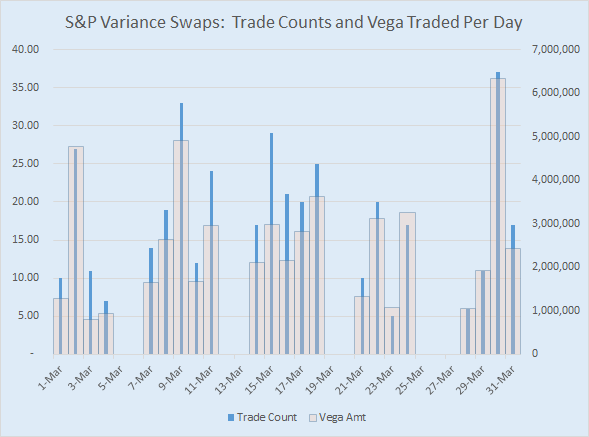
So now we get to do some nice aggregation. For starters, how about asking how many trades are dealt each day, and average trade size:
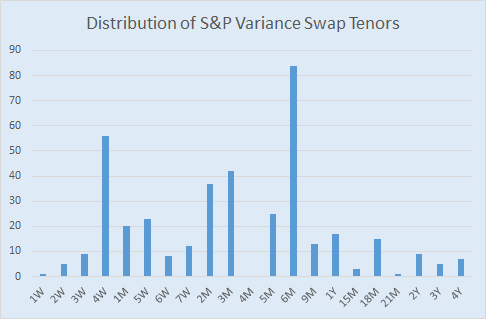
And how about which tenors trade:
So:
- Average Trade count per day: 18
- Largest Trade count per day: 37
- Minimum Trade count per day: 5
- Average Vega notional: roughly 143,000
- Largest Vega Notional: 1,000,000
- Minimum Vega Notional: 1,000 (this seems low)
Also:
- Shortest Dated swap: 9 days
- Longest Dated swap: nearly 5 years
- Most active tenor: 6M (84 trades)
As a quick sanity check, we can also throw together average strikes (volatility) over the course of the month:
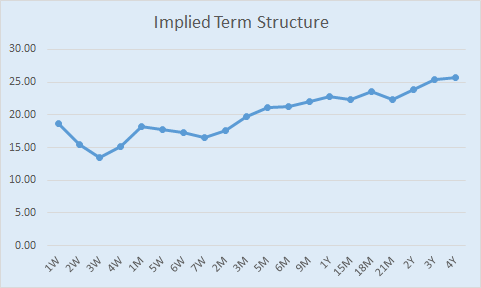
Granted this term structure is computed from prices observed over an entire month, but I thought it might at least demonstrate we’re on the right track. The structure is inverted from what I had expected (would have expected short term vol to be higher) but then again I might be guilty of thinking in terms of implied vol rather than realized vol.
And lastly, let’s take our most active tenor (6M) and look at its price history over the course of March. This is 84 trades:
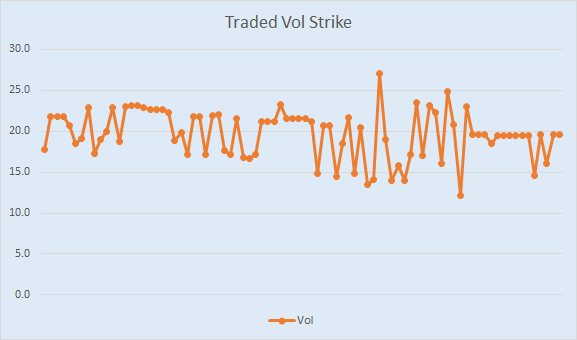
Hmm, this seems to say that S&P 500 vol traded down over the course of the month. OK I’d believe that. But I am a bit suspicious of the large variance (excuse the confusion) in the prices. Some of this is likely due to the large “broad” brush I have applied to grouping trades into tenors (For example I’ve combined both 170 and 200 day trades into “6M” in my sample).
It’s a decent first step.
SUMMARY
We’ll have to leave it there for today. Few things I’ve learned:
- There is some valuable information in the equity derivatives data.
- Like many asset classes on the SDR, the data can be very murky. It takes a trained data janitor to get to the good stuff.
- We’ve only examined ~400 of the ~850,000 equity derivatives trades done in the month of March. This really is just the tip of the iceberg!
Bonus Question: I know we looked mostly at Indices, but why are there Single Name Equity swaps on the (CFTC) SDR in the first place? Don’t they belong on the upcoming (SEC) SBSDR? I don’t know the answer – so please let us know.
And as always, get in touch with any of your comments or suggestions.