In this article I will look at Swap Execution Facility (SEF) volumes and market share in 2015 for Credit, FX and Interest Rate Derivative asset classes.
Clarus SEFView collects daily volumes published by each SEF and normalises this data to allow meaningful comparison and determination of market share statistics. I will use this to look at 2015 monthly volumes.
The highlights:
- CRD volume is dominated by Bloomberg with 73% share
- FX NDF, D2D is 94% and D2C 6%
- FX NDF, D2D is led by ICAP with 33% and D2C by Reuters with 57%
- FX Options is led by BGC with 36%
- IRD, Bloomberg leads with 31% and then Tradeweb+Dealerweb with 22%
- IRD, SEF Compression is up with Tradeweb, TrueEx and Bloomberg
- IRD, CME Switch trades, Tradition leads with 49%
Onto the data and details.
CRD Volumes and Share
Lets start with Credit volumes by currency for each month.
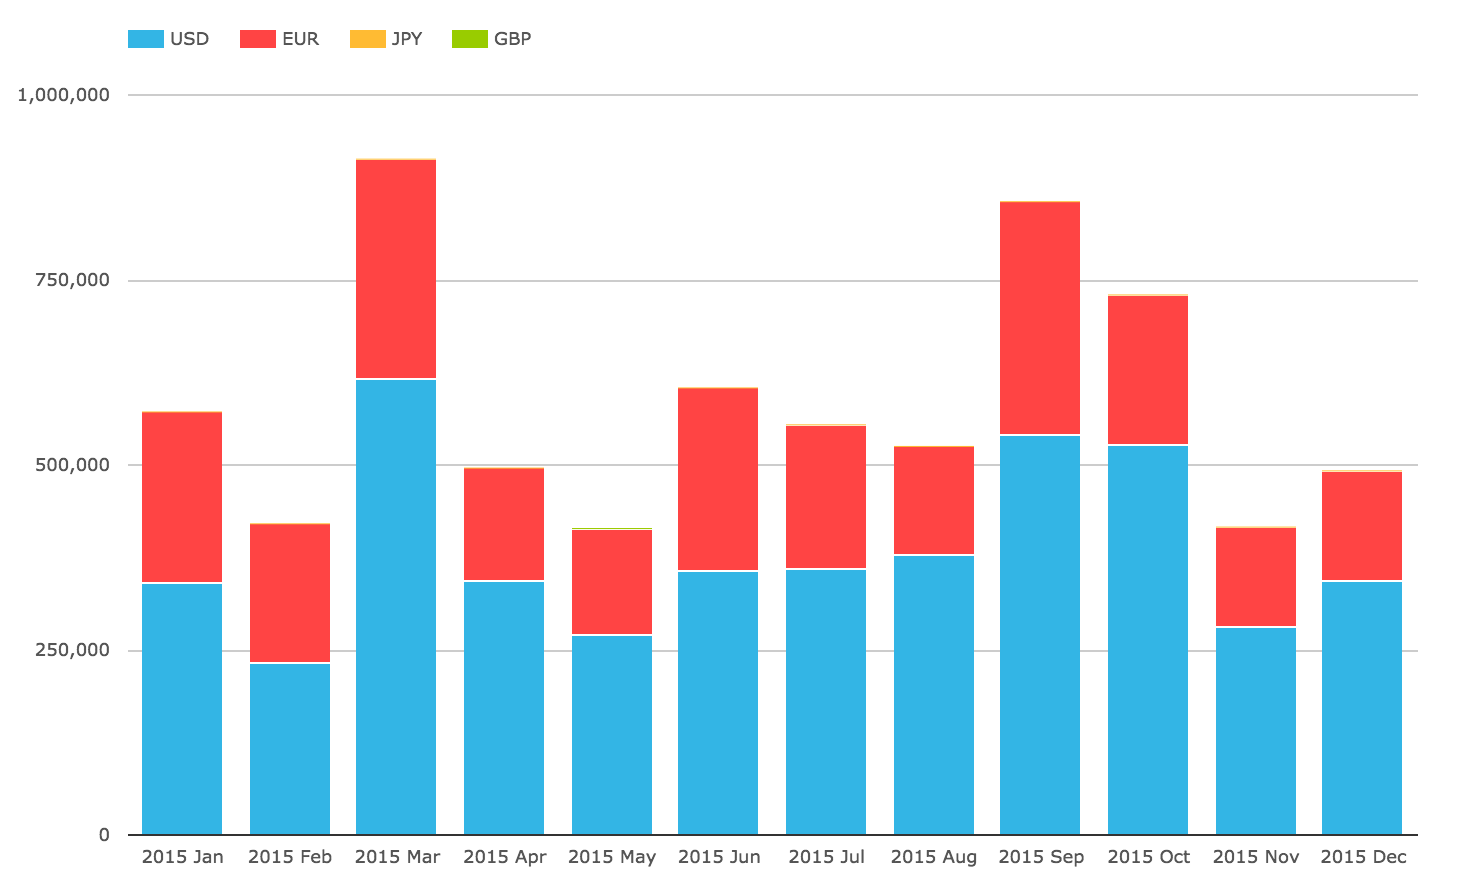
Showing that:
- USD is the largest (mainly CDX.NA.IG, CDX.NA.HY, CDX.EM)
- EUR is next (mainly of iTraxxEurope and iTraxxEuropeCrossOver)
- JPY and GBP are negligible
- March and Sep/Oct were the highest volume months
- Driven by the Series Rolls in March and October
Next lets look at a chart of percent market share for SEFs by month.
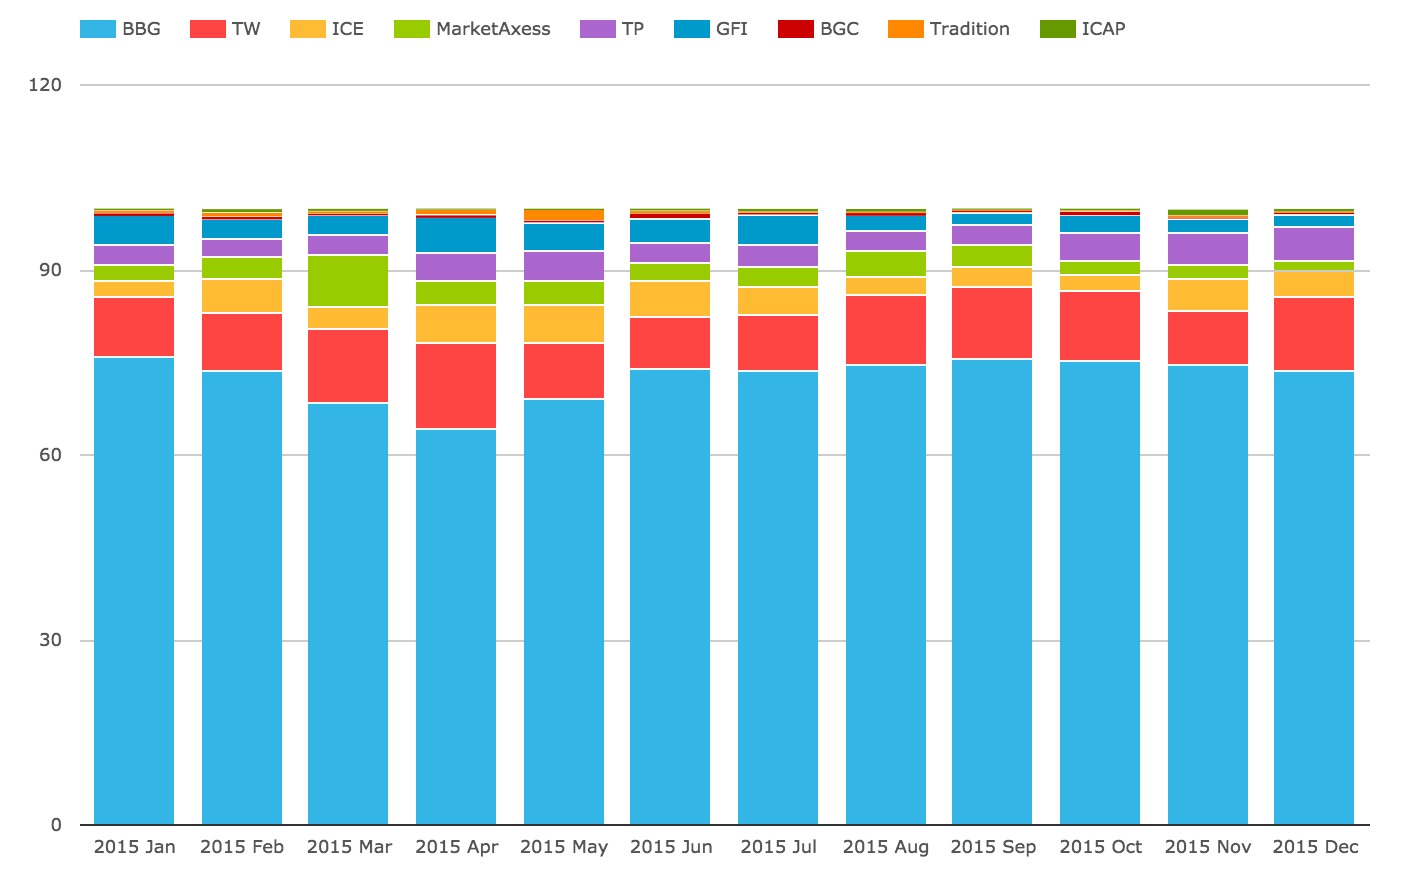
Showing that:
- BBG retains a commanding share of 73% for the year
- Tradeweb is next with 11%
- ICE at 4.2% and MarketAxess at 3.9% for the year
- MarketAxess share is lower in Q4 than prior quarters
- Tullet at 3.8% share for the year is higher in Q4 than prior quarters
- GFI at 3.4% share for the year is lower in Q4 than prior quarters
- All others are 1.2% combined share
Thats it for CRD.
FXD Volumes and Share
Lets now look at FXD volumes by month and product type.
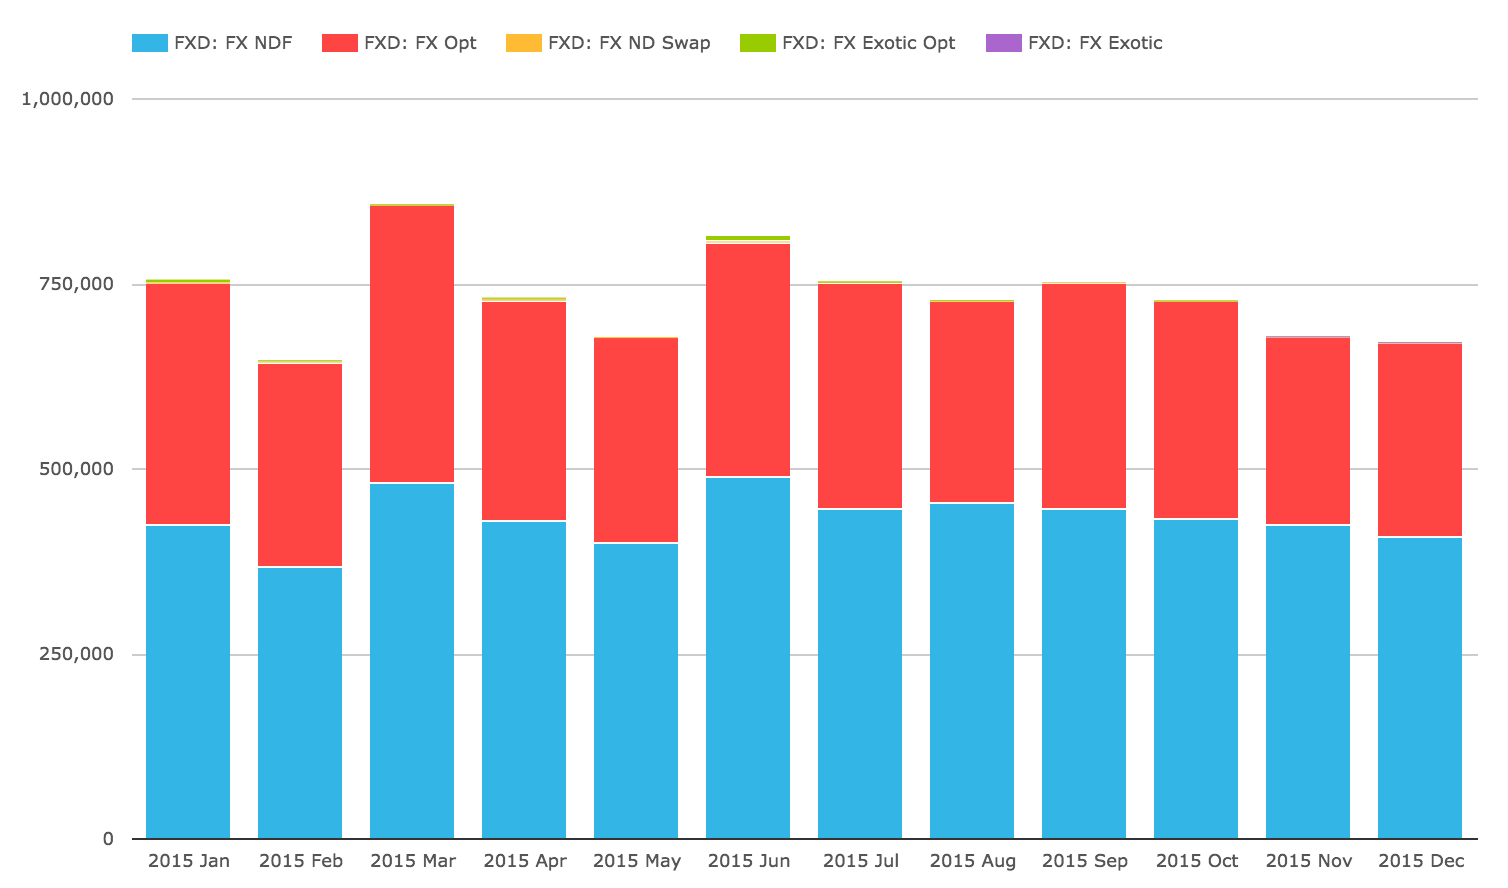
Showing that:
- Non-Deliverable Forwards (NDF) are the largest volume product with 60%
- FX Options (FXO) are next with 40%
- Others are comparatively insignificant
NDF volumes are dominated by D2D SEFs with 94% vs 6% for D2C.
So lets first chart NDF percent market share for D2D SEFs by month.
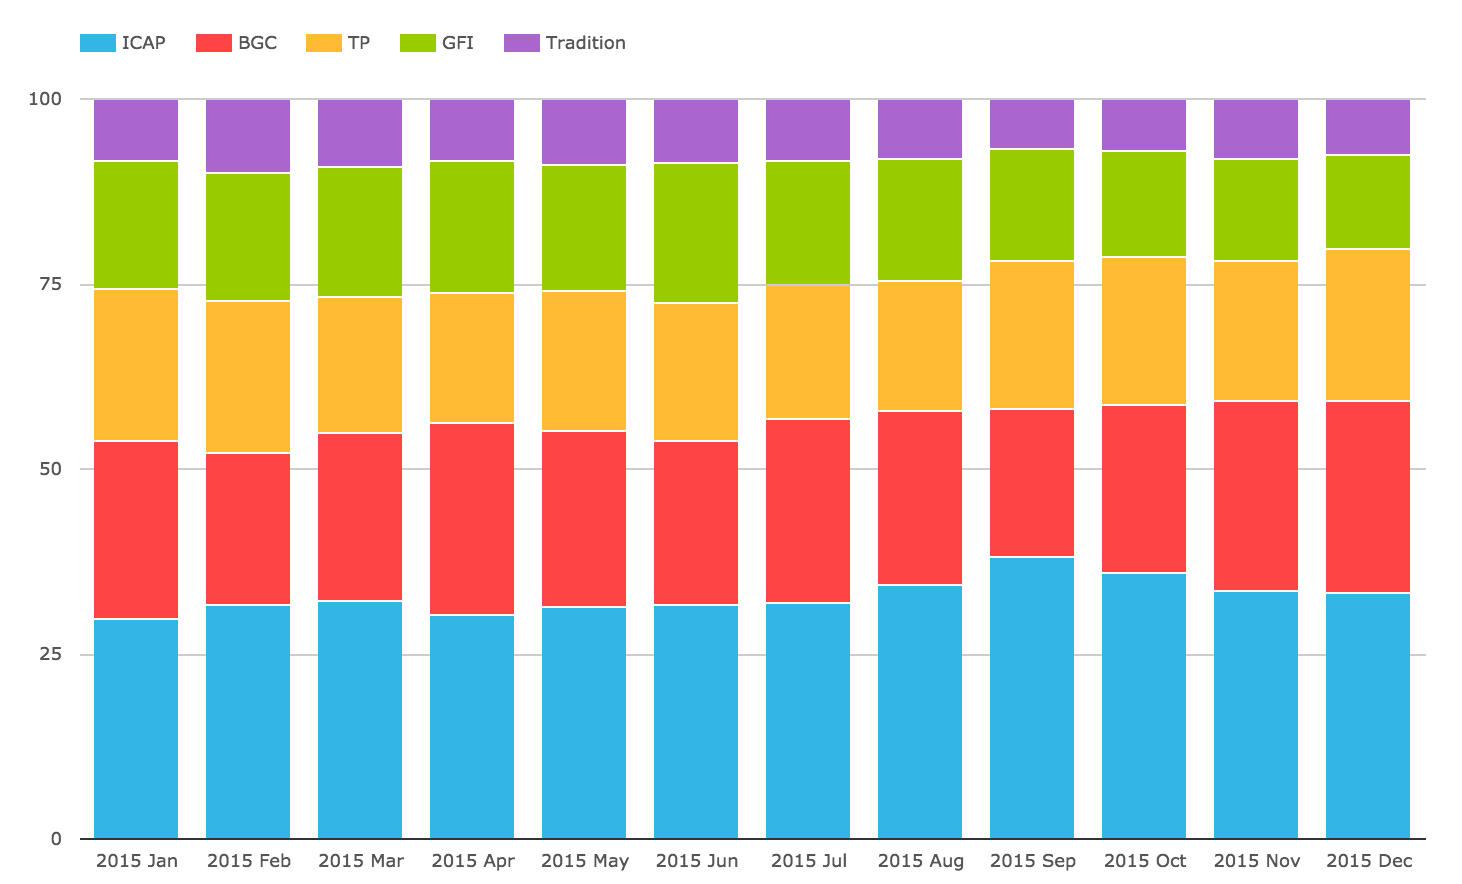
Showing:
- ICAP with the largest share at 32.8%
- BGC next with 23.5%
- Tullet with 19.1%
- GFI with 16.4%
- Tradition with 8.2%
- GFI losing share from July onwards, down to 12.8% in December
- With both ICAP and BGC gaining this
We know certain SEFs have distinct strengths in LatAm, Asian or European currency pairs, but will leave that to those of you interested to check yourself in SEFView.
Next a chart of NDF percent market share for D2C SEFs by month.
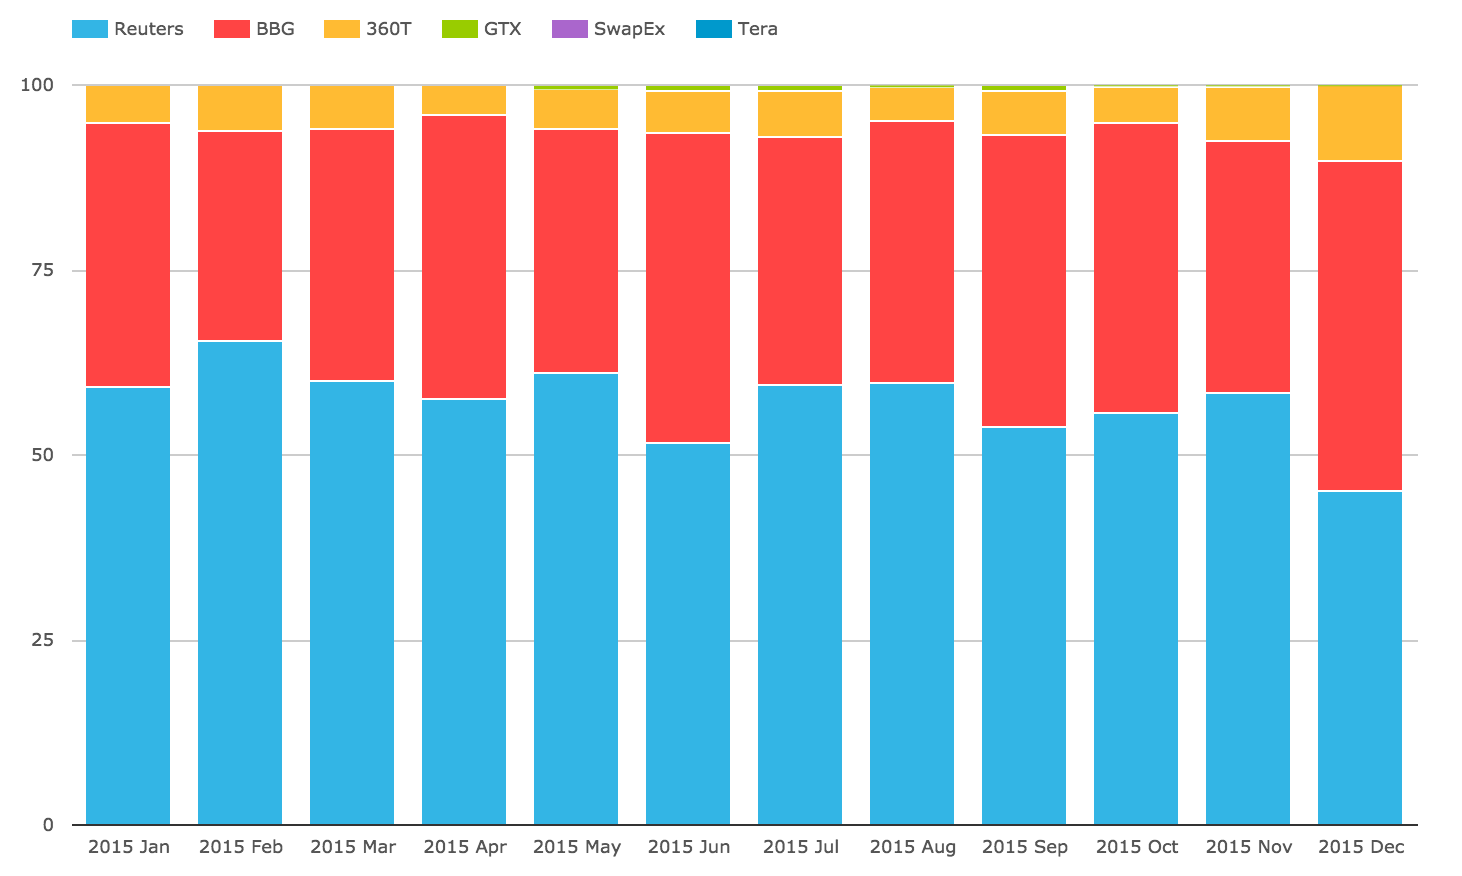
Showing:
- Reuters with the largest share at 57.2% for the year
- Bloomberg next with 36.6% for the year
- 360T with 5.9%
- Some variation in share month on month, but no clear trend
- Remaining SEFs have less than 1% combined
FXO volumes are dominated by D2D SEFs with 99% vs 1% for D2C, so lets just chart FXO percent market share for all SEFs by month.
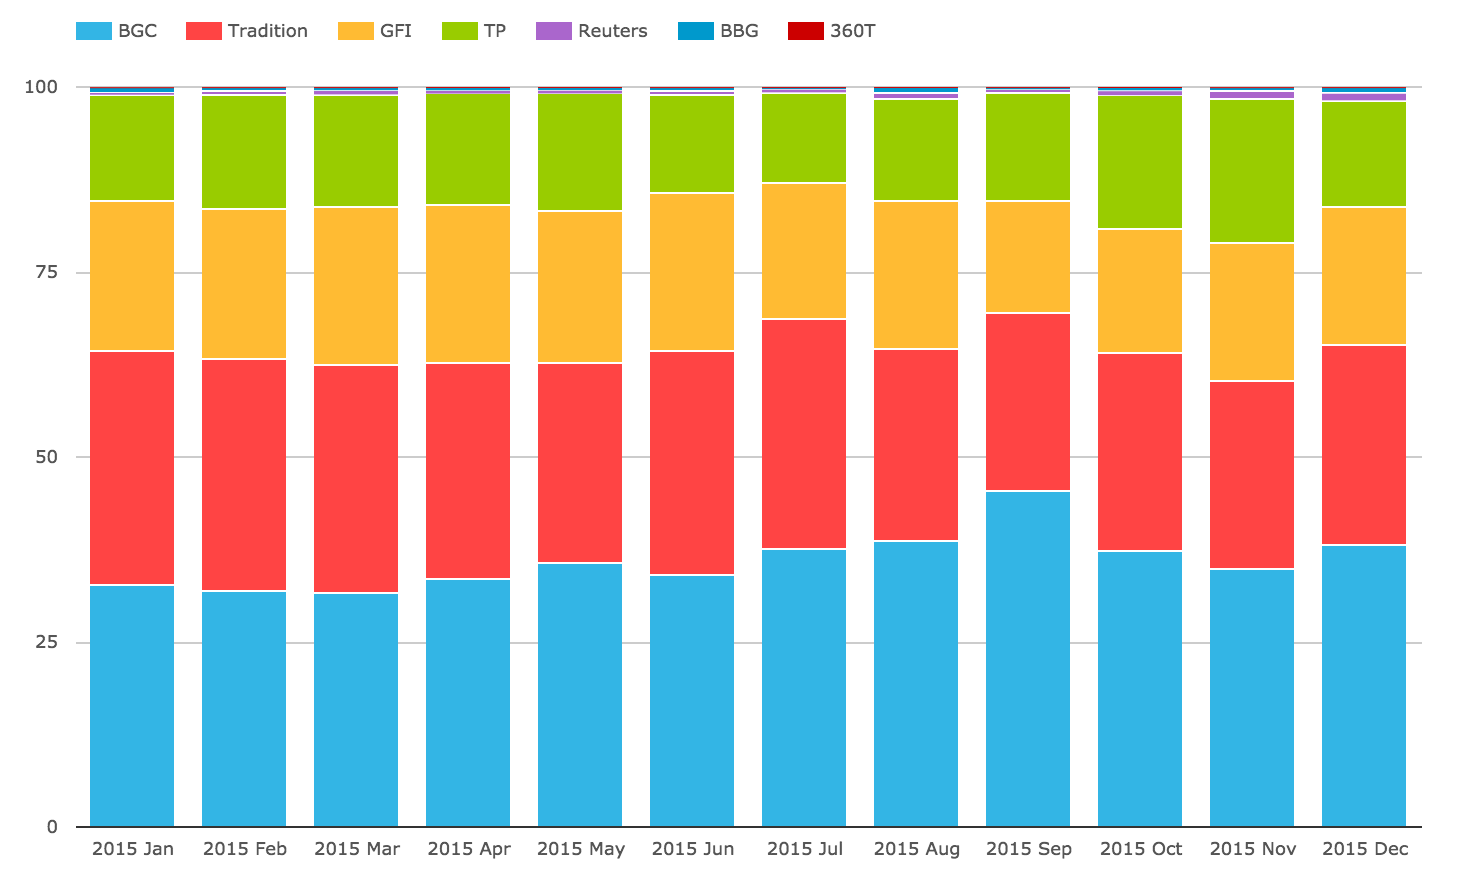
Showing:
- BGC with the largest share at 35.8% for the year
- BGC increasing its share over the year, up to 37% in Q4 from 32% in Q1
- Tradition next with 28.5% for the year, down to 26% in Q4 from 31.3% in Q1
- GFI with 19.5% for the the year, down to 18% in Q4 from 20.5% in Q1
- Tullet with 15%
- Remaining SEFs have 1%
Thats it for FXD.
IRD Volumes and Share
Lets now turn to the largest asset class IRD and start with a chart of gross notional by month by product type (excluding FRAs and Futures).
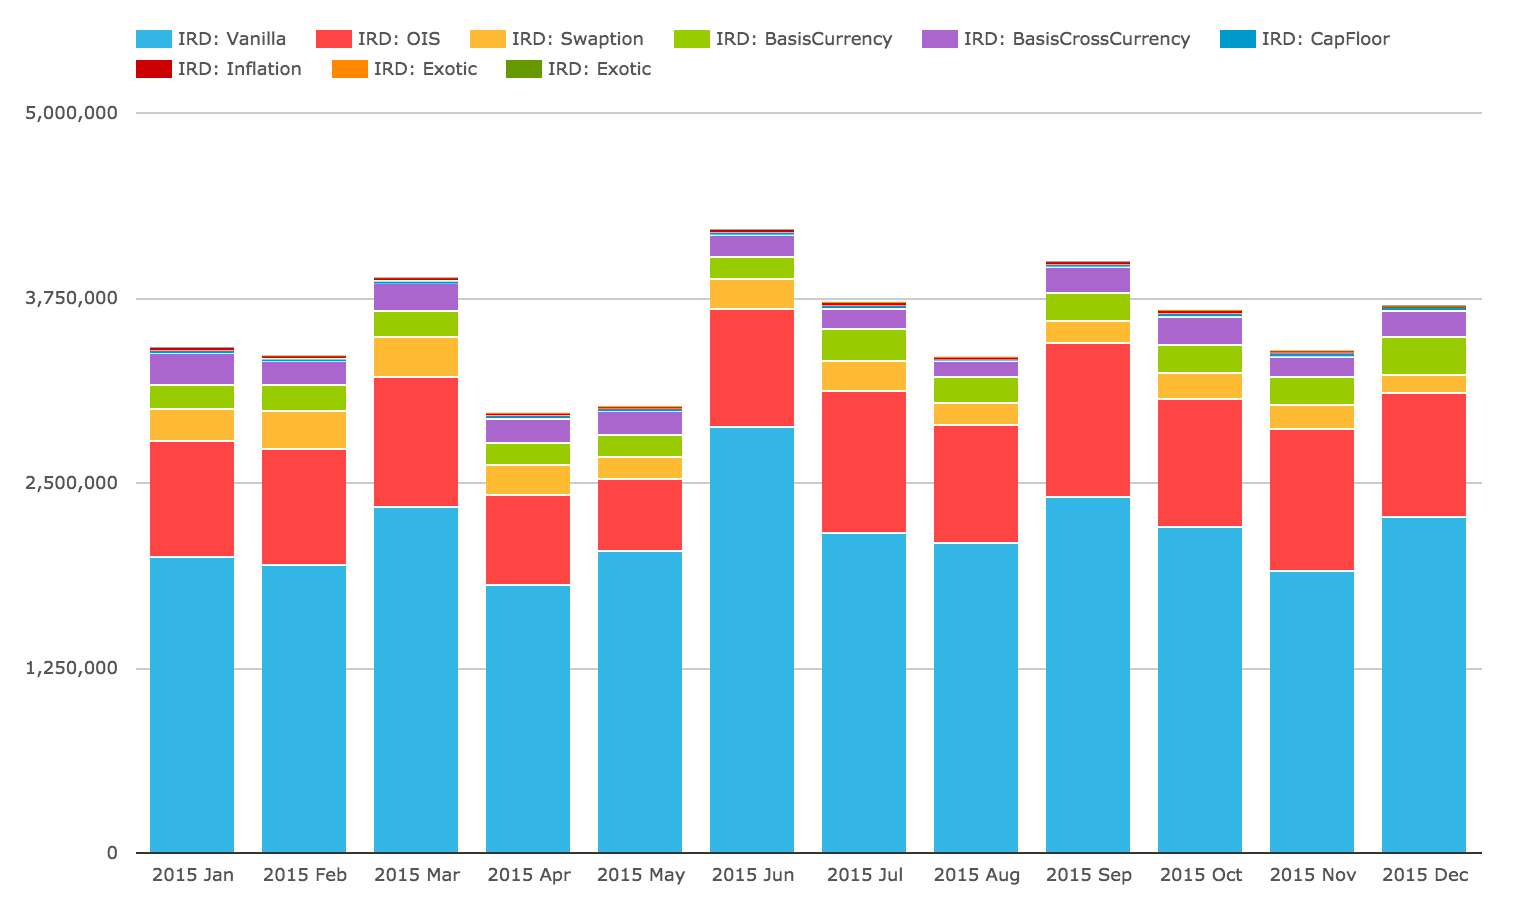
Showing that:
- June was the highest volume month, followed by September
- Vanilla IRS is the largest product
- OIS and Basis Swaps are the next
- Followed by Swaptions
Lets look at SEF Market Share in IRS including Vanilla, Basis and OIS Swaps in USD, EUR, GBP by DV01 (in USD millions) by month.
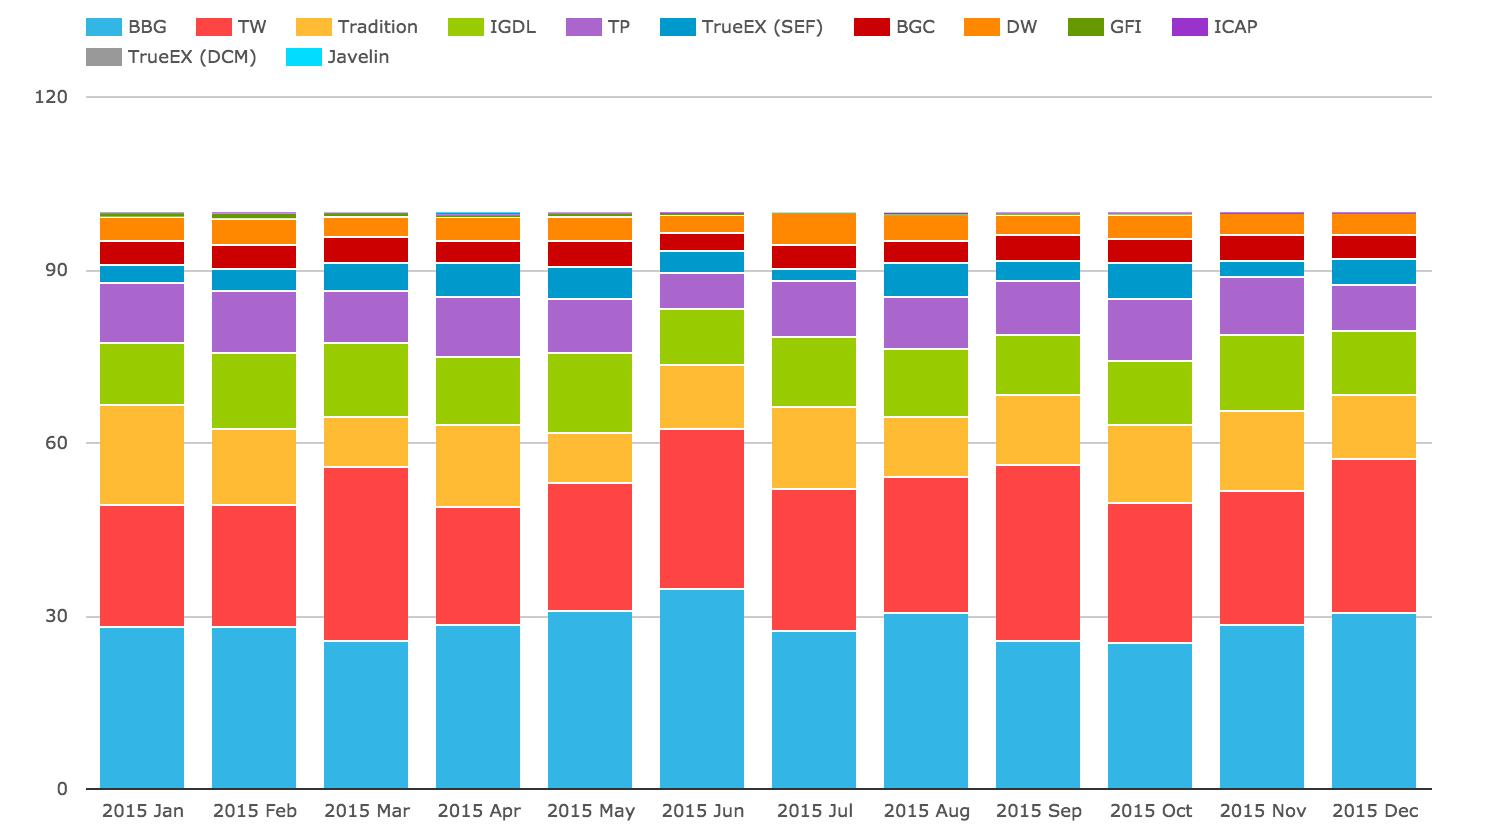
Interesting. Too busy a chart to infer much.
So lets do what we usually do in our monthly reviews and exclude SEF compression/compaction trades and produce a market share pie chart for the year.
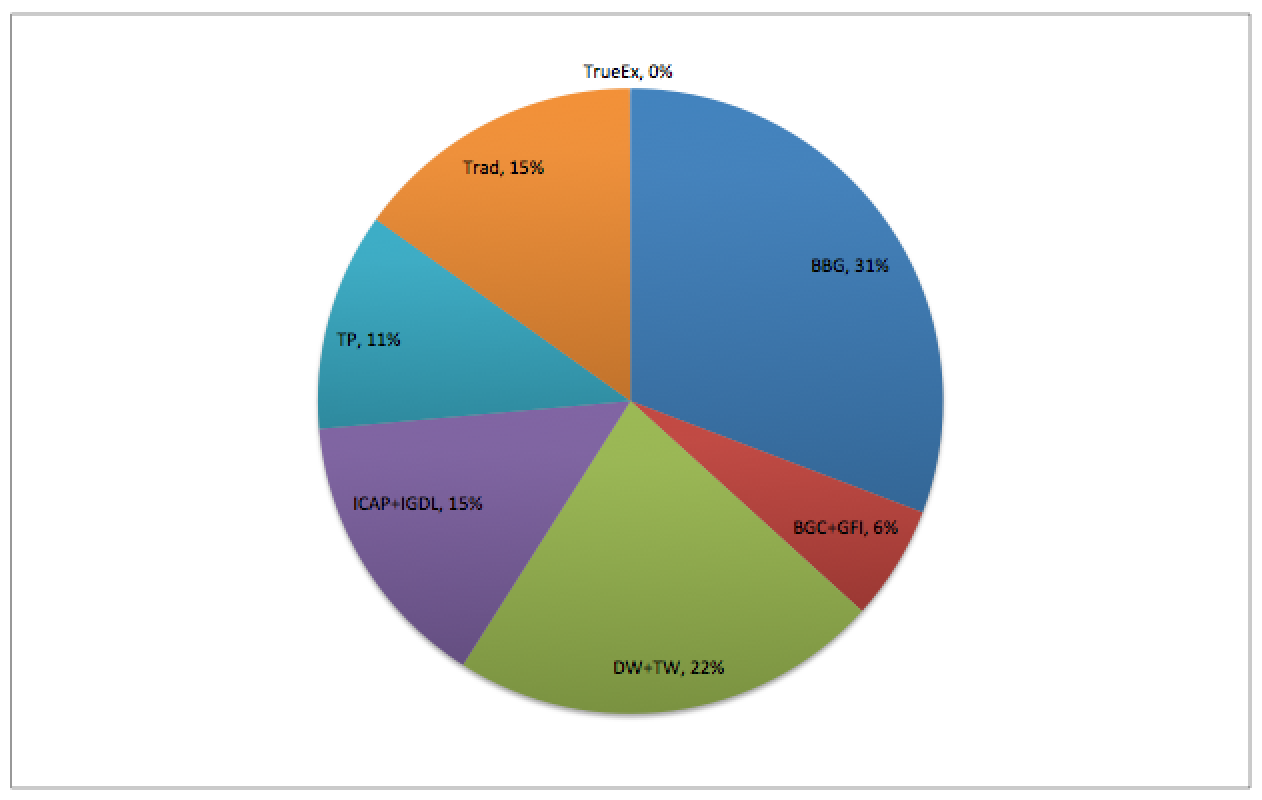
Showing that:
- Bloomberg has the largest share at 31%
- Tradeweb + Dealerweb is next with 22%
- Tradition and ICAP neck and neck with 15%
- Tullet with 11%
- BGC + GFI with 6%
These figures are consistent quarter on quarter in 2015.
SEF Compression volumes continue to do well (see 2015 Swap volumes in SDRs) and while Tradeweb is the largest breaking out their compression/compaction volumes requires a number of assumptions. Instead lets look at TrueEx gross notional by currency, which we will assume to be 100% package compression.
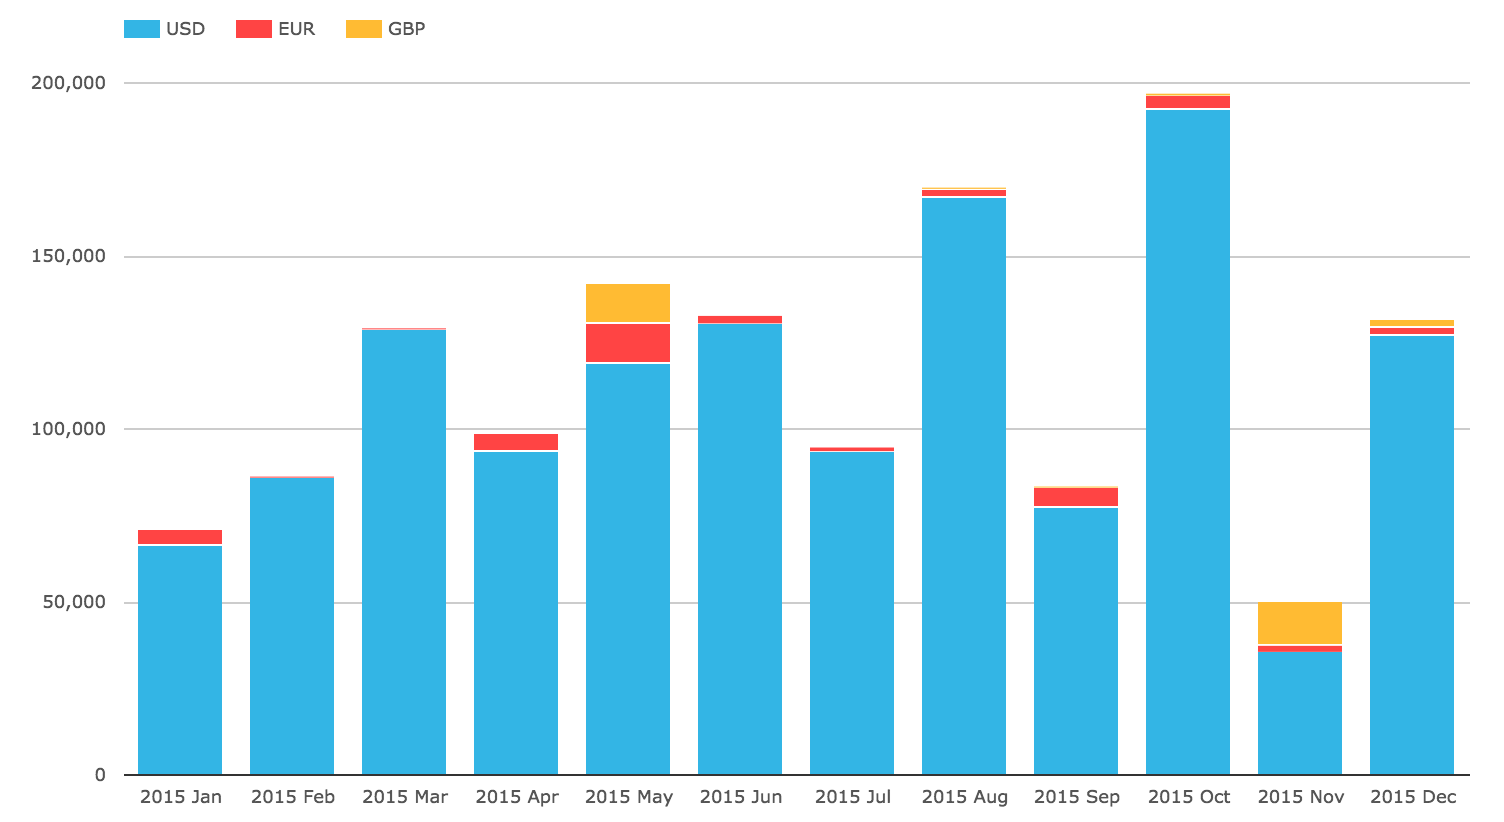
Showing increasing volume with highs in Aug and Oct of > $150b gross notional.
And what of CME-LCH Switch trades? Lets look at the volumes of these since June 1, 2015.
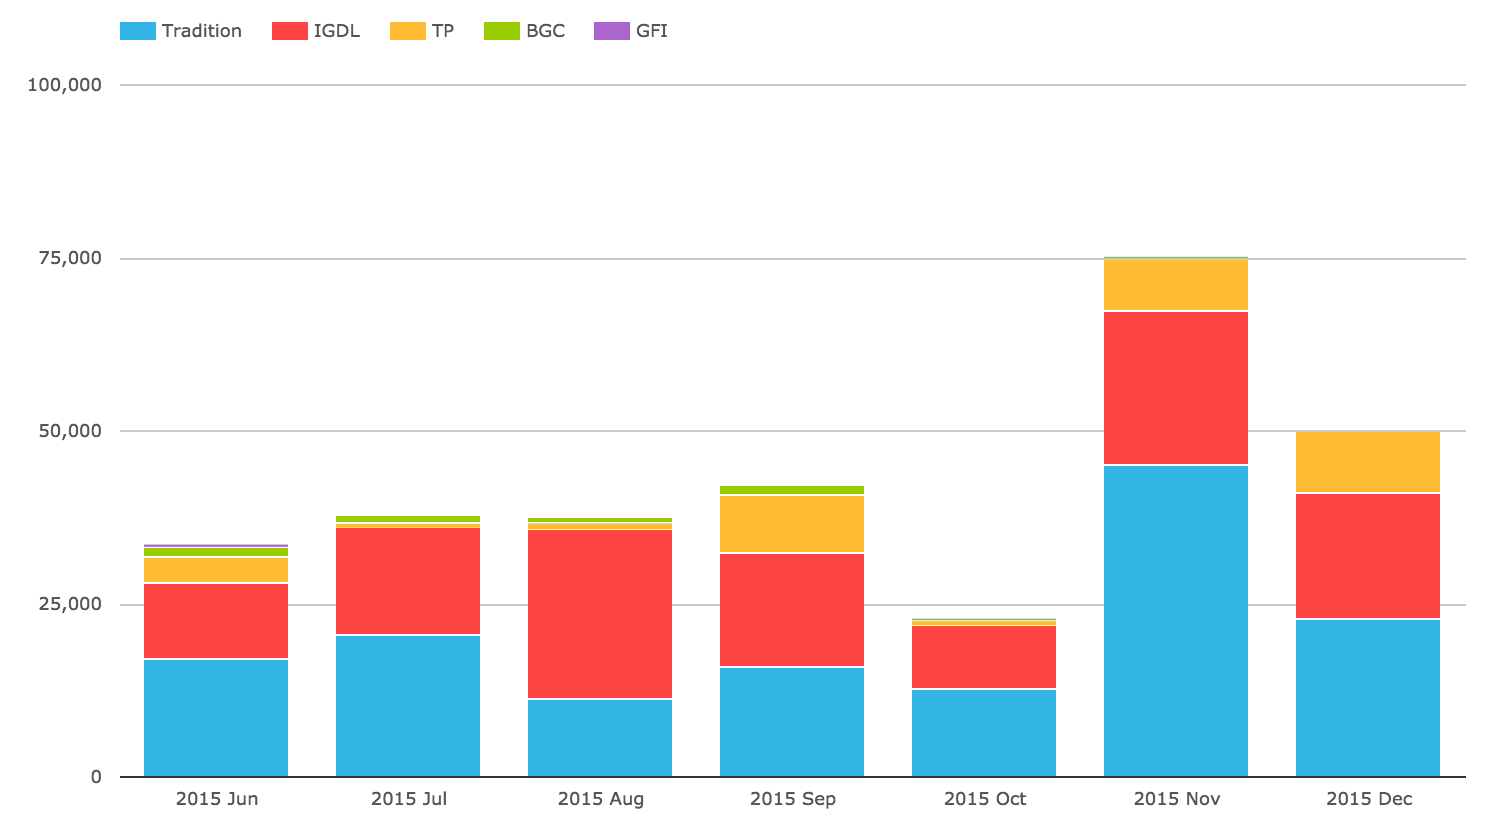
Showing that:
- November was the highest month with $75b gross notional
- Tradition has the largest share with 49%
- ICAP is next with 39%
- Tullet with 10%
- BGC+GFI with 2%
Wrap Up
Thats it for today.
Eleven charts to summarise 2015 SEF Statistics.
I hope you found them useful.
It will be interesting to see what the Jan 2016 data shows.
Next week we will publish our monthly Swaps Review.