Details of 2021 volumes and market share for OTC Derivatives in Interest Rates reported by Clearing Houses.
Clarus CCPView has daily volume and open interest data published by each CCP, which is filtered, normalised and aggregated to allow meaningful comparisons of volumes, as in all the charts below.
Contents:
- USD Swaps (LIBOR, OIS, SOFR)
- EUR Swaps (EURIBOR, OIS, €STR)
- GBP Swaps (LIBOR, SONIA)
- JPY Swaps (IBOR, TONA)
- AUD Swaps (BBSW, AONIA)
- CAD Swaps (IBOR, CORRA)
- EMEA Swaps
- AsiaPac Swaps
- LatAm Swaps
Onto the charts, data and details.
Volumes and Market Share
For major currencies and regions, vanilla swaps referencing IBORs and OIS Swaps referencing RFRs.
We use single-side gross notional and cleared volume over a period, either a Year, a Quarter or a Month.
USD Swaps (Libor)

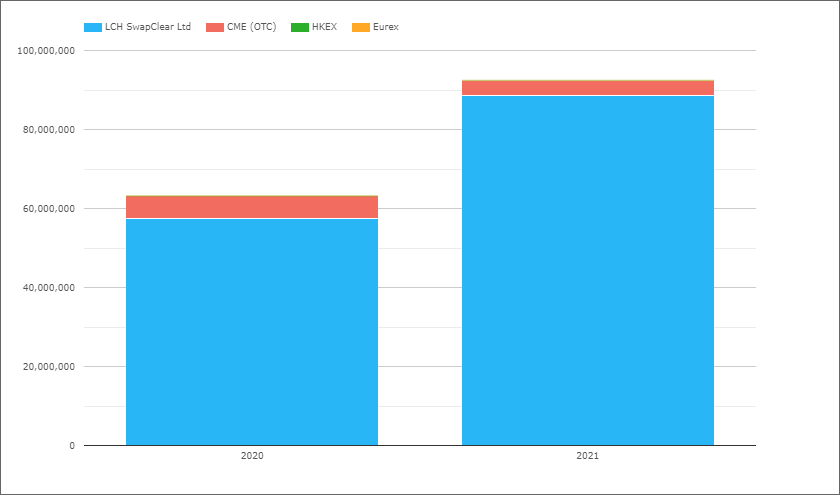
- 2021 with $93 trillion compared to $63 trillion in 2020 (and $76 trillion in 2019), a $30 trillion increase!
- But one explained by FRA volumes dropping from $95 trillion in 2020 to $39 trillion in 2021, as the product transitioned to single-period Swaps (due to Libor Fallbacks)
- LCH SwapClear with $88.6 trillion in 2021 and $57.5 trillion in 2020
- CME OTC with $3.9 trillion in 2021 and $5.7 trillion in 2020
- 2021 Share is LCH 96% and CME 4%, compared to 91% v 9% in 2020, but not really an apples to apples comparison given the FRA issue noted above
A chart showing USD FRAs and Libor Swaps by quarter for the same period is illustrative.
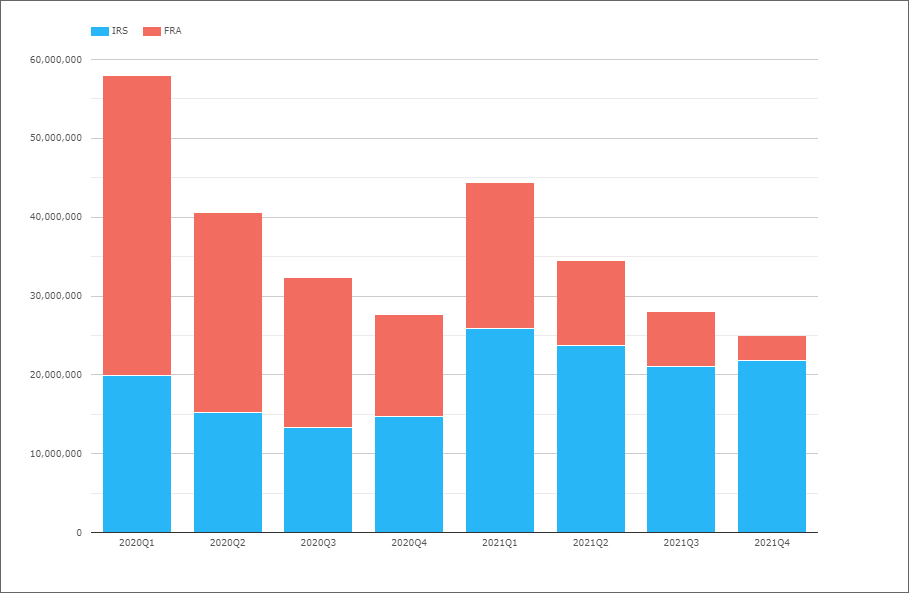
Showing very clearly the deceasing FRA volumes and resulting higher volume of Swaps, with the total volume in each 2021 quarter lower than the corresponding 2020 quarter.
Combining these we see 2021 with $132 trillion compared to 2020 with $159 trillion, a drop of 17%.
Given the noise in the data and the fact that USD Libor trading is winding down leading up to the end of USD Libor, let’s move onto Overnight Index Swaps.
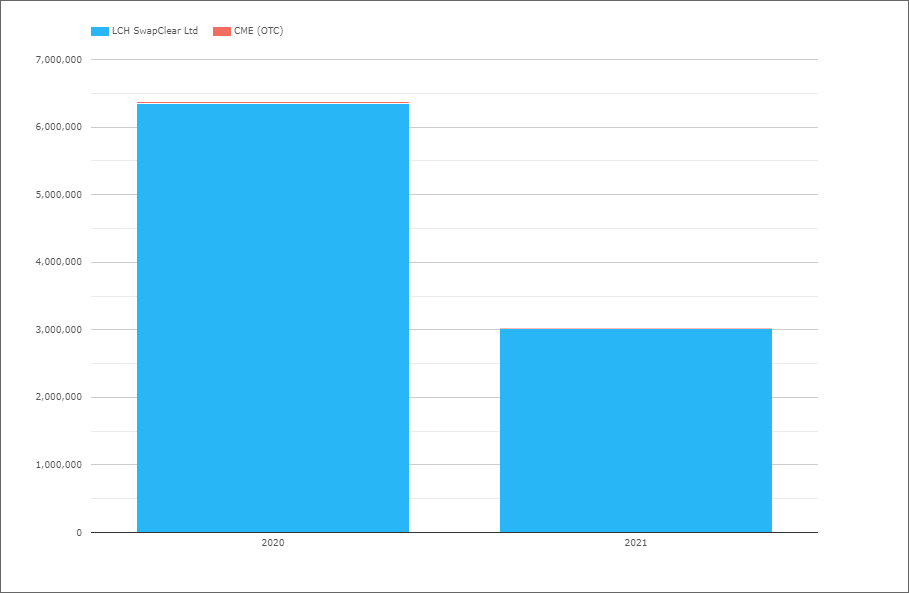
USD OIS (All)
Referencing Fed Funds and SOFR.

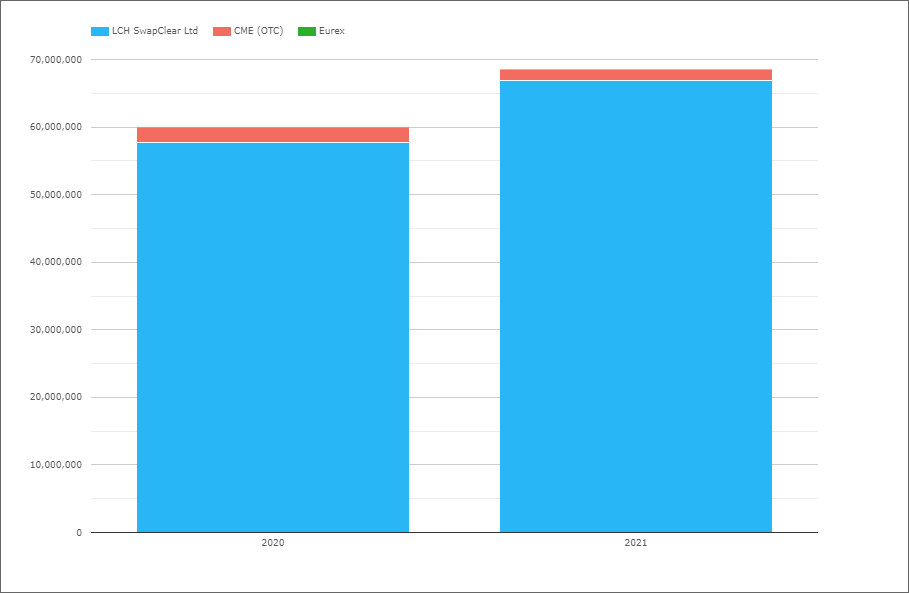
- 2021 with $68.5 trillion compared to $60 trillion in 2020, an increase of 14%
- LCH SwapClear with $66.9 trillion in 2021 and $57.7 trillion in 2020
- CME OTC with $1.7 trillion in 2021 and $2.3 trillion in 2020
- 2021 Share is LCH 97.5% and CME 2.5%, compared to 96.2% v 3.8% in 2020
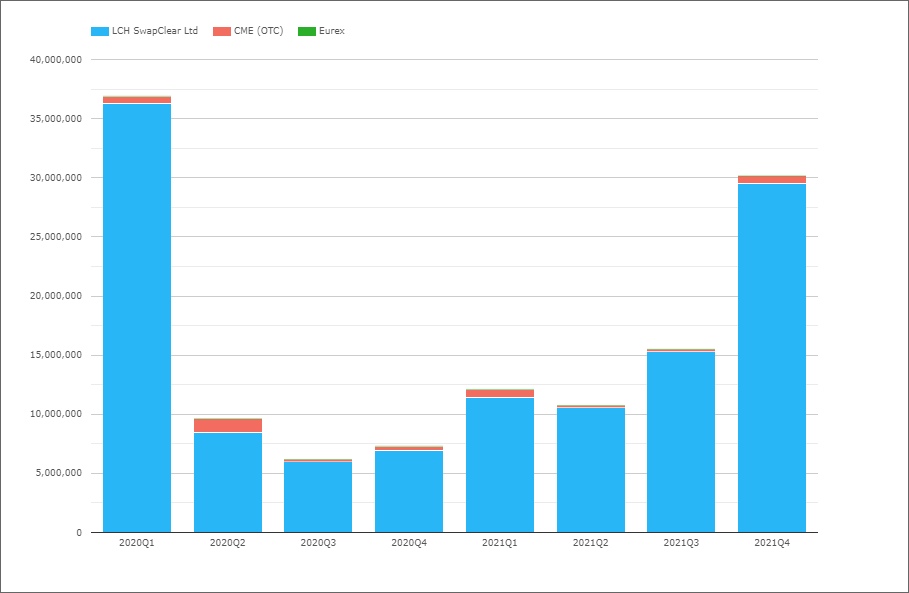
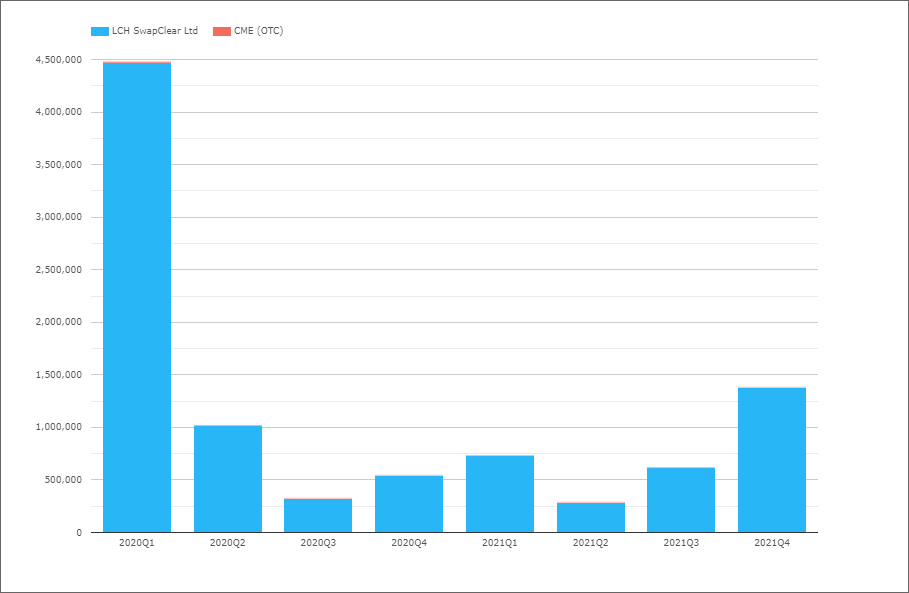
- 2020Q1 with $37 trillion and 2021Q4 with $30 trillion
- The remaining quarters far lower
- Federal Reserve rate rise expectations driving volumes in 2020Q1 and 2021Q4
USD Swaps (SOFR)
Next isolating Swaps that reference SOFR, either OIS or Basis.
- 2021 with $17.3 trillion, so 25% of the $68.5 trillion of OIS Swaps
- And a real pick up from September onwards
- 4Q2021 volume of $8.5 trillion is @ 30% of the combined FRA and Libor Swap volume
- So some growth expected ahead, as SOFR replaces Libor Swaps
- While FRAs for portfolio maintenance will no longer be needed
- LCH SwapClear with $16.5 trillion in 2021, a 95% market share
- CME OTC with $810 billion in 2021, a 5% market share
That’s all for USD for today.
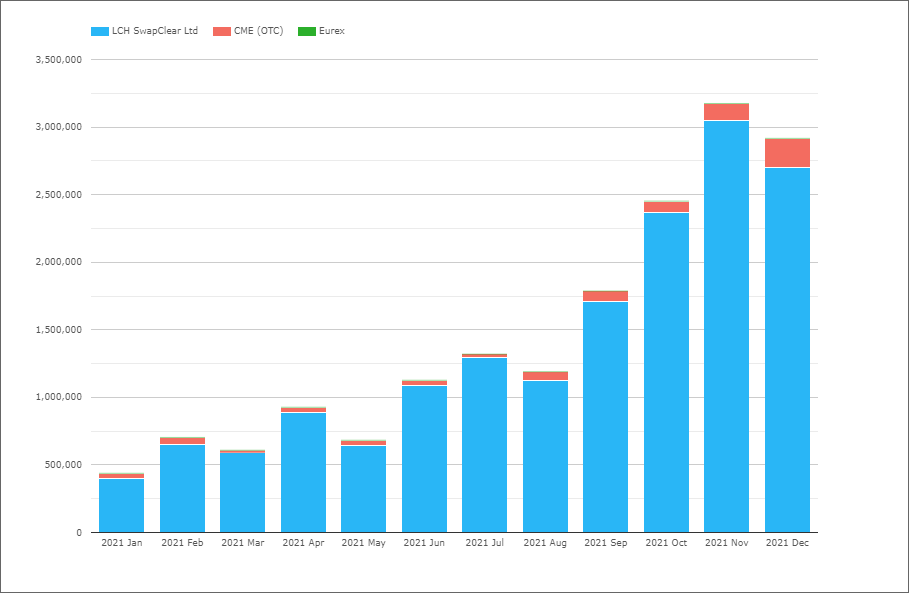
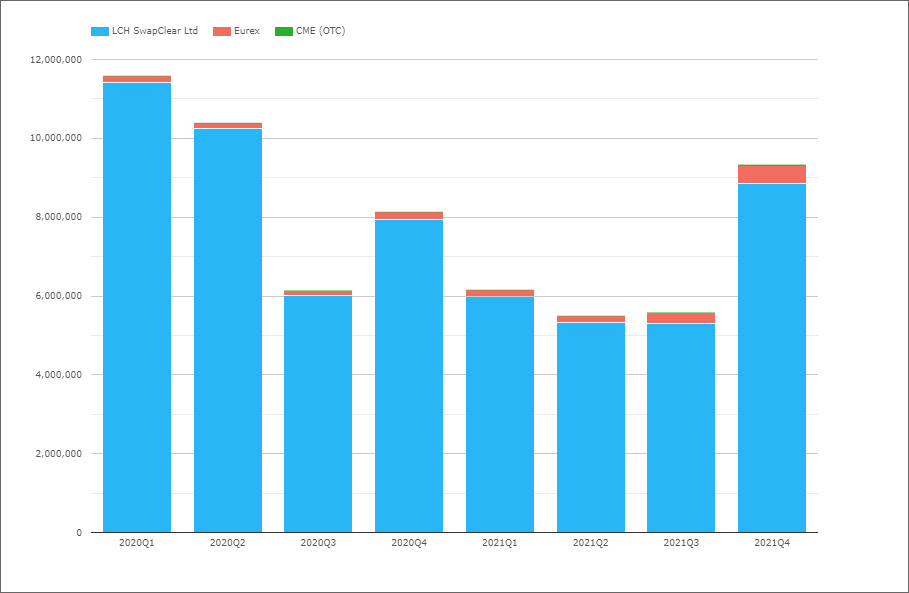
EUR Swaps (Euribor)
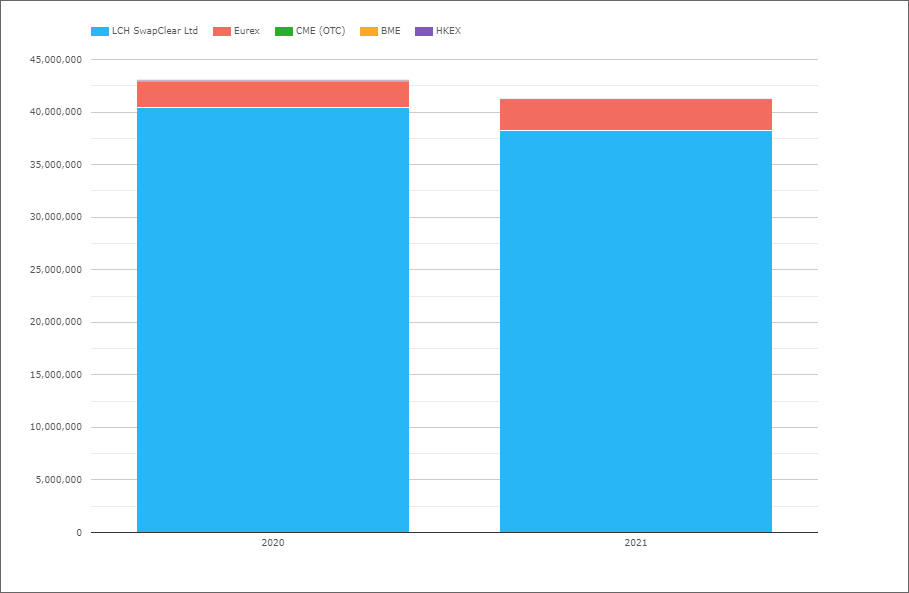
- 2021 with €41 trillion compared to €43 trillion in 2020, a decrease of 5%
- LCH SwapClear with €38.2 trillion in 2021 and €40.4 trillion in 2020
- Eurex with €3 trillion in 2021 and €2.5 trillion in 2020
- 2021 market share is LCH 92.8%, Eurex 7.2% and CME < 0.1%
- While 2020 share was 94%, 5.8% and 0.2% respectively
- And 2019 share was 96.2%, 3.5% and 0.2%
So Eurex continuing to gain share in 2021 from LCH.
But at a slow rate and a lower gain than in 2020 (a 1.4% increase in 2021 compared to 2.3% in 2020).
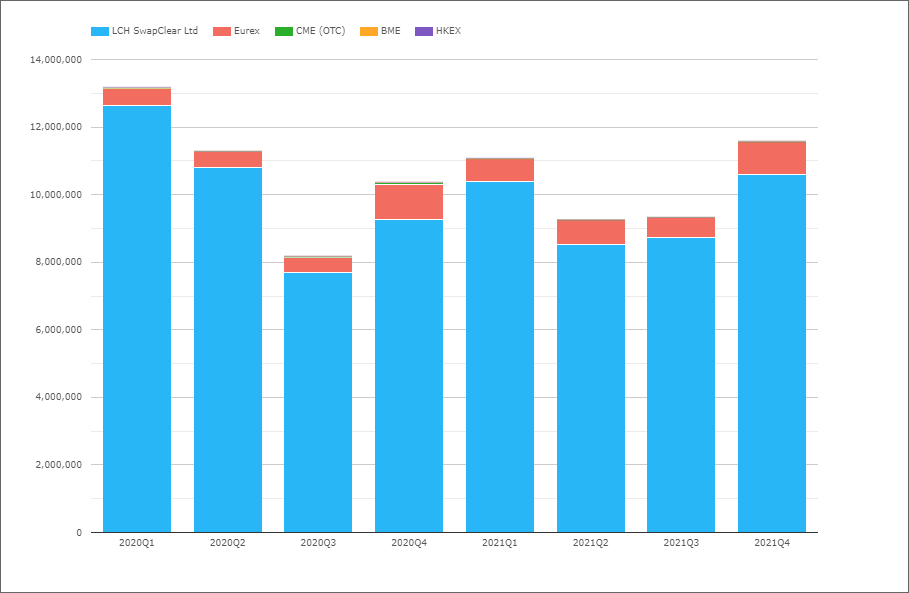
- The first two quarters of 2020, higher than corresponding quarters in 2021
- While the opposite is true for the last two quarters of 2020 and 2021
- 4Q Eurex Share higher than other quarters in both 2020 and 2021
With the removal of the withdrawal of CCP equivalence from the EU for UK CCPs that was set for mid 2021, it is hard to predict if Eurex’s growth in share will continue at the same rate or lower.
Definitely one to keep an eye on in the month’s ahead.
EUR OIS (All)
Referencing either EONIA or €STR.
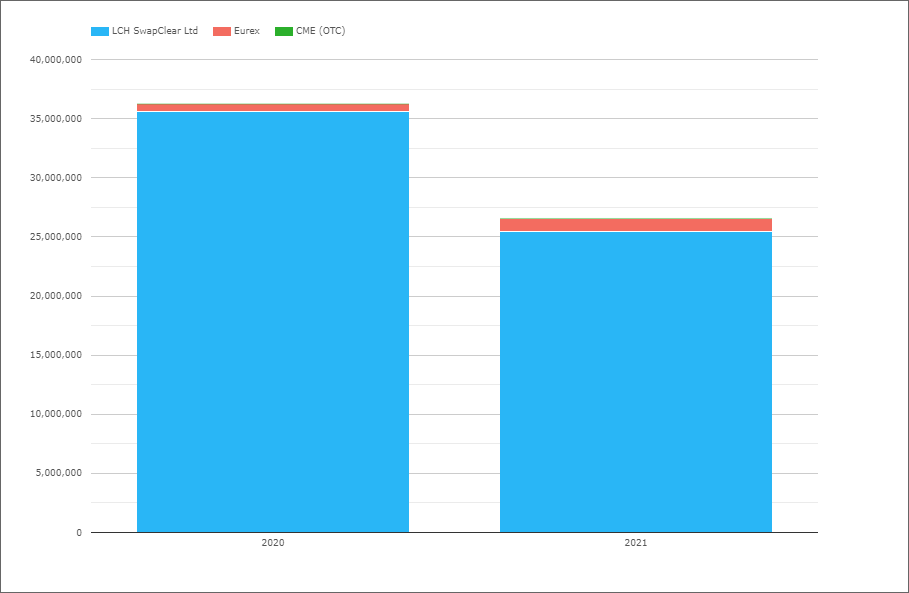
- 2021 with €26.6 trillion, down from €36.3 trillion in 2020 (and €45 trillion in 2019)
- LCH SwapClear with €25.5 trillion in 2021 and €35.6 trillion in 2020
- Eurex with €1.06 trillion in 2021 and €620 billion in 2020
- 2021 market share is LCH 95.8% and Eurex 4%
- While 2020 share was LCH 98.3% and Eurex 1.7%
- 2021Q4 with €9.3 trillion the highest since 2020Q2
- Eurex share of 5.1% in 2021Q3 and 4.7% in 2021Q4, up materially from 3.3% and 2.6% in prior quarters
EUR Swaps (€STR)
Next isolating Swaps that reference €STR, either OIS or Basis.
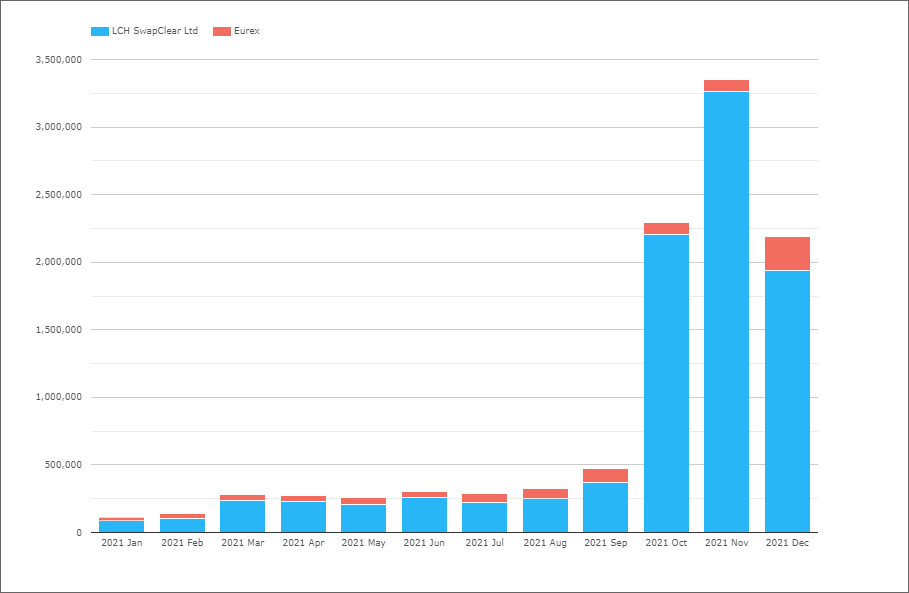
- A huge pick up in October as the €STR reference replaced EONIA for Swaps
- (even though EONIA has been fixed off €STR for some time now)
- LCH with €9.4 trillion in 2021, a 91% market share
- Eurex with €920 billion in 2021, a 9% market share
GBP Swaps (Libor)
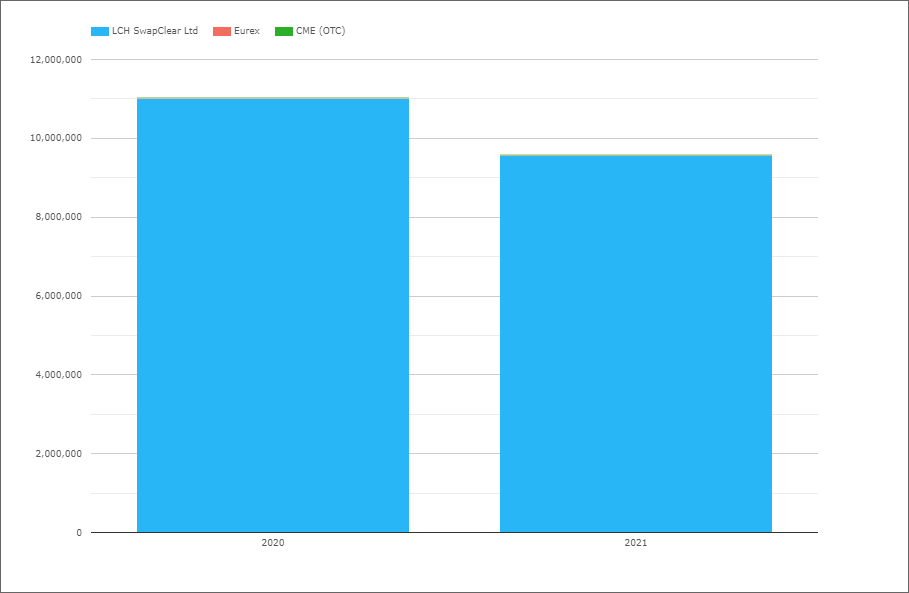
- 2021 with £9.6 trillion compared to £11 trillion in 2020
- LCH SwapClear with 99.7% of the volume
- A very clear trend of dropping volumes in 2021
- Leading up to the end of GBP Libor on 31-Dec-2021
- Strange writing that, given how used to GBP Libor we have been for 30+ years now
Let’s move onto the replacement rate, SONIA.
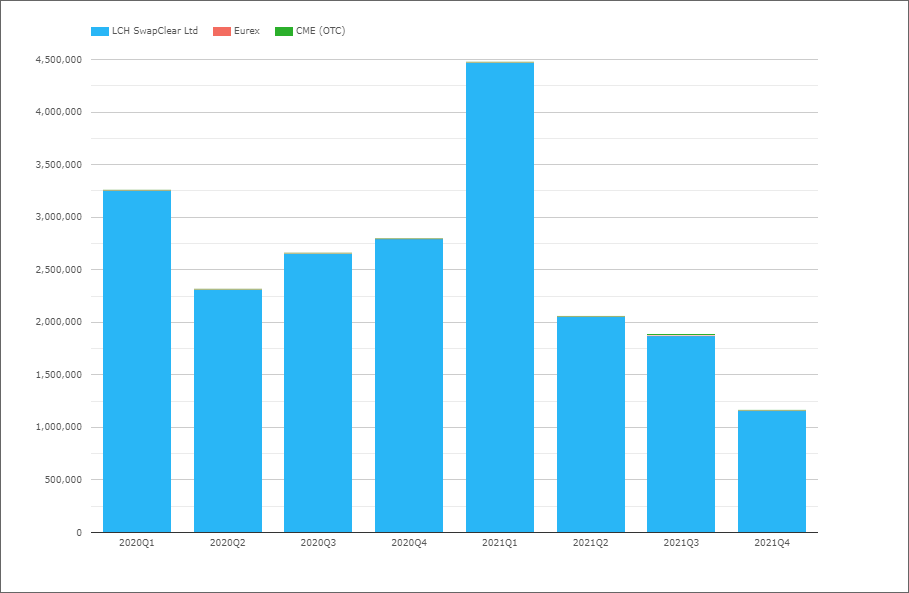
GBP OIS (SONIA)
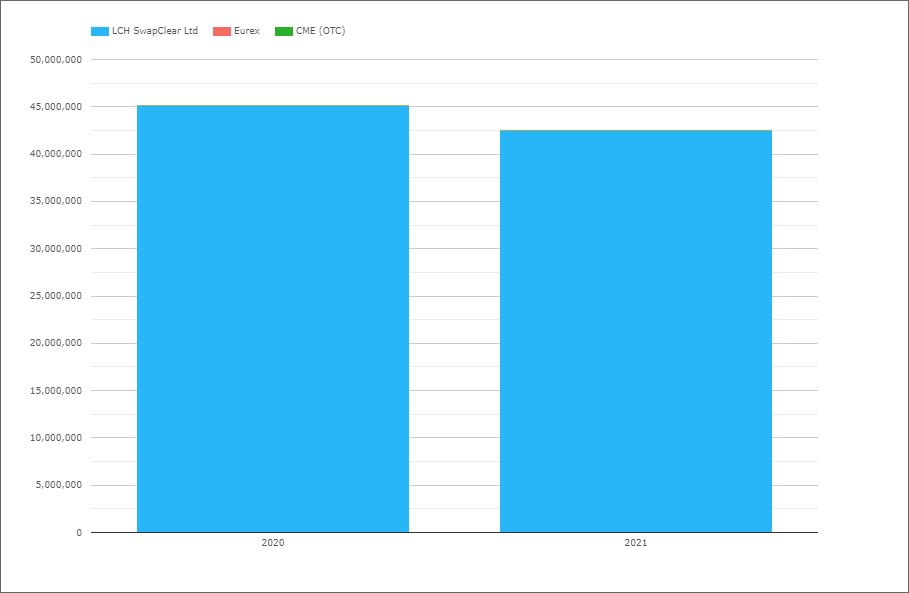
- 2021 with £42.5 trillion compared to £45.2 trillion in 2020, a decrease of 6%
- LCH SwapClear with close to 100% market share
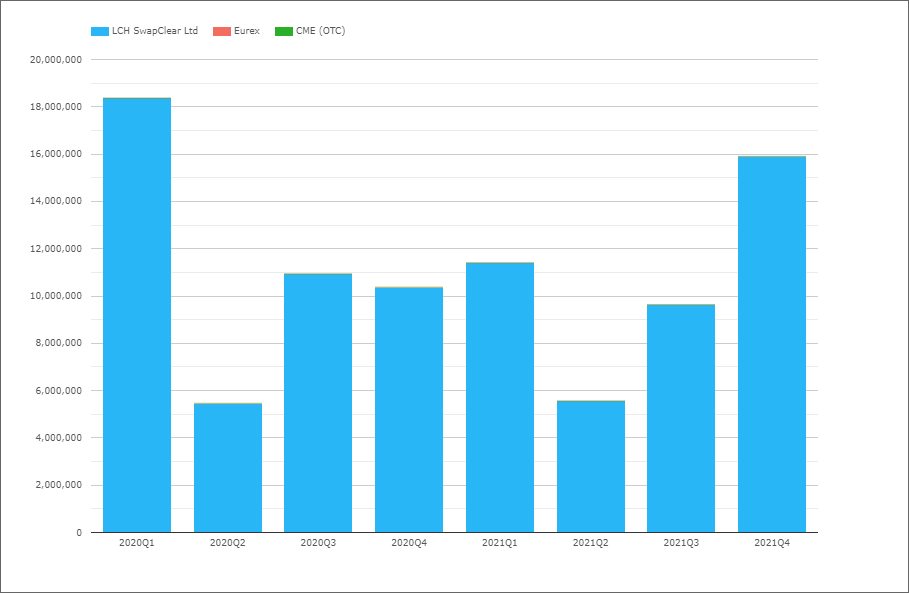
- 2021Q4 with £16 trillion, by far the highest quarter since 2020Q1
Now that Libor is no more and we only have SONIA, it will be interesting to see how volumes in Swaps (and Futures) develop as the BOE starts to raise interest rates in the year ahead.
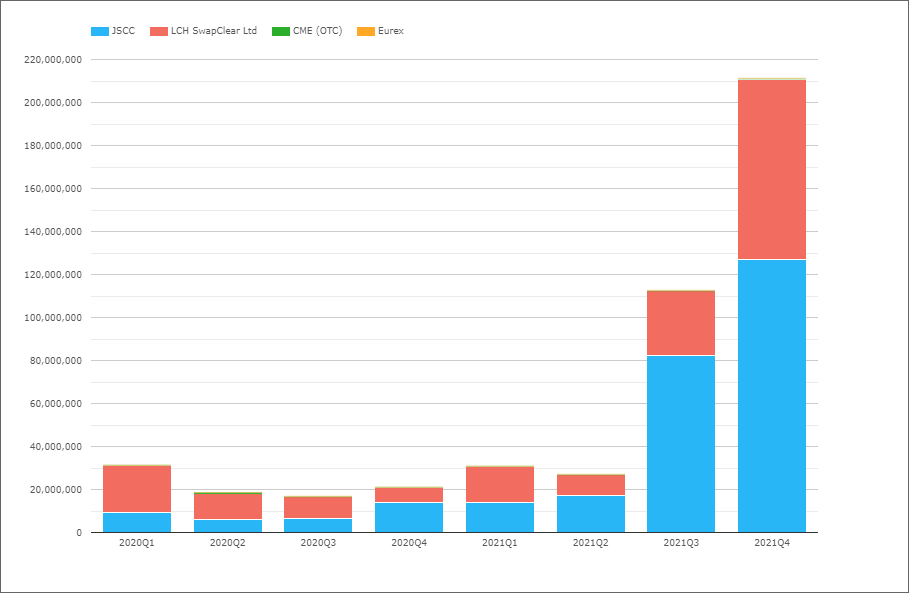
JPY Swaps (IBOR)
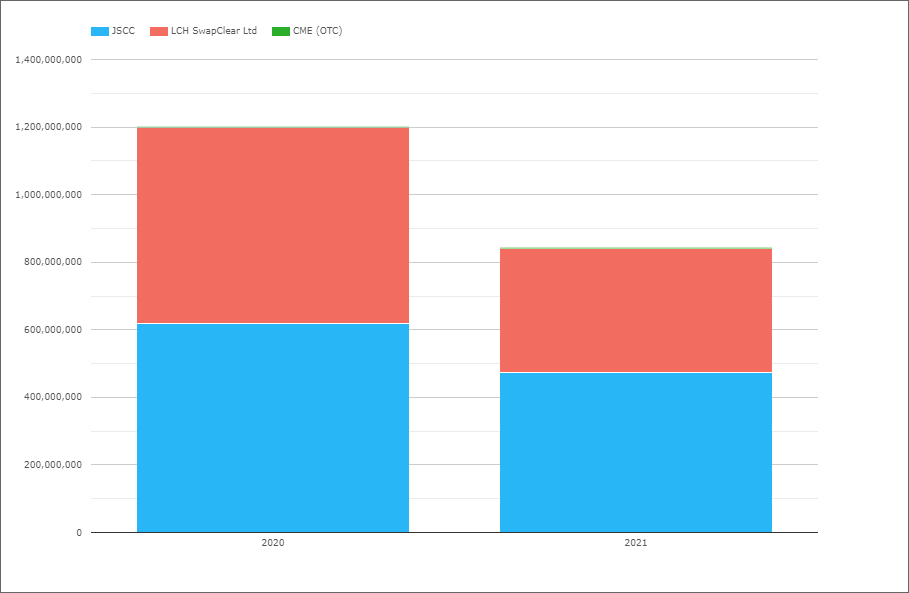
- 2021 with Y844 trillion compared to Y1,200 trillion in 2020, a decrease of 30%
- JSCC with Y473 trillion in 2021, a 56.1% market share
- LCH with Y368 trillion in 2021, a 43.8% market share
- The 2020 share was JSCC 51.6% to LCH 48.3%
JSCC share significantly higher, as JPY Libor comes to an end, but TIBOR continues and TONA the RFR.
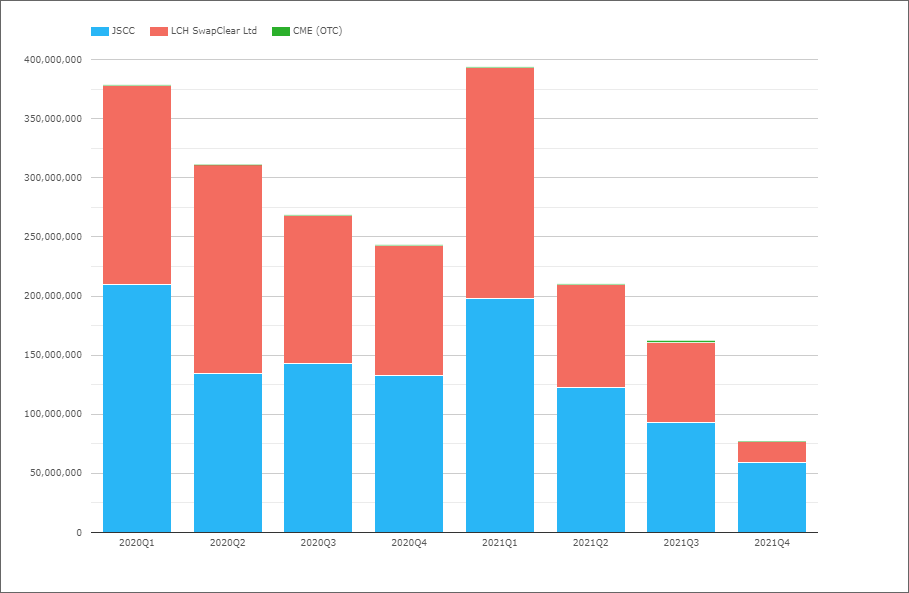
- A telling chart indeed with 2021Q4 markedly lower than prior quarters
- Time to see how TONA did in this quarter
JPY OIS (TONA)
- 2021Q4 with Y211 trillion, up from Y112 trillion in Q3 and < Y30 trillion in prior quarters
- JSCC with Y127 trillion in 2021Q4, while LCH with Y84 trillion
- A market share of 60% JSCC to 40% LCH
- A touch higher share for JSCC in OIS than IRS
AUD Swaps
As Australia is a multi-rate jurisdiction with both AONIA and BBSW, we will chart both OIS and IRS products.
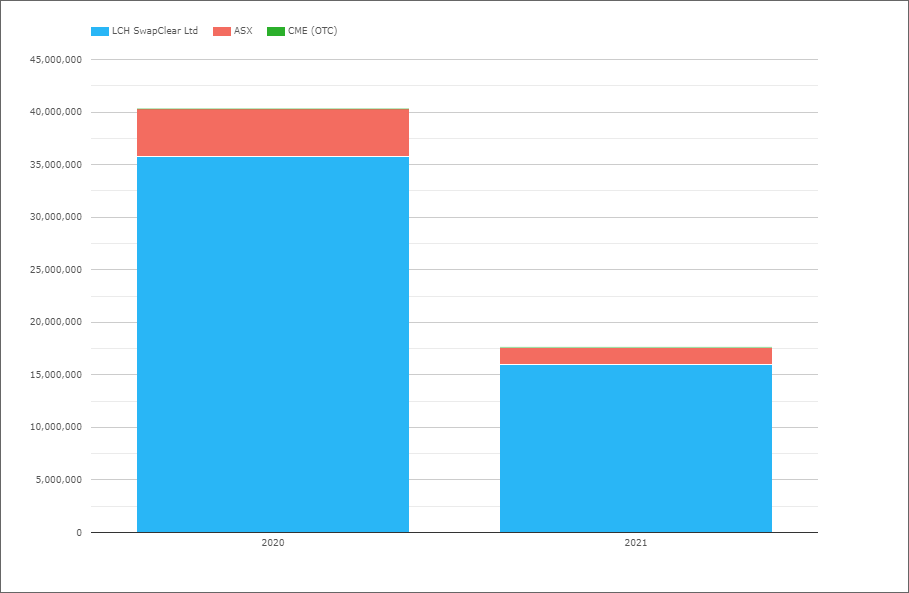
- 2021 with A$17.6 trillion compared to A$40.3 trillion in 2020, a decrease of 56%
- Largely as a collapse in OIS volumes resulting from RBA policy action
- LCH with A$16 trillion in 2021, an 90.4% market share
- ASX with A$1.7 trillion in 2021, an 9.4% market share
- The 2020 share was LCH 88.6% to ASX 11.4%

CAD Swaps (IBOR)
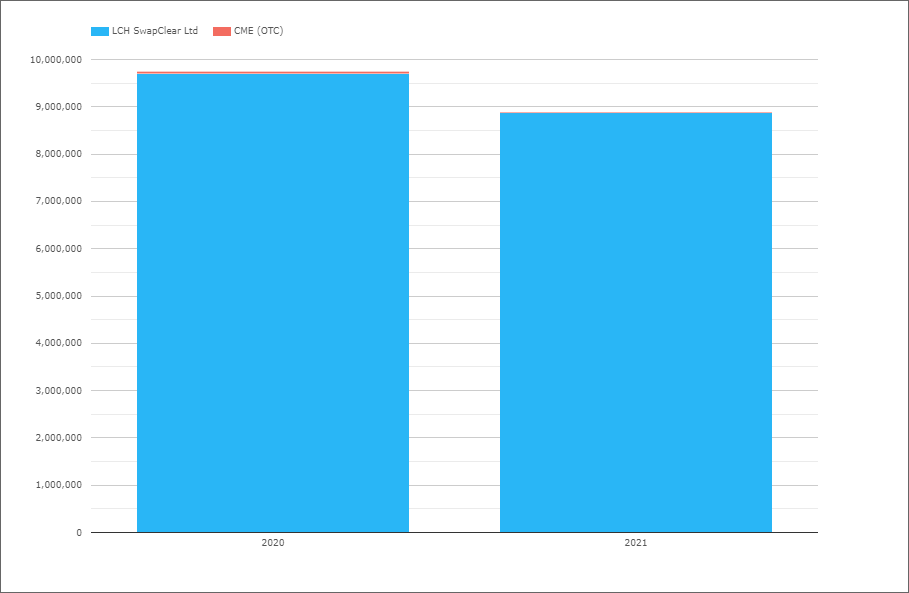
- 2021 with C$8.9 trillion compared to C$9.75 trillion in 2020, a decrease of 9%
- LCH SwapClear with close to 100% of the volume
Quarterly volumes do not show any trend of interest, so wil skip those.
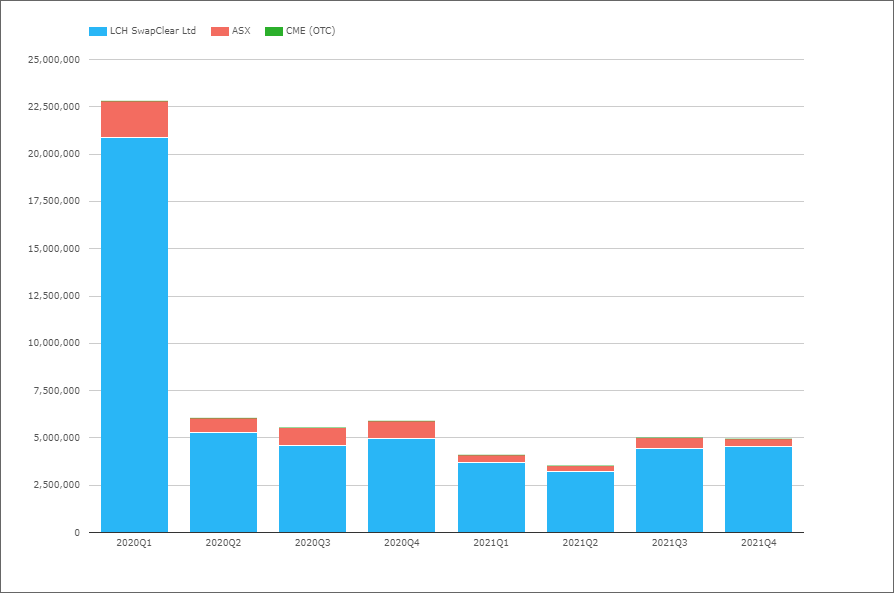
CAD OIS (CORRA)
- 2021 with C$3 trillion compared to C$6.4 trillion in 2020, a drop of 53%
- A very similar picture to AUD above, with volumes subdued since 2020Q1
- No doubt for similar Central Bank rate policy reasons
EMEA Swaps
Now let’s switch to EMEA Swaps (all types) and volumes by currency.
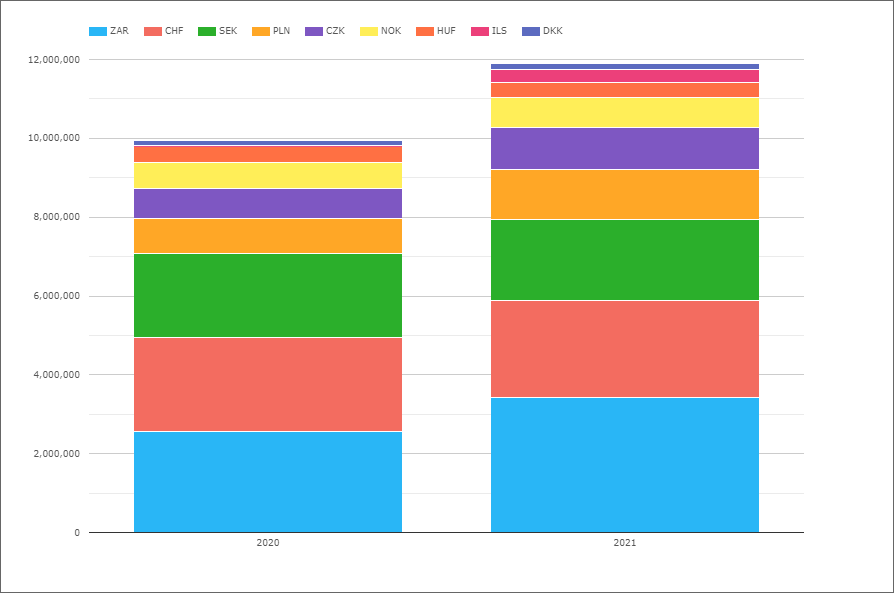
- 2021 with $12 trillion, up from $10 trillion in 2020, an increase of 20%
- ZAR the largest currency with $3.4 trillion in 2021, up from $2.6 trillion
- CHF with $2.5 trillion, up from $2.4 trillion
- SEK with $2.05 trillion, down from $2.13 trillion
- PLN with $1,280 billion, up from $890 billion
- CZK with $1,040 billion, up from $765 billion
- NOK with $765 billion, up from $660 billion
- HUF with $387 billion, down from $399 billion
- ILS a new currency launched in 2020 by LCH with $340 billion in 2021
- DKK flat at $146 billion
Not shown in the chart is that LCH SwapClear has 97.7% of the overall EMEA volume.
The only currencies where LCH has less than 99% share are:
- PLN, with LCH 92.9%, KDPW 4.4% and CME 2.7%
- SEK, with LCH 95.8%, Nasdaq OMX 4.2%
- HUF, with LCH 96.3%, CME 3.7%
- CZK, with LCH 98.3%, CME 1.7%
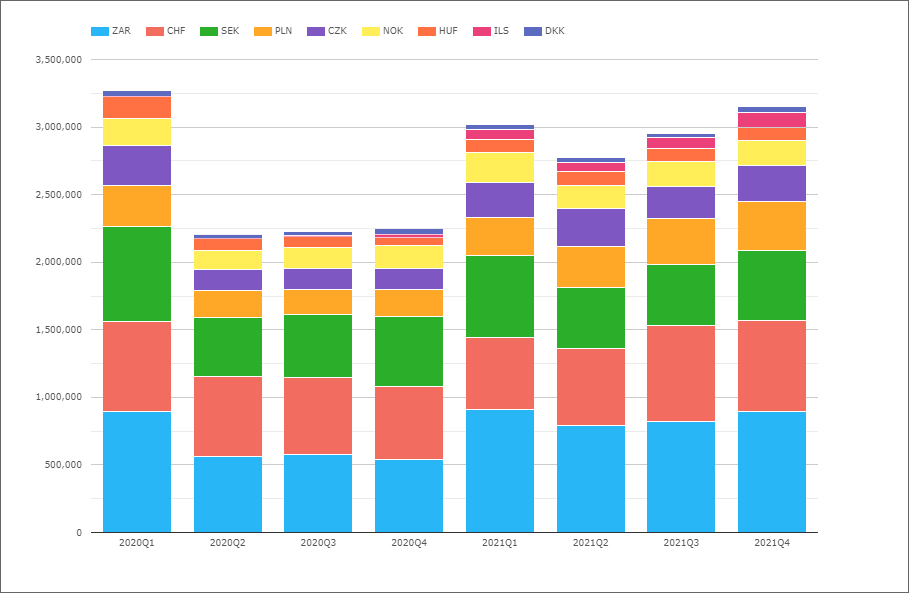
- Each quarter in 2021 with @ $3 trillion of volume
AsiaPac Swaps
Now let’s switch to AsiaPac Swaps (all types) and volumes by currency.
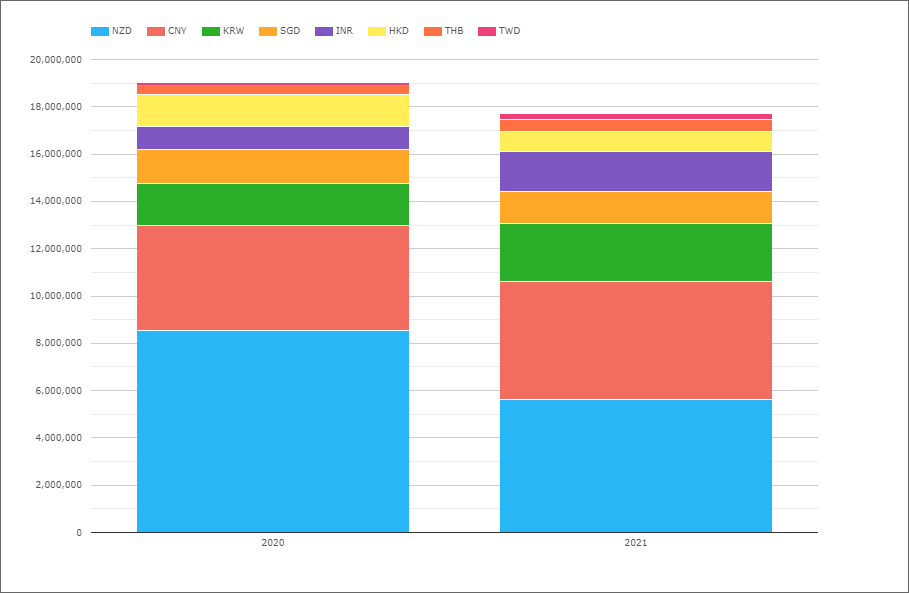
- 2021 with $17.7 trillion, down from $19 trillion in 2020
- NZD the largest currency with $5.6 trillion, down from $8.6 trillion
- CNY with $5 trillion, up from $4.4 trillion
- KRW with $2.45 trillion, up from $1.81 trillion
- INR with $1.7 trillion, up from from $970 trillion
- SGD with $1.35 trillion, down from $1.42 trillion
- HKD with $837 billion, down from $1.37 trillion
- THB with $522 billion, up from $355 billion
- TWD with $230 billion, up from $145 billion
Not shown in the chart is that LCH SwapClear has 81% of the overall AsiaPac volume.
The only currencies where LCH has less than 99% share are:
- CNY, with Shanghai Clearing 63.7%, LCH 36.2%, HKEX 0.1%
- INR, with LCH 66.2%, CCIL 33.7%, CME 0.1%
- HKD, with LCH 97.8%, HKEX 1%, CME 1.2%
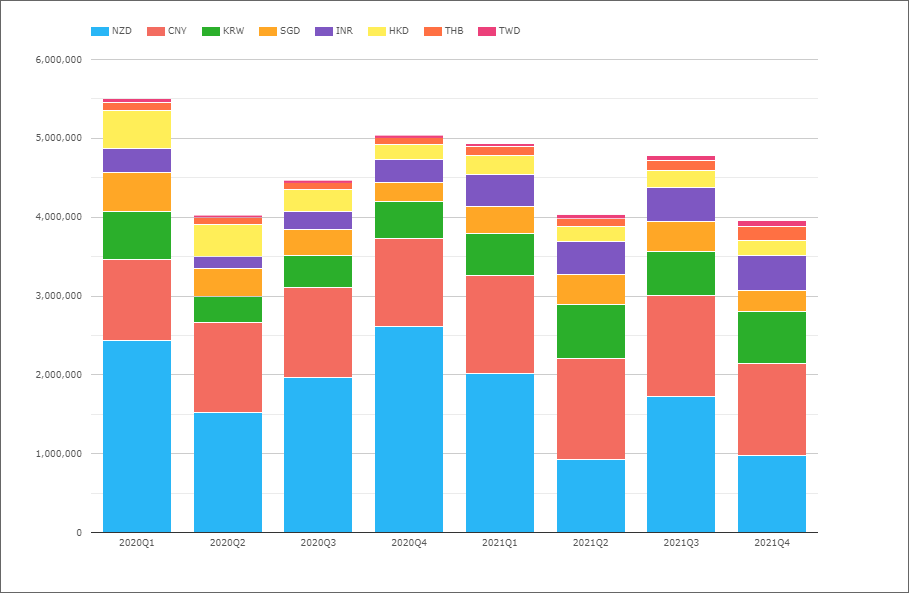
- Each quarter comparable, in the $4 trillion to $5 trillion range
- So materially larger than the $3 trillion for EMEA
LatAm Swaps
And last but not least, lets look at LatAm Swaps.
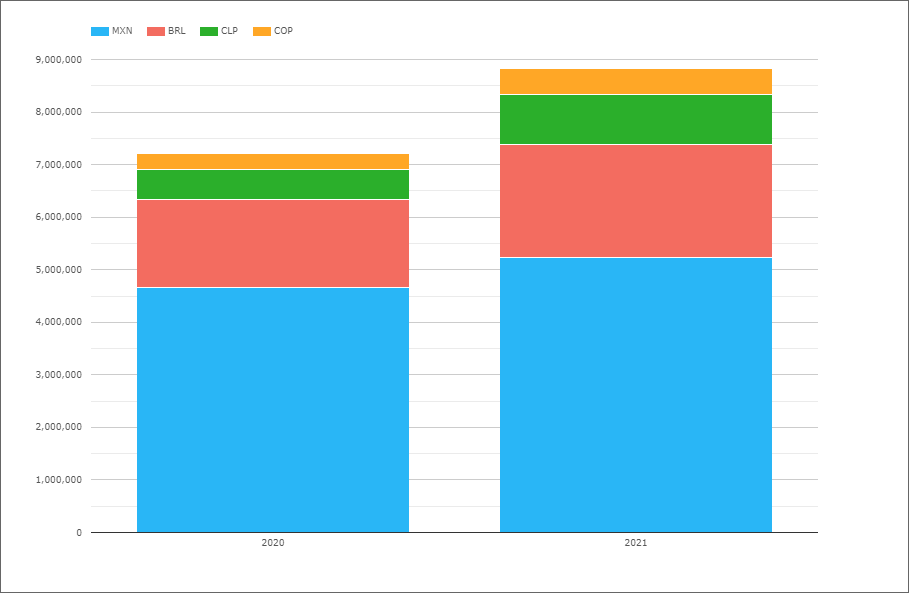
- 2021 with $8.8 trillion, up from from $7.1 trillion in 2020 (and $9.3 trillion in 2019)
- So comparable in volume to EMEA Swaps, even though 4 currencies compared to 9
- MXN the largest with $5.2 trillion, up from $4.7 trillion in 2020
- BRL with $2.2 trillion, up from $1.7 trillion
- CLP with $940 billion, up from $560 billion
- COP with $495 billion, up from $300 billion
Not shown in the chart is that CME has >98% share in each of these currencies except MXN, where CME had 90.8% in 2021, Asigna/Mexder with 7% and LCH with 2.1%.
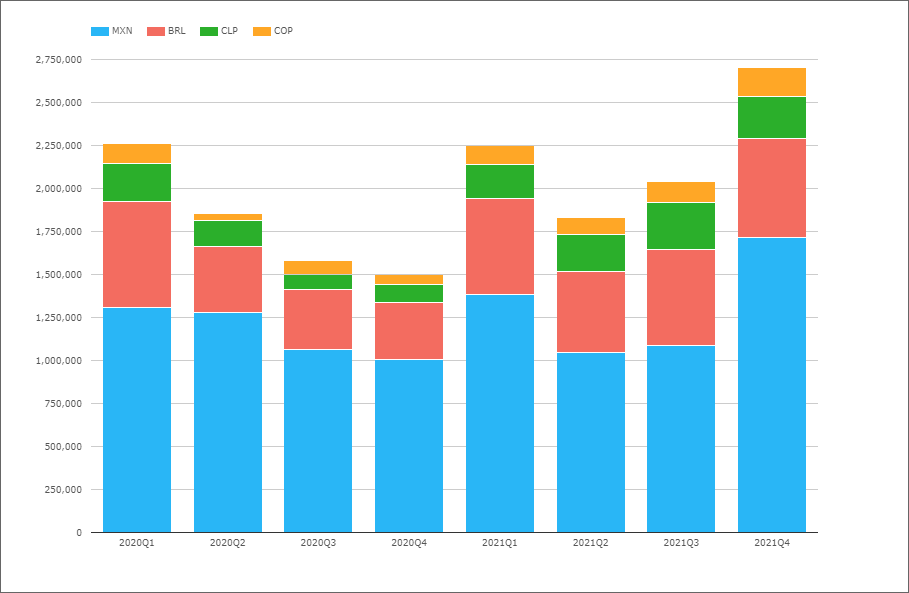
- 2021Q4 the highest with $2.7 trillion
- An increasing trend from 2021Q2 onwards
That’s It
Only 28 Charts for an overview!
There is a lot more data to look at.
We have tenor data for most of the volume.
We have IR Futures in all the major currencies.
US Treasury volumes.
Credit Derivatives and FX Derivatives.
For more details on any of the above.
Please contact us for a CCPView demonstration.
That’s it for today.
We look forward to an interesting 2022.