Global Cleared Derivatives
Aggregate Volume or Open Interest
Filter by CCP, Asset Class, Product, and Currency
CPMI-IOSCO Quantitative Disclosures (QD)
QD Data from Sep 2015 to date
Latest Posts
-
Jul, 29
Marginal record Q2 volumes for cleared FXD and US-reported NDFs
This blog looks at Q2 2026 volumes of FX derivatives (FXD), following the record volumes noted in Q1. Key takeaways In Q2 2026: Read on for more analysis, explanation and volume charts and statistics from CCPView and SDRView. Note on volume statistics Cleared FX OTC derivatives covered by CCPView include NDFs, FX options, FX forwards, NDOs, and spot […]
Read moreJul, 22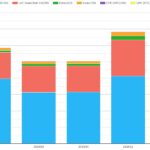
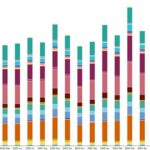
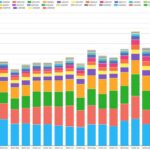
Q2 2026 cleared rates swaps: 17% below the Q1 high but up 23% YoY
This blog covers global notional volumes of cleared rates swaps in quarter two (Q2) 2026, focusing on volumes of OIS, fixed-float IRS and zero-coupon swaps with a material volumes’ share for each currency. Key takeaways In Q2 2026 global core cleared rates swaps volumes were US$262 trillion notional – up 23% YoY but down 17% from their Q1 2026 […]
Read more -
Jun, 30
Record Q1 2026 CCP IM disclosures
At the end of March, clearing houses published their Q1 2026 CPMI-IOSCO Quantitative Disclosures. This blog focuses on cleared IM for rates swaps, credit derivatives (CRD) and exchange-traded derivatives (ETD) together with a sample of the other disclosures. Key takeaways 31 March 2026 saw a new record in CCP-disclosed cleared IM for each of the three […]
Read moreJun, 10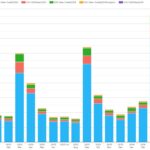
US firms powered March 2026 iTraxx swaps volume growth
This blog covers credit derivatives (CRD) trading volumes in March 2026, both at CCPs and as reported in the US. We sourced the charts and statistics from CCPView, SDRView and SBSDRView. Key takeaways Notes on CRD volumes We focus on the months of March and September because the standardized CRD maturity dates on the two months’ […]
Read more -
May, 13
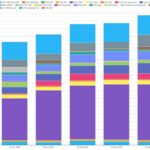
Q1 2026 exchange/CCP shares of cleared rates derivatives
This blog is the first edition of what will become a regular quarterly blog on competition between rates derivatives exchanges and CCPs measured by market share of trade notional cleared. Key takeaways In Q1 2026, the exchanges and CCPs market shares of the more competitive cleared derivatives products were as follows. Read on for more […]
Read moreMay, 6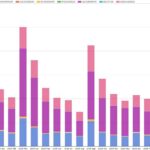
Volumes and most active names in credit derivatives – March 2026
Today we look at issuer names most actively traded based on single-name credit default swap (CDS) trades reported to US SEC Securities Based Swap Data Repositories (SBSDRs) in March 2026. This follows on from the prior similar blog covering September 2025, as we follow the natural CDS volume peaks in March and September. We rank SBSDR reported names by […]
Read more -
Apr, 28
FX derivatives volumes at the end of Q1 2026
This blog covers the volumes of FX derivatives (FXD) in Q1 2026, following on from our prior blog on Q4 2025 FXD volumes. Key takeaways Q1 2026 saw record notional volumes for all five cleared FXD products (non-deliverable FX forwards (NDFs), FX options, FX forwards, non-deliverable FX options (NDOs), and spot FX) and for SDR-reported NDFs and […]
Read moreApr, 22
Q1 2026 cleared rates swap volumes and CCP share
This blog covers global notional volumes and CCP market shares of core cleared rates swaps in quarter one (Q1) 2026, including OIS and fixed-float IRS for all currencies and zero-coupon swaps for BRL and CLP only. Key takeaways In Q1 2026 global notional volumes of core cleared rates swaps were US$321 trillion – up 43 […]
Read more