Clarus CCPView has daily volume and open interest data published by each CCP, which is filtered, normalised and aggregated to allow meaningful comparisons of volumes.
Today we look at 3Q24 volume and market share in IRD for:
- USD Swaps (SOFR, FF)
- EUR Swaps (EURIBOR, €STR)
- GBP Swaps (SONIA)
- JPY Swaps (TONA)
- AUD Swaps (BBSW, AONIA)
- CAD Swaps (CDOR, CORRA)
- EMEA Swaps
- AsiaPac Swaps
- LatAm Swaps
Which show record high volumes for USD, JPY, EMEA and APAC Swaps.
Onto the charts, data and details.
Volumes and Market Share
For major currencies and regions, vanilla swaps referencing IBORs and OIS Swaps referencing RFRs, using single-sided gross notional volume over a period; either a month, quarter or year.
USD OIS
Swaps referencing either Fed Funds or SOFR indices.

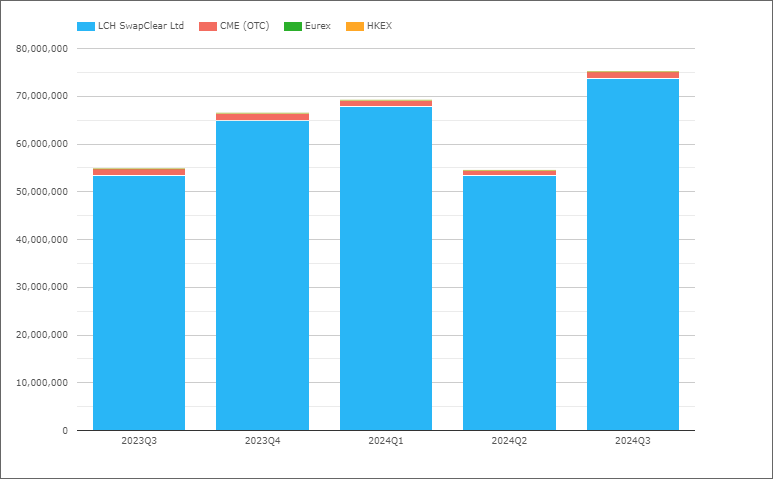
- 2024Q3 with $75.2 trillion is up 37%, compared to $54.85 trillion in 2023Q3
- LCH SwapClear with $73.8 trillion in 2024Q3 and $53.5 trillion in 2023Q3
- CME OTC with $1.42 trillion in 2024Q3 and $1.39 trillion in 2023Q3
- 2024Q3 Share is LCH 98.1% and CME 1.9%, compared to 97.5% v 2.5% in 2023Q3
2024Q3 volume of $75 trillion is a new all time high and exceeds the previous high volume of $69 trillion in 20024Q1 by $6 trillion or 9%. It is particularily surprising for Q3, a summer quarter to have record high volumes, but the voltaility in markets leading up to the rate cut in September, led to elevated volumes in both August and September. September 2024 with $29.35 trillion looks to be a record month, exceeding the $28.8 trillion in January 2024.
EUR Swaps (Euribor)
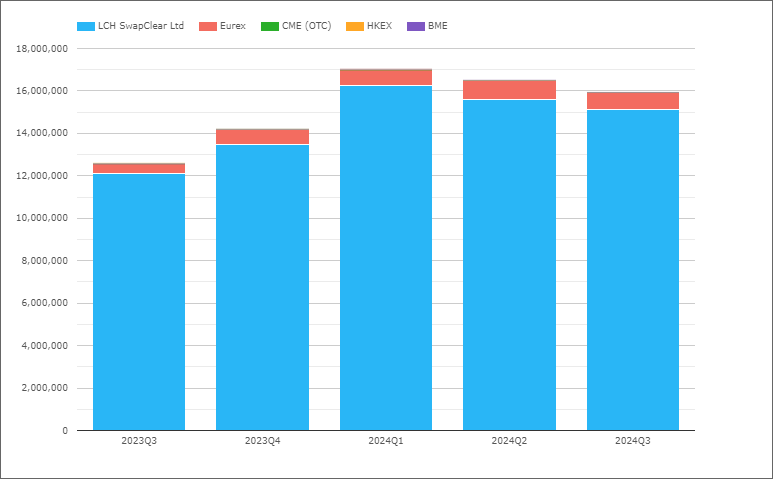
- 2024Q3 with €15.94 trillion is up 27% compared to €12.58 trillion in 2023Q3
- LCH SwapClear with €15.1 trillion in 2024Q3 and €12.1 trillion in 2023Q1
- Eurex with €0.8 trillion in 2024Q3 and €0.46 trillion in 2023Q3
- 2024Q3 market share is LCH 94.9%, Eurex 5%
- While 2023Q3 share was 96.3% and 3.6% respectively
Quarterly volumes drifiting down from the record high of €17 trillion in 2024Q1.
EUR OIS
Referencing either EONIA or €STR, though in recent quarters all volume will be €STR.
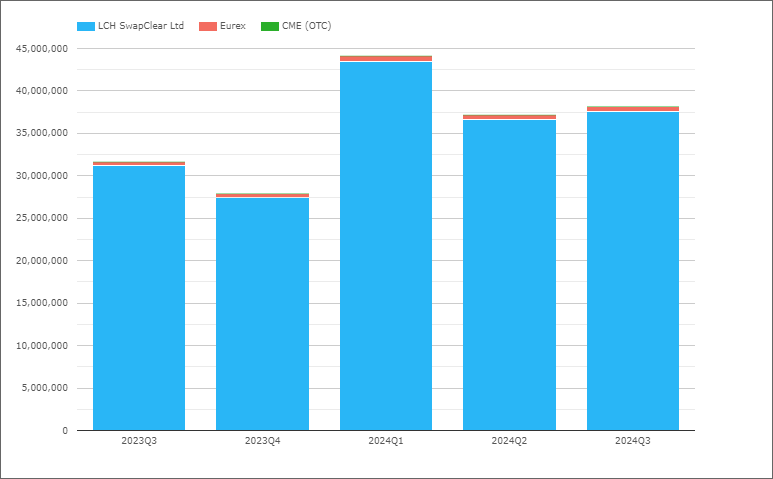
- 2024Q3 with €38.2 trillion is up 20%, compared to €31.7 trillion in 2023Q3
- LCH SwapClear with €37.6 trillion in 2024Q3 and €31.3 trillion in 2023Q3
- Eurex with €0.57 trillion in 2024Q3 and €0.4 trillion in 2022Q3
- 2024Q3 market share is LCH 98.5%, Eurex 1.5%, similar to a year earlier
The combined EUR IRS and OIS volume of €54.1 trillion in 2024Q3 at an fx rate of 1.1 is eqivalent to $59.5 trillion, so lower than USD OIS volume of $75 trillion in the quarter, which is the opposite of prior quarters when it has been higher.
GBP OIS (SONIA)
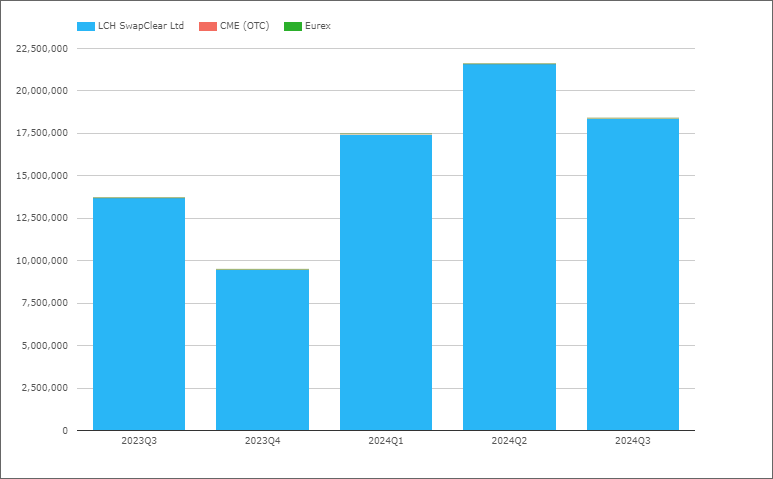
- 2024Q3 with £18.4 trillion is up 34% compared to £13.7 trillion in 2023Q3
- LCH SwapClear with 99.9% share
2024Q3 volume down from the 2024Q2 record high but still above the previous high of 2020Q1.
JPY OIS (TONA)
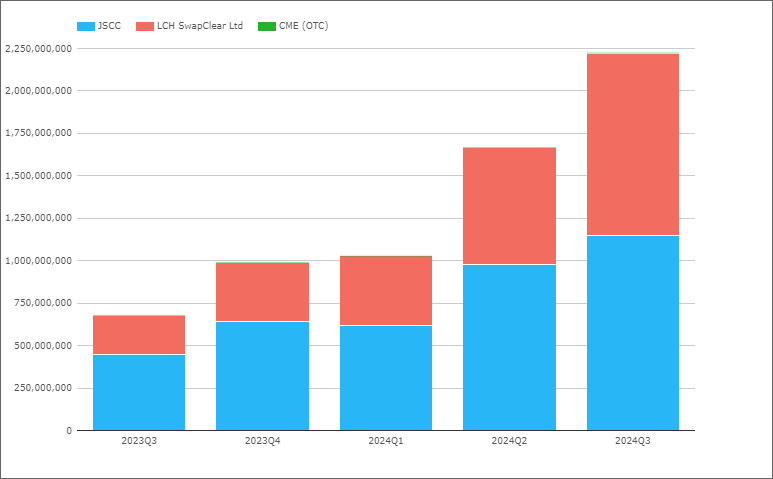
- 2024Q3 with Y2,225 trillion is up 3X compared to Y680 trillion in 2023Q3
- JSCC with Y1,146 trillion in 2024Q3, compared to Y450 trillion in 2023Q1
- LCH SwapClear with Y1,077 trillion in 2024Q3, compared to Y229 trillion in 2023Q3
- 2024Q3 Share is JSCC 51.5%, LCH 48.4%, compared to 66.2% and 33.8% in 2023Q3
2024Q3 volumes are a new record high, far exceeding the prior high of of Y1,558 trillion in 2024Q2.
At an FX rate of 150, the Y2,225 trillion in 2024Q3 is equivalent to $14.8 trillion.
AUD Swaps
Referencing either AONIA or BBSW, so both OIS and IRS.
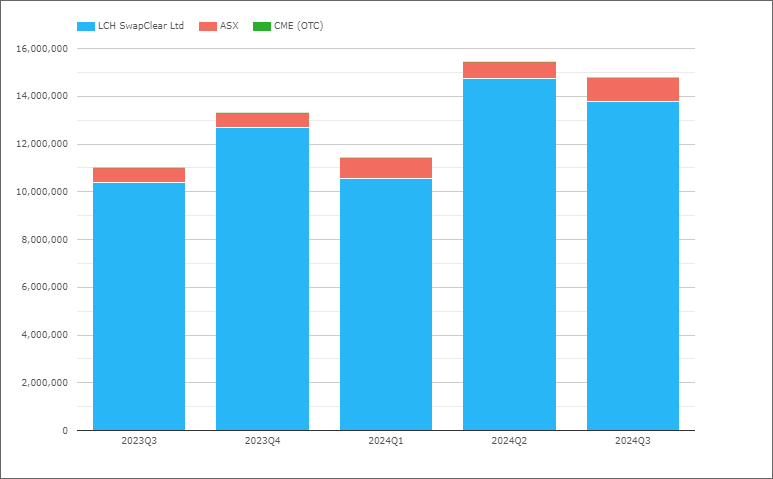
- 2024Q3 with A$14.8 trillion is up 35% compared to A$11.0 trillion in 2023Q3
- LCH SwapClear with A$13.8 trillion in 2024Q3 and A$10.4 trillion in 2023Q3
- ASX with A$1 trillion in 2024Q3 and A$0.6 trillion in 2023Q3
- 2024Q3 Share is LCH 93.2% and ASX 6.8%, compared to 94.5% vs 5.5% in 2023Q3
AUD up YoY but down QoQ and still far-off its record high in 2020Q1 of A$22.8 trillion.
CAD Swaps
Referencing either CORRA or CDOR, so both OIS and IRS.
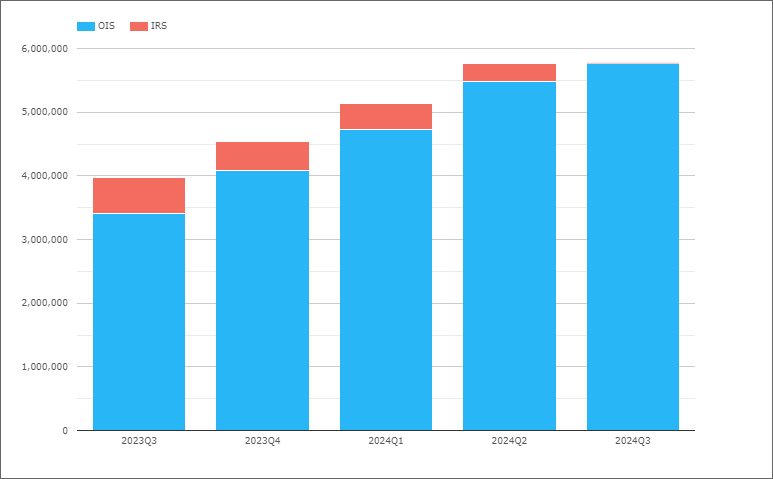
- 2024Q3 with C$5.8 trillion, compared to C$4 trillion in 2023Q3
- IRS volume at virtually zero in the recent quarter as the transition to CORRA is complete
- LCH SwapClear with 99.8% of the volume
2024Q3 is the third highest volume quarter, after 2020Q1 and 2023Q1 and overall OIS volumes similar or higher than combined IRS & OIS volumes in 2022 quarters.
EMEA Swaps
Now let’s switch to EMEA Swaps (all types) and volumes by currency.
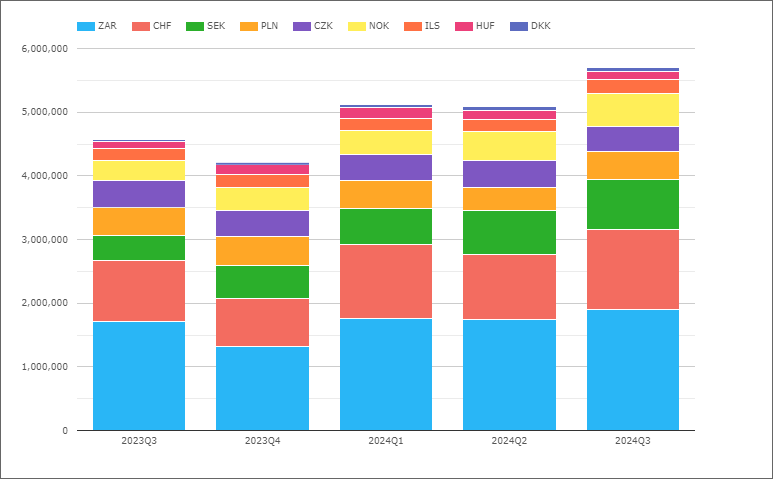
- 2024Q3 with $5.7 trillion is up 24% from $4.6 trillion in 2023Q3
- ZAR the largest in 2024Q3 with $1.9 trillion, up from $1.7 trillion in 2023Q3
- CHF next with $1.25 trillion, up from $0.94 trillion in 2023Q3
- SEK with $790 billion, up from $399 billion
- NOK with $523 billion, up from $316 billion
- PLN with $444 billion, flat compared to $446 billion
- CZK with $386 billion, down from $420 billion
- ILS with $211 billion, up from $180 billion
- HUF with $132 billion, up from $109 billion
- DKK with $53 billion, up from $33 billion
Volumes in all currencies are up from a year earlier, except for PLN and CZK.
The overall volume in 2024Q3 of $5.7 trillion is a record high from the $5.1 trillion in the prior two quarters.
Not shown in the chart is market share by CCP, where LCH has >98.8% share for 2024Q3 except for:
- HUF, LCH with 97.6%, CME with 2.4%
- PLN, LCH with 97%, CME 1.6%, KDPW 1.4%
AsiaPac Swaps
Now let’s switch to AsiaPac Swaps (all types) and volumes by currency.
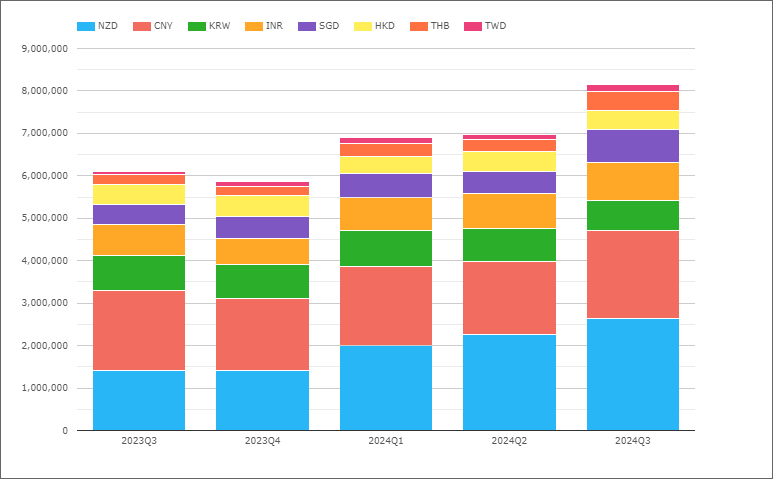
- 2024Q3 with $8.2 trillion is up 34% from the $6.1 trillon level in 2023Q3
- So materially larger than the $5.7 trillion for EMEA
- NZD the largest with $2.6 trillion in 2024Q3, up from $1.4 trillion in 2023Q3
- CNY next with $2.1 trillion, up from $1.9 trillion
- INR with $884 billion, up from $735 billion
- SGD with $796 billion, up from $481 billion
- KRW with $716 billion, down from $817 billion
- HKD with $440 billion, up from $456 billion
- THB with $436 billion, up from $232 billion
- TWD with $181 billion, up from $74 billion
2024Q3 volume of $8.2 trillion is a new record high from the $7 trillion in 2024Q2, with every currency higher except for KRW.
Not shown in the chart is market share by CCP, where LCH has >99.9% share for 2024Q3 except for:
- CNY, Shanghai with 59.6%, LCH with 40.4%
- HKD, LCH with 99.4%, HKEX 0.6%
- INR, LCH with 71.5%, CCIL with 28.5%
LatAm Swaps
Finally lets look at LatAm Swaps.
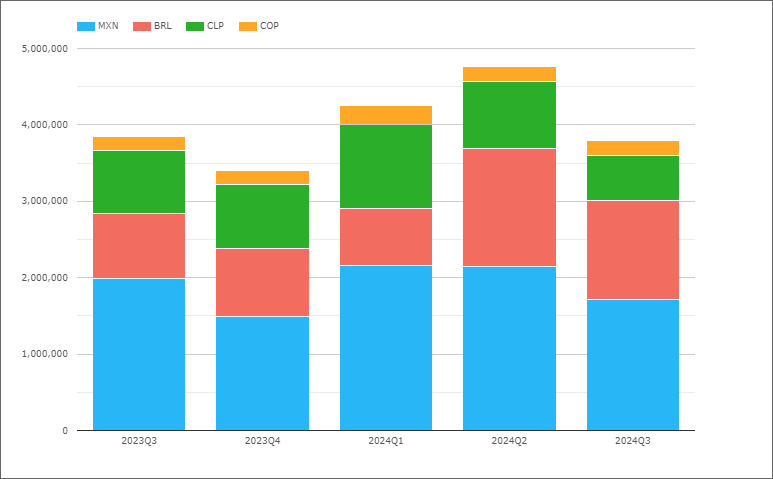
- 2024Q3 with $3.8 trillion is the same as in 2023Q3
- And smaller than EMEA $5.7 trillion or APAC $8.2 trillion volumes
- MXN the largest in 2024Q3 with $1.7 trillion, down from $2 trillion in 2023Q3
- BRL next with $1.3 trillion, up from $0.85 trillion in 2023Q2
- CLP with $595 billion, down from $820 billion
- COP with $200 billion, up from $180 billion
2024Q3 down from the prior two quarters.
Not shown in the chart is market share by CCP, where for 2024Q3 the shares are:
- MXN, CME with 88.3%, Asigna/Mexder 9.2%, LCH 2.5%
- BRL, CME 96%, LCH 4%
- CLP, CME 99%, LCH 1%
- COP, CME 98.4%, LCH 1.6%
That’s It
10 Charts for an overview.
Still a lot more data to look at
Volume in DV01 terms and Open Interest by currency.
IR Futures in all the major currencies and US Treasury volumes.
For more details, please contact us for a CCPView demonstration.