- We take a look at Swap Spreads, this time by way of Cross Currency Basis swaps.
- We find that Cross Currency swaps are also moving sharply lower and have seen impressive volumes…..
- …..with increases in volumes around key price levels that have acted as support in the past.
- More negative Cross Currency levels would normally be associated with higher swap spreads as both may be considered proxies for credit spreads…
- ..but both will tend to move lower when there is consistent bond issuance and an appetite to swap these issues into floating USD Libor exposures.
Last week’s blog was very well received, so before we plough on with the main story this week, let’s just take a quick look at volumes in Spreadovers since we last wrote about them:
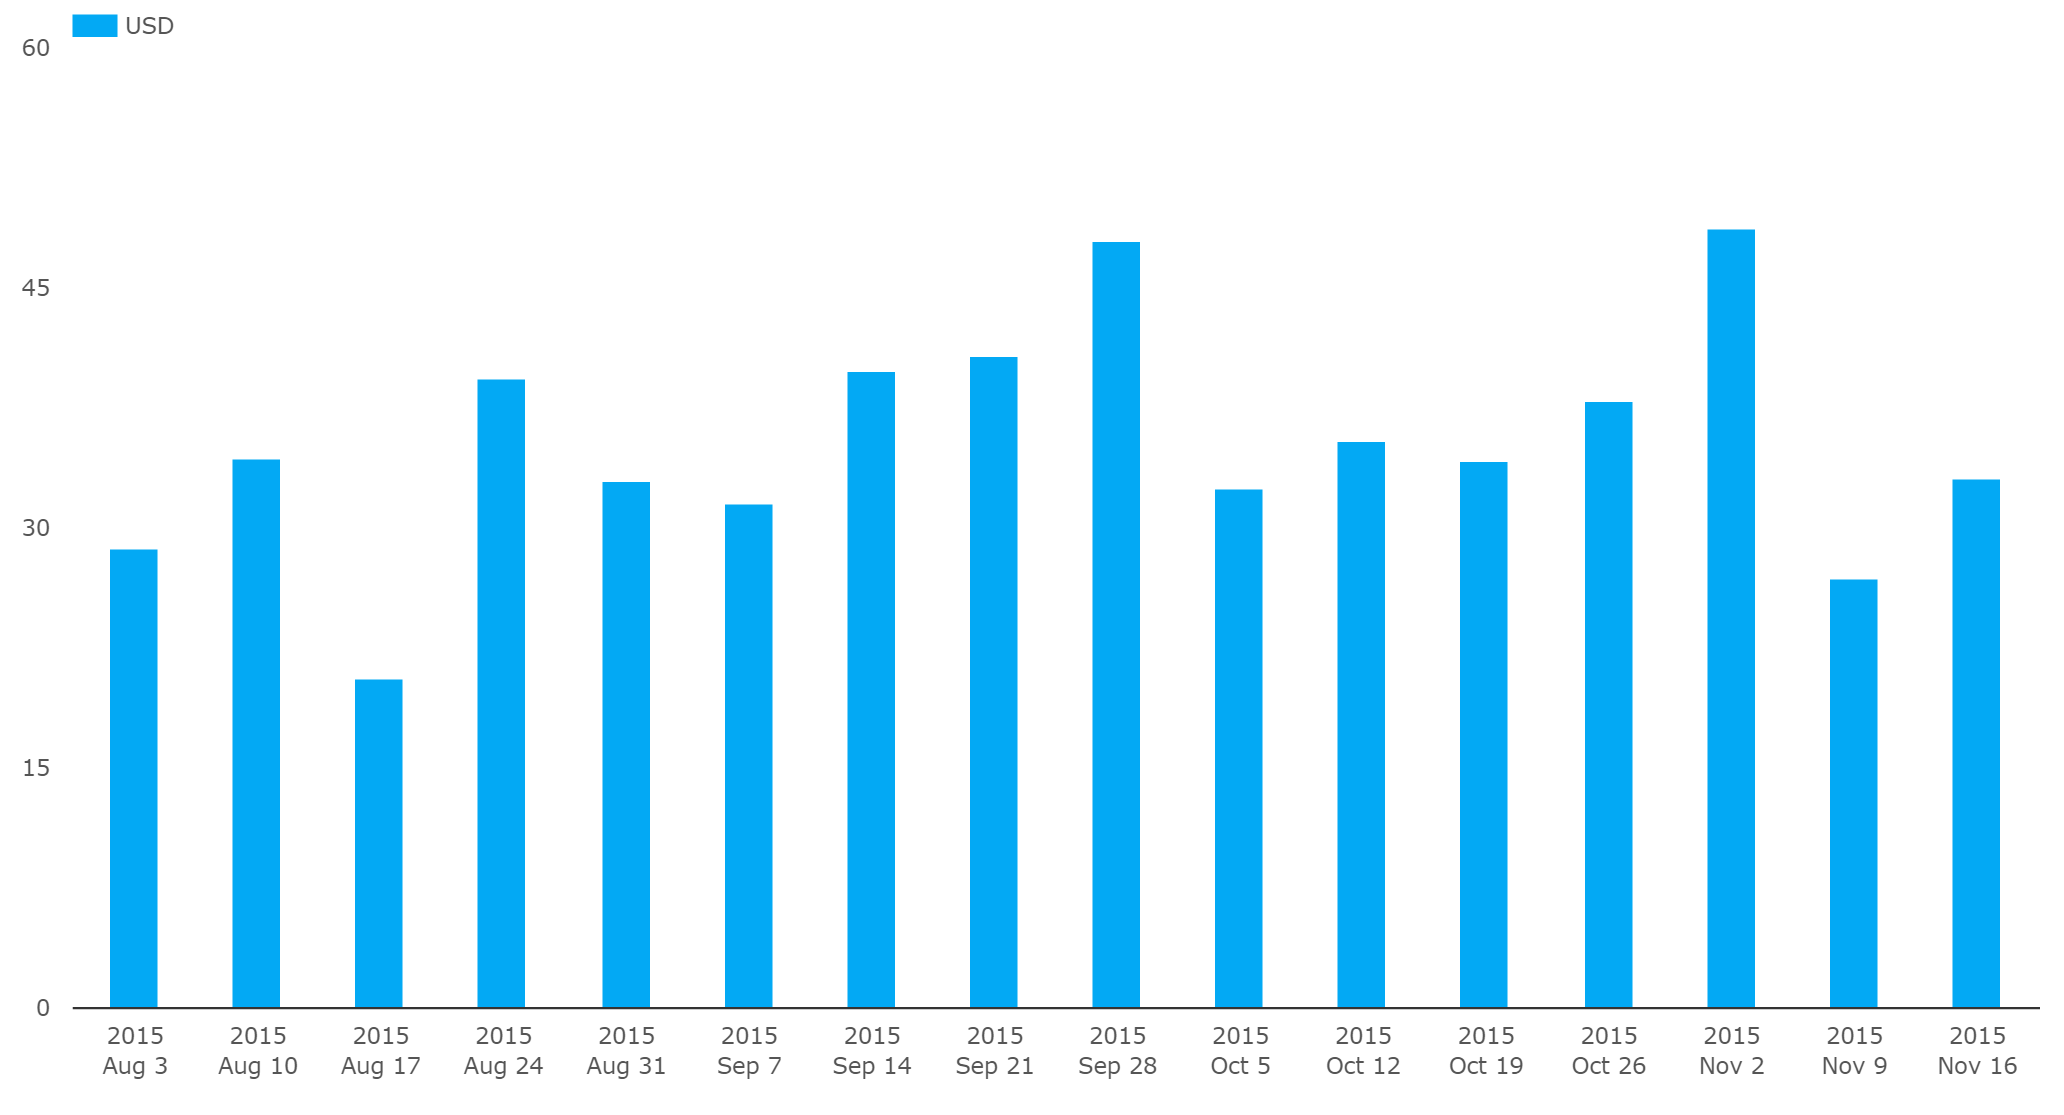
Showing:
- Week commencing November 2nd was indeed a big week, with nearly $50m in DV01 trading as Spreadovers.
- These volumes have since trailed off, despite spreads heading further into negative territory.
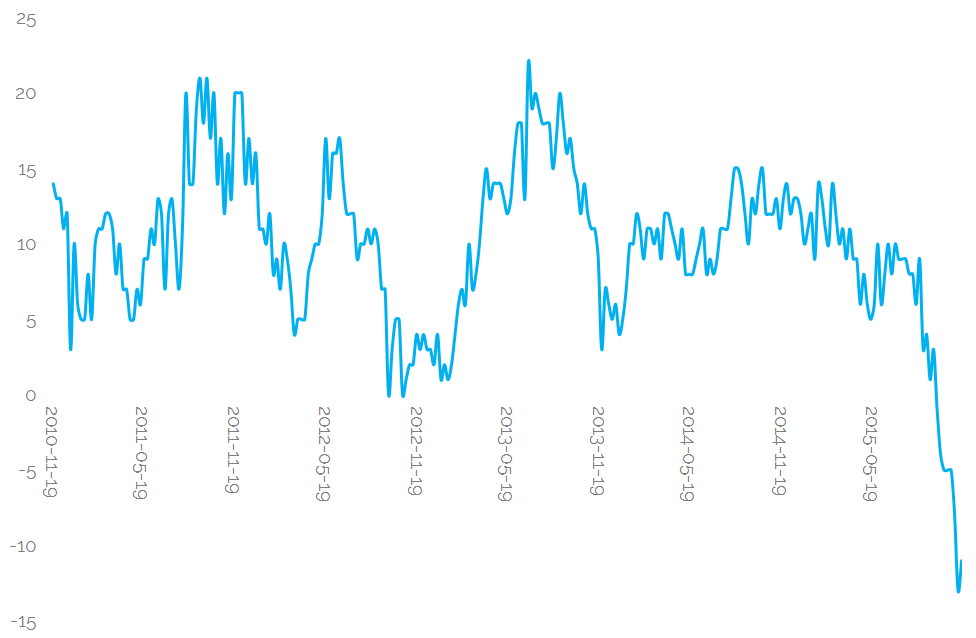
- As we can see from the graph below (implied levels from FRED), it looks like the break of zero was the key level that drove volumes up, and we’ve failed to see a meaningful bounce so far:
As the subject continues to get media attention (let’s ignore the Zerohedge articles, shall we?), I was interested to see that both Bloomberg and FTalphaville have looked at other basis rates that have moved recently. And this brings me back to my old favourite, Cross Currency Swaps.
What’s been happening there?
Using SDRView Researcher and SDRFix, we have very healthy time-series of data for both volumes and prices. First, from SDRFix, we can see that price across all maturities in EURUSD are ploughing new lows – with breaks of previous resistance levels:
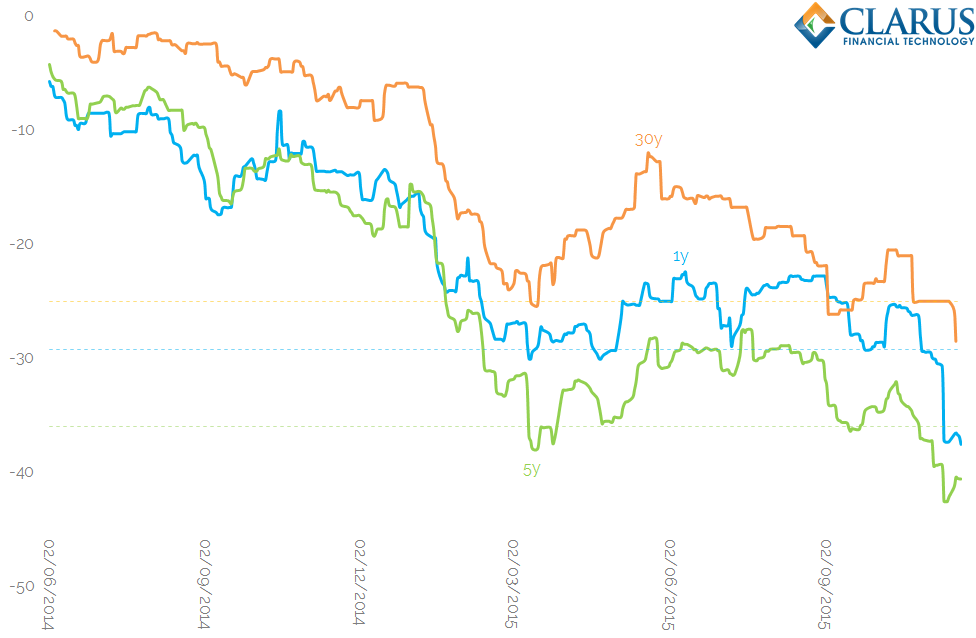
Showing:
- EURUSD Cross Currency basis prices since June 2014 for 1y, 5y and 30y maturities
- All maturities saw a significant down-move in early 2015 as a result of QE-fueled EUR bond issues from US issuers (the so-called “reverse Yankee” trend that we covered here).
- These stabilised in March (just as we published that blog…) and recovered to higher levels until the traditionally quiet August months.
- The volatility in August due to macro-economic worries over China and global growth saw a “risk-off” move that caused levels to widen…
- …and as reverse Yankees are once again the flavour of the month with issuers (particularly due to M&A activity) there has been no price floor put in place.
- …indeed, it appears that it is this latest wave of issuance activity that has caused all of the maturities to break-through the previous resistance levels put in place back in March.
So is this similar to US Swap Spreads?
The constant supply of debt issuance from the corporate World has also been put forward as a reason for negative swap spreads. And of course, there is the fact that only one leg of the spread is funded (a good blog here on that, plus our comments section!).
But if we look at Cross Currency swaps, we are being told a familiar tale that there is a premium to raise USD funds in the form of cash (vs USD Libor in this case). This premium now stands at multi-year highs, and on the back of a move supported (or caused?) by impressive volumes.
Volumes
Using CustomView in SDRView Res, we can see the volumes traded by US Persons and reported to SDRs. Using these as a proxy for the market as a whole, we can see that volumes are healthy, but not breaking any recent records:
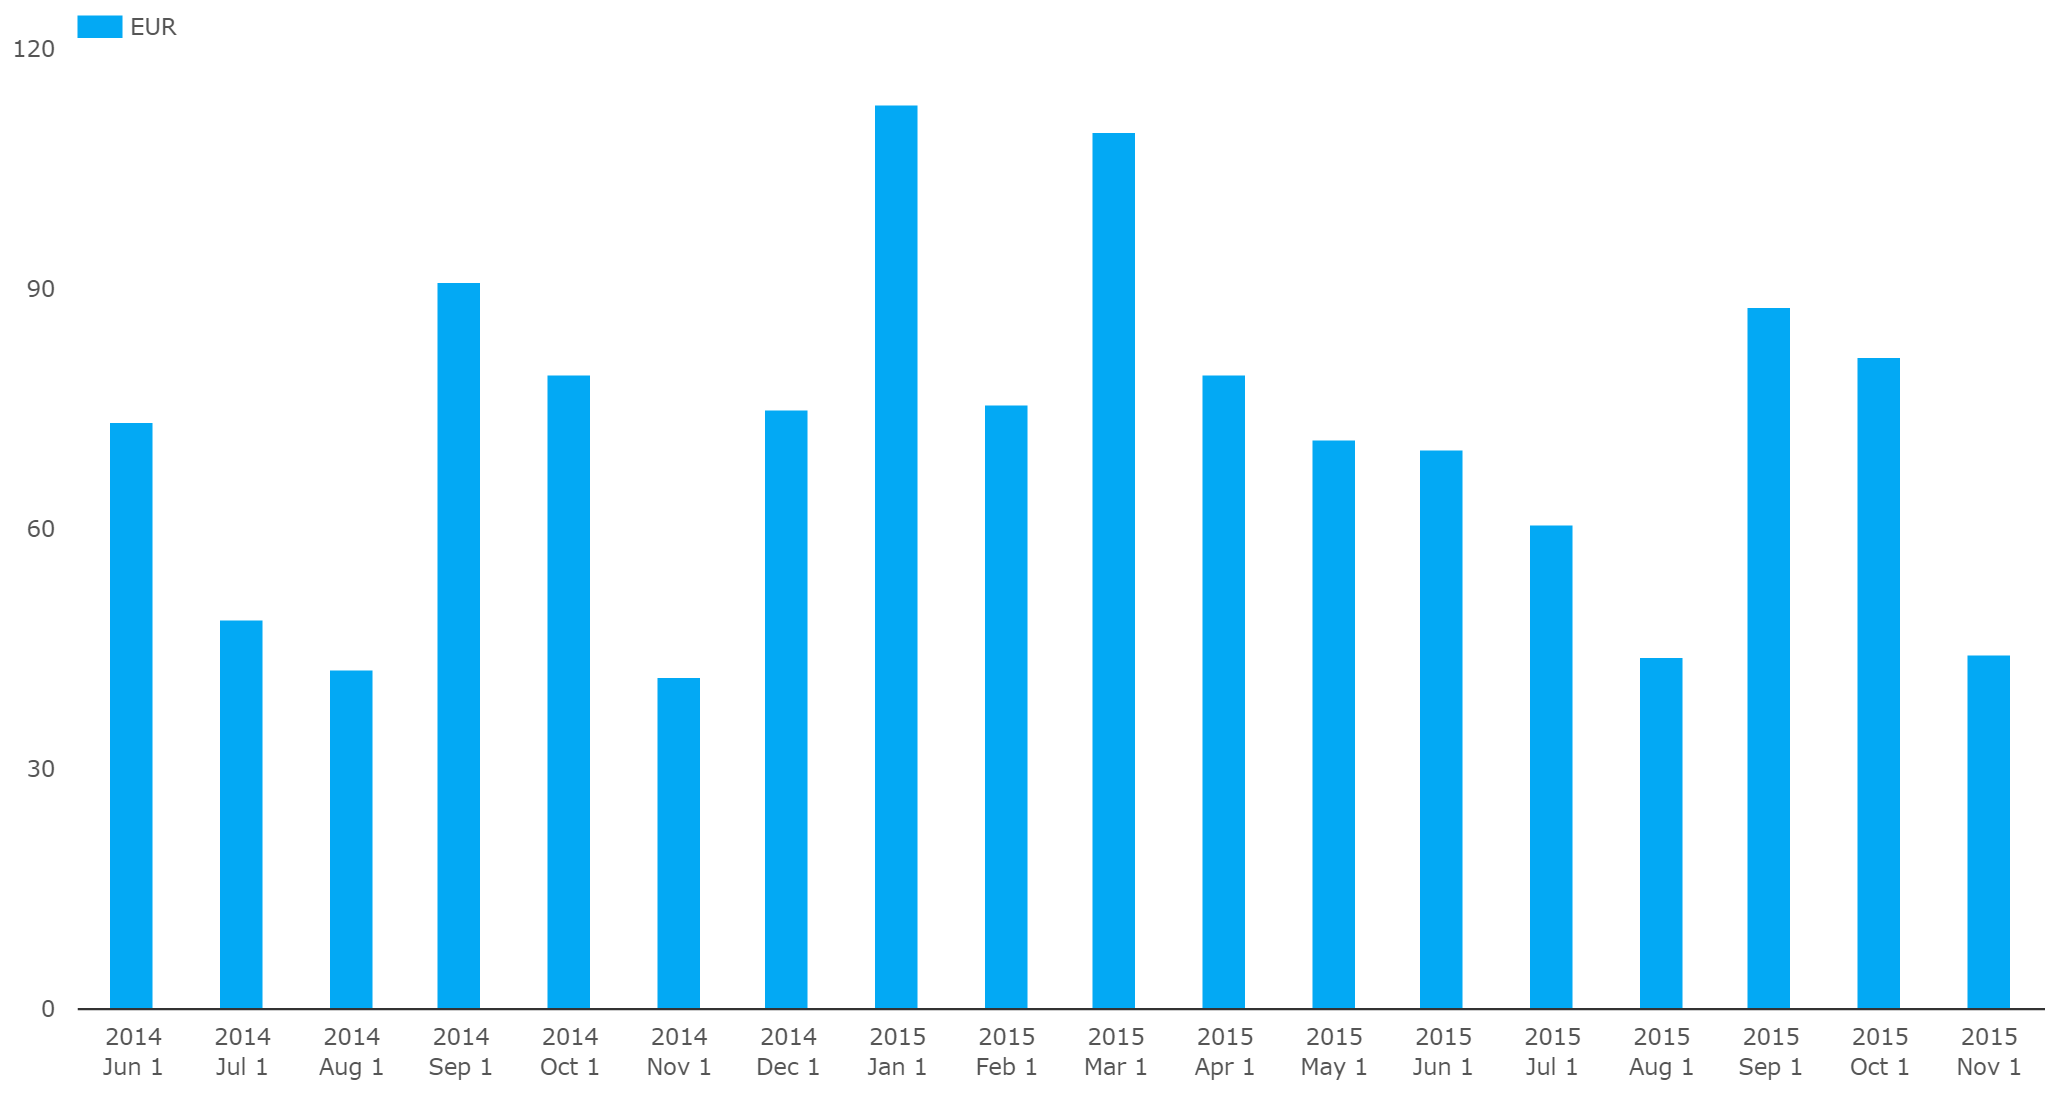
But there are further interesting points when we look at the combination of Price, Volume and Time. As we said at the top, prices started to drop in August. Rather than finding a base, the move has continued lower. And at first look, we see volumes have tended to grow as prices moved lower:
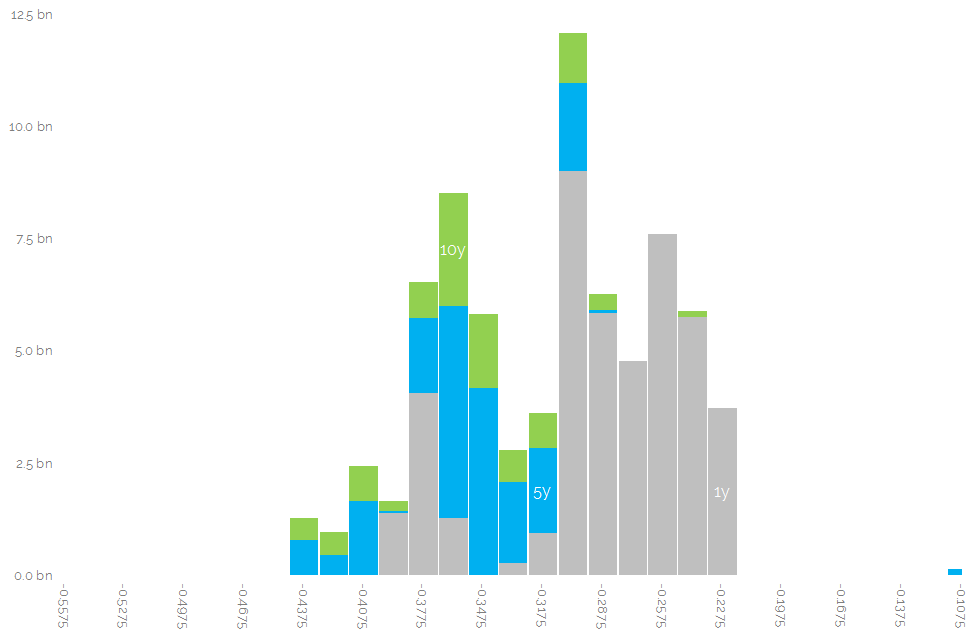
Showing;
- A spike in 1 year EURUSD volumes as prices went through -29.5bp, our support line for so long.
- A large chunk of 5y EURUSD trading as prices went through -35bp, again breaking the support.
- With a similar level in 10 year EURUSD (-35bp) also leading to more volumes.
Volumes, Price and Time
When we look in more detail at the evolution of e.g. 5 year EUR/USD trading with time, we start to see a slightly different story. In a similar manner to swap spreads, volumes seem to have peaked at key levels (in this case, long-term support levels) but are beginning to tail-off at these even lower levels.
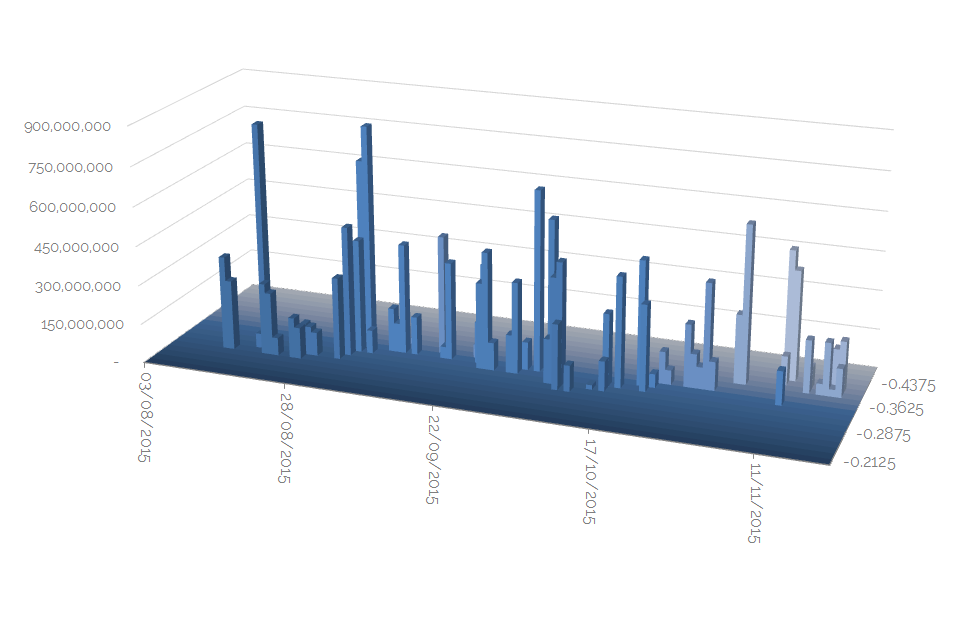
Showing:
- Volume, Time and Price of every EUR/USD 5 year trade that has been reported to the SDRs since August.
- As we can see, there was a healthy clustering of volumes at both the beginning of September and the beginning of October at the key price levels.
- That’s consistent with both the support we saw in September, followed by the break of the key level in October.
- Volumes since that break have, generally speaking, not been as high. It looks like any counter-trend positions are not being put on with strong conviction just yet.
- The same is probably true when we look at a long-term Spreadover chart like this (albeit that would have a lot more data!).
In Summary
- We can see that volumes in both Spreadovers and Cross Currency Basis swaps have peaked this year around certain key levels.
- Whilst Spreadovers continue their move into more negative levels, we haven’t seen anything concerning in the volumes during their continued move south.
- As levels in Cross Currency Basis swaps continue to widen, this represents a marked demand for funded USD Libor exposures…..
- In the past, we would have expected this to go hand-in-hand with widening swap spreads as credit gets tighter…
- …but this time it appears that balance sheet pressures mean it is now preferable to swap long-term USTs into unfunded USD-Libor streams, resulting in a negative swap spread.
- Although, that is not the whole story as repo rates are now higher than unsecured borrowing, which is also contributing to the negative swap spread.
- If we try to think of Cross Currency swaps as collateralised USD Libor borrowing, with the collateral simply in a different currency, perhaps we can see a consistent story….
- …but I’m more tempted to think this is a flow story, where the persistent issuance of debt and the desire for floating rate exposures has simply continued to move both of these basis levels south.
- And as the CCP Basis blow-out has shown, you need to stay on top of volume data to know when another move wider may be just about to happen!