In this article I will look at Interest Rate Swap data volumes and trends in the first half of 2014.
This period includes both the start of mandatory SEF trading of IRS (February) as well as the expiry of package trade exemptions (May/June).
USD IRS Volumes
Lets start with On SEF USD IRS plain vanilla volumes by month in SDRView Res.
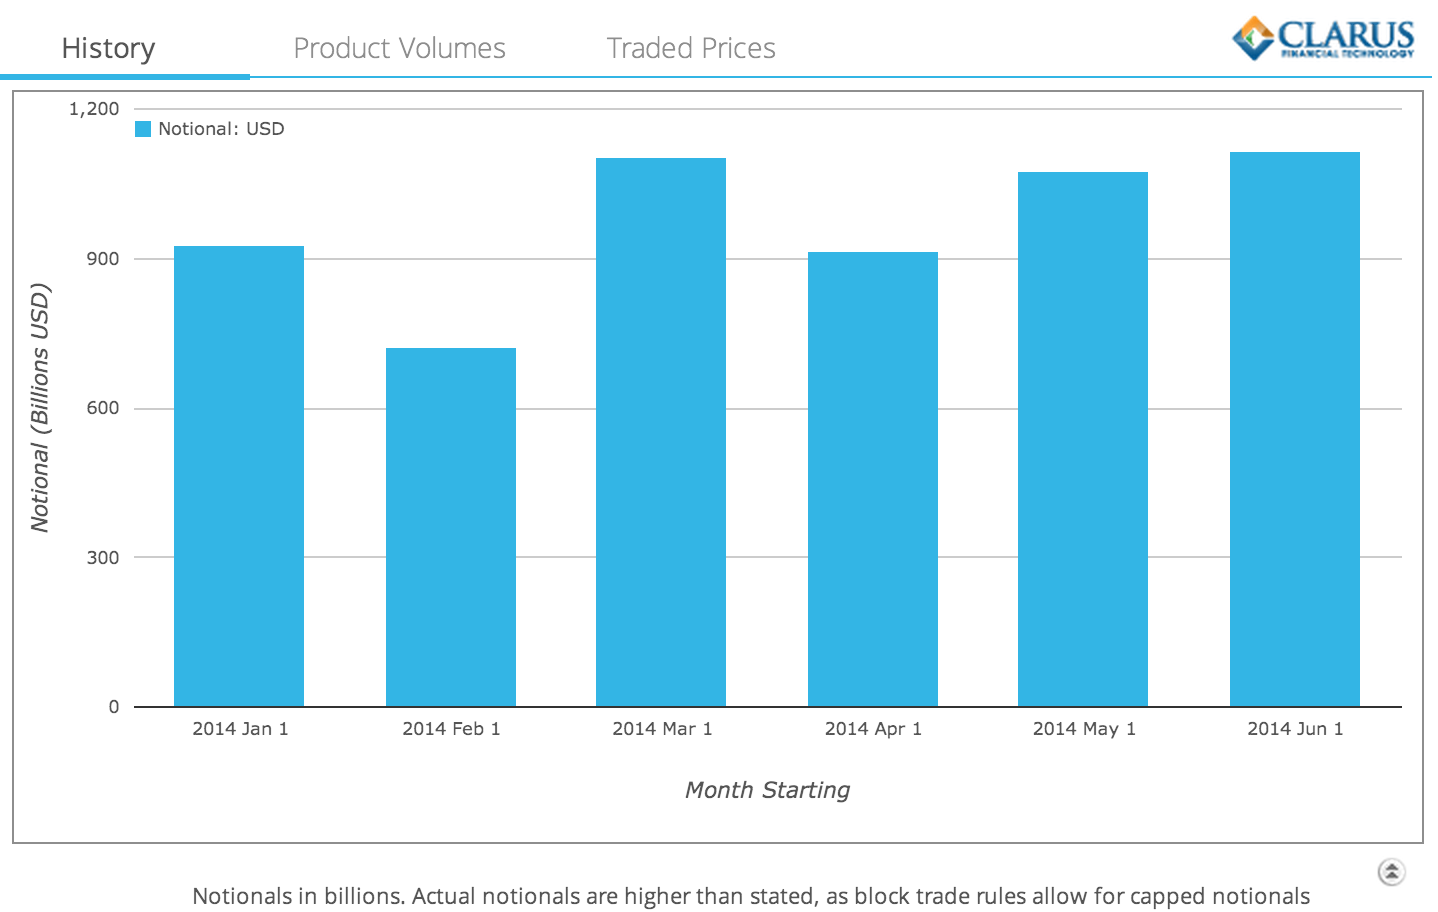
Which shows that after a dip in February, volumes have steadily increased allowing for the higher volume in March (financial year end?). In-fact June is the highest volume month with almost $1.2 trillion of gross notional traded. While the figures in the chart are understated due to block trade rules, using SEFView we can get the actual figures reported by the SEFs. These show that June was $1,250 billion and March was $1,230 billion.
Lets now look at the Off SEF volumes for the same period.
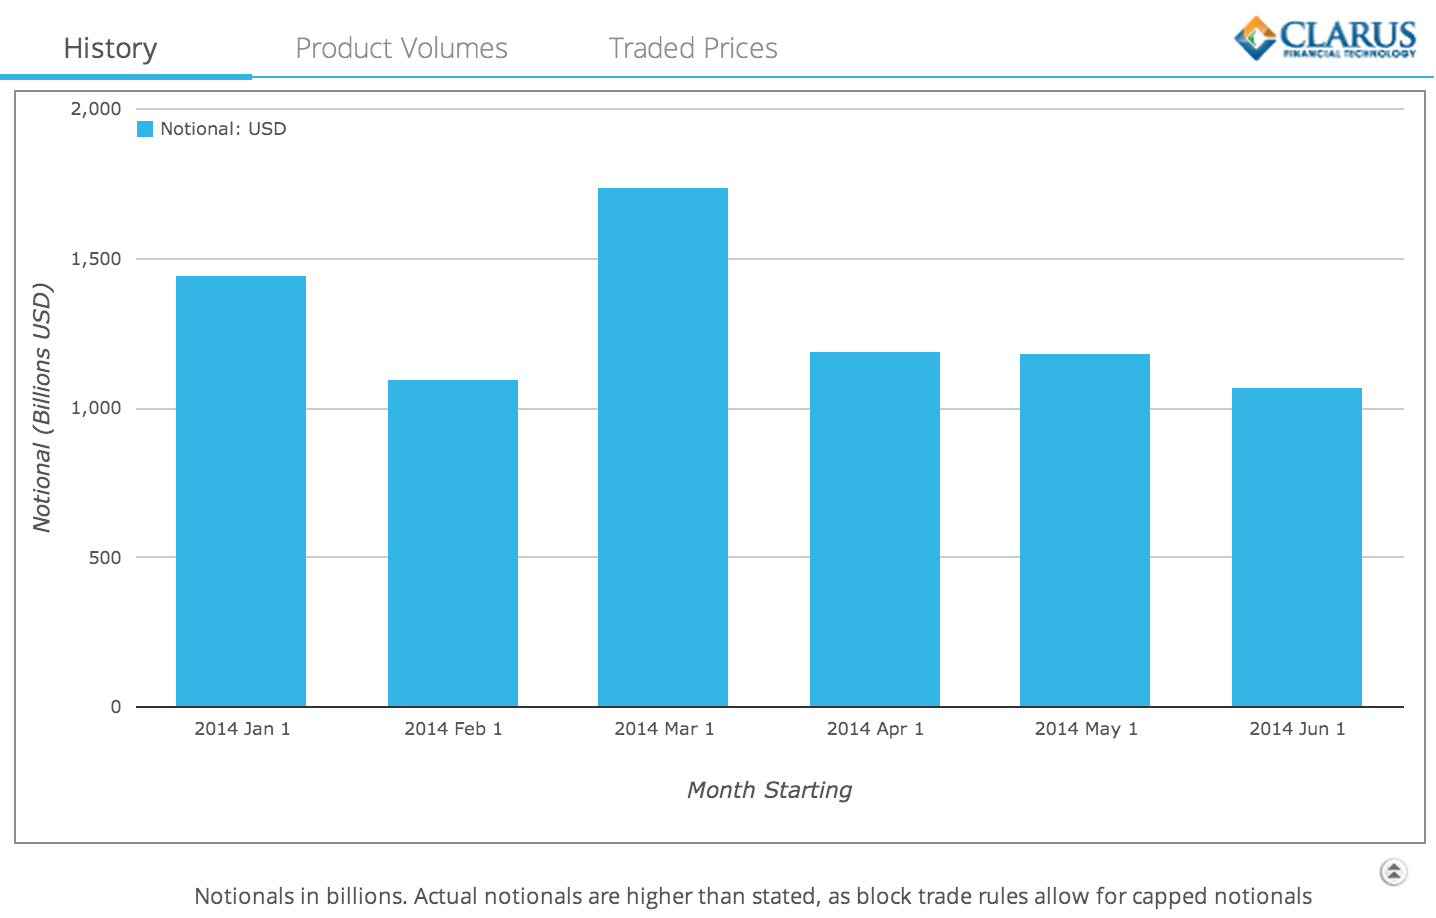
These show a similar trend except that now for the last three months there is a gradual decline in volumes. As June 16 was when spread over treasury swaps were no longer exempt, we would expect to see even lower Off SEF volumes in July.
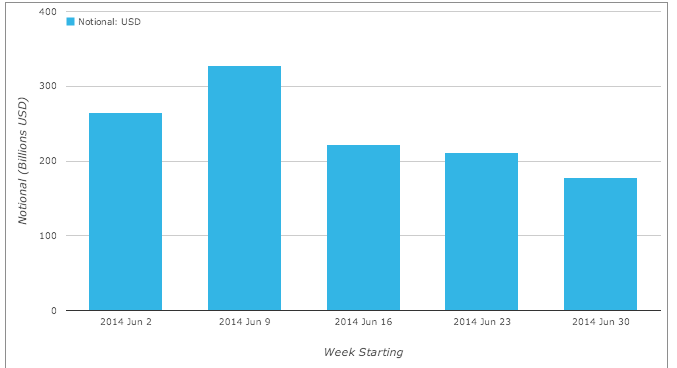
This can be seen in the Off SEF USD IRS Volumes by each week in June:
USD IRS Prices
We hear a lot about volumes being subdued in the markets as volatility is at a historic lows given central bank influence. So lets look at what Swap rates have done over the period.
Using SDRFix we can see the change in rates between Jan 1, 2014 and Jan 30, 2014.
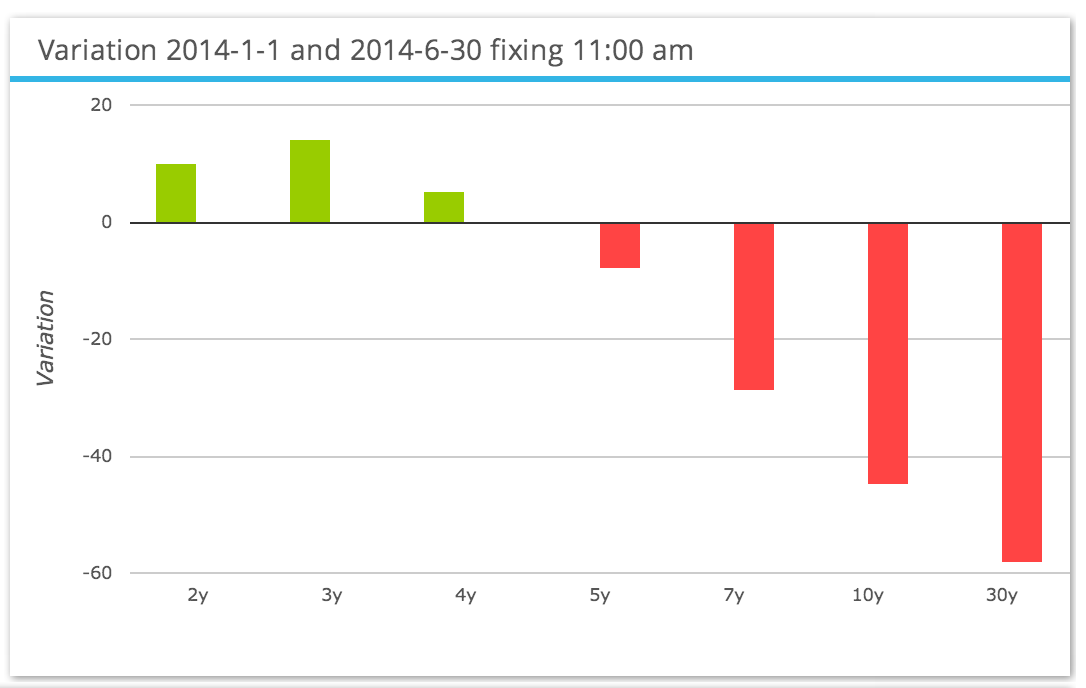
This shows that:
- The curve has flattened over the period
- The short end rising 10-14 basis points
- The long end falling 58 basis points
Plotting the daily values for the 30Y Swap Rate shows the daily evolution of the rate from 3.90 to 3.32.
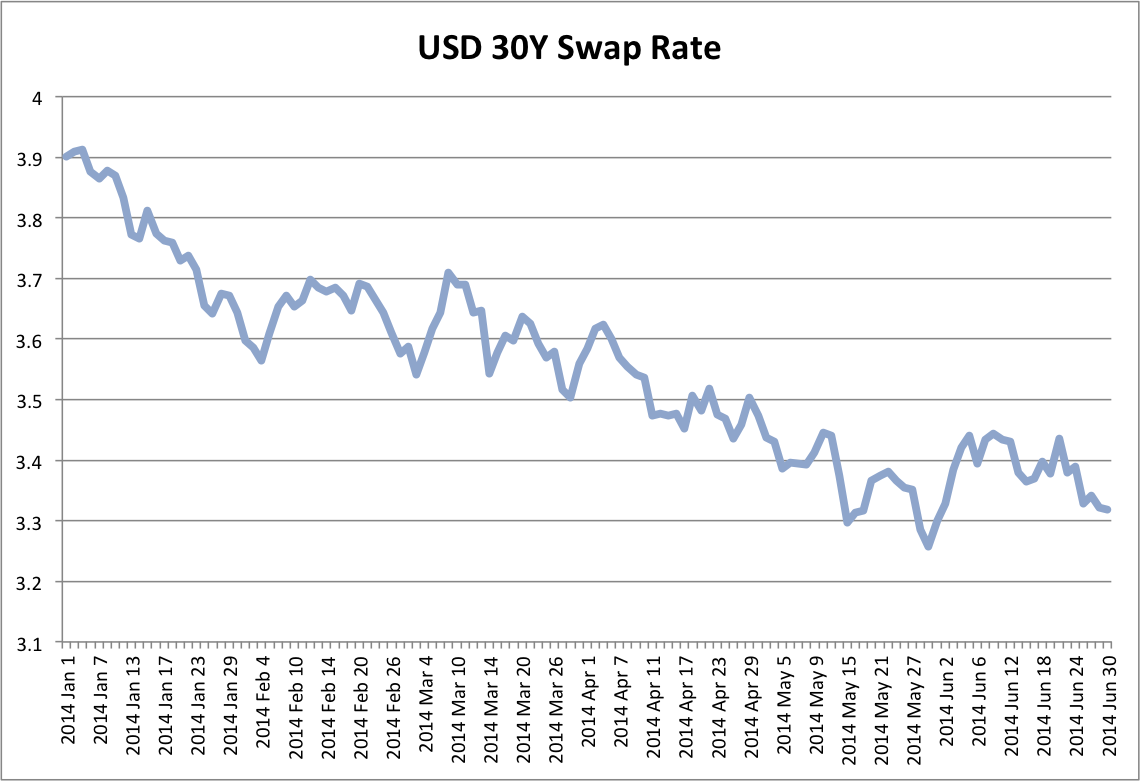
By no means would we call this a period in which nothing happened to Swap rates!
Percent On SEF vs Off SEF
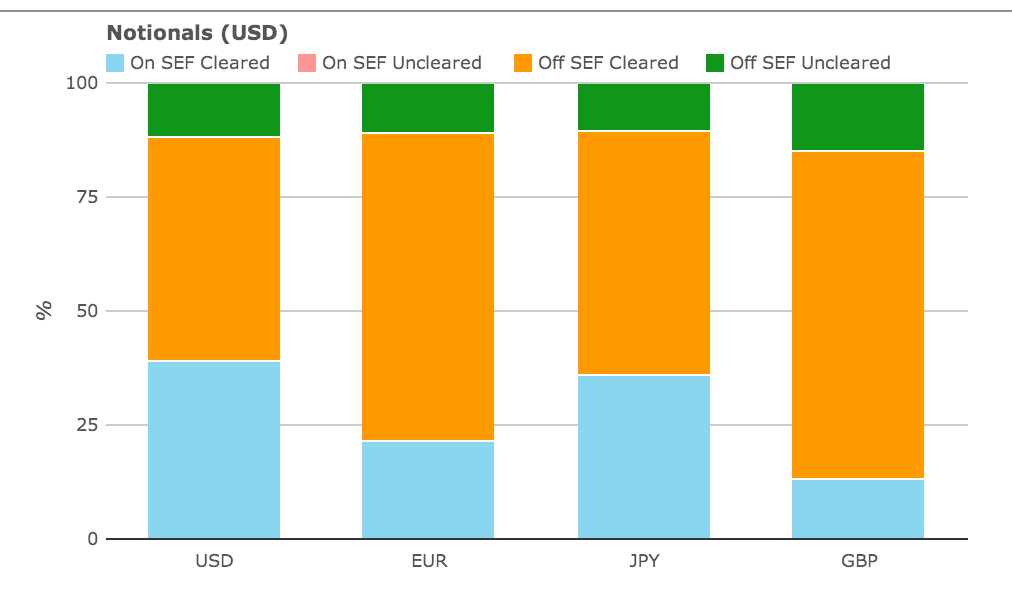
It is interesting to compare On SEF vs Off SEF volumes in January vs June for the four major currencys.
First January:
Then June:
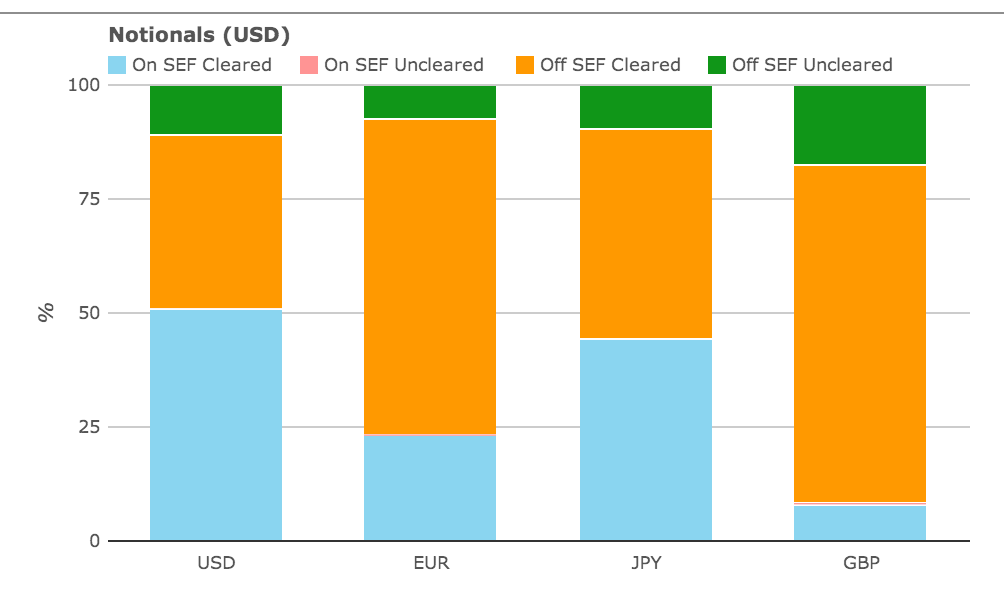
From which we can see that for USD:
- On SEF Cleared has increased from 39% to 51% of total volume
- Off SEF Cleared has decreased from 49% to 38%
- Off SEF Uncleared is similar at 12% vs 11%
The trend is as we would expect given the expiry of package exemptions in May and June.
It means that 57% of Cleared USD Swaps were traded On SEF in June. A figure we expect to plateau at 60% in July as the majority of remaining trades are forward starting swaps that are not MAT dates or tenors.
A quick look at the other currencies is also interesting:
- EUR and GBP show no meaningful increase in On SEF volumes
- So the drop in volumes of these we saw in 4Q 2013 remains in place
- JPY shows an increase in On SEF Cleared from 36% to 44%
SEF Market Share
And what of SEF market share in USD IRS Fixed vs Float?
This has changed markedly over the period, as the chart below of USD 5Y Equivalent volumes shows.
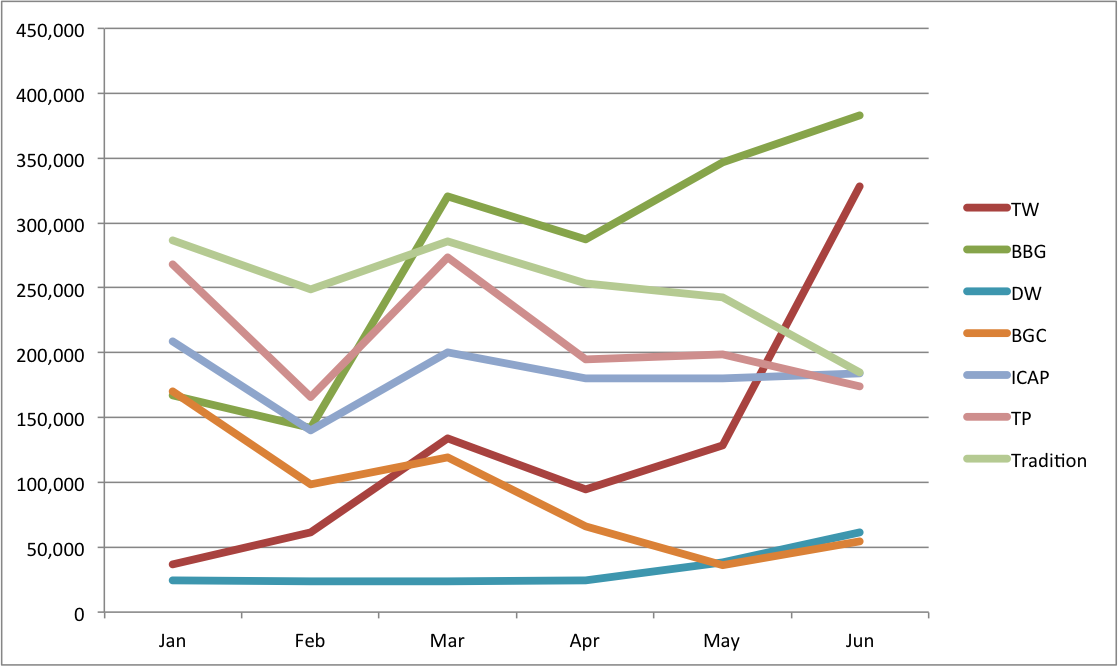
Which shows that:
- Bloomberg having risen to the top in March has continued to pull away from the IDBs
- Tradeweb had a huge June month (package relief?) and is now a close second to Bloomberg
- (Will this continue? The eights days so far in July are not conclusive)
- Tradition, Tullets and BGC have all lost market share over the period
- ICAP is flat over the period, perhaps the change to IGDL has helped in stopping a decline
- Dealerweb shows an increase in the last two months
June market share percentages then are as follows:
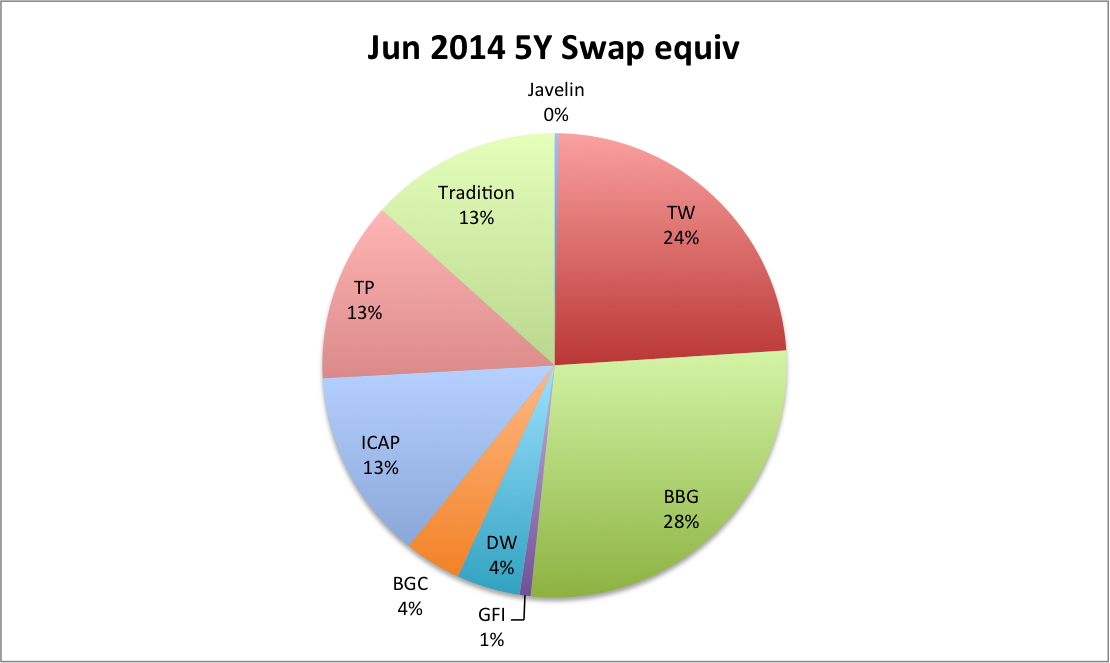
Showing that:
- BBG and TW, the two D2C SEFs together represent 52% of the volume.
- ICAP, Tradition, Tullets, the three D2D SEFs, each have a 13% share
- BGC and DW each have 4%, while GFI has 1%
- Javelin, TrueEx and Others do not have material volume at this point
Summary
From Jan to Jun 2014, On SEF USD IRS Volumes have continued to increase.
While Off SEF have continued to decrease.
June was the highest volume month in 2014 with $1,250 billion traded On SEF.
57% of Cleared USD Swaps Fixed vs Float were traded On SEF.
July should see a further increase in On SEF to 60%.
The Swap Curve flattened over the period, with short end up 10 bps and the long end down 58 bps.
Bloomberg and TW (D2C SEFs) gained market share to represent 52% of volume.
The IDBs (D2D SEFs) lost market share over the period.
It would be interesting to look at volumes and share in other products (OIS, Basis, Swaptions) and other currencies (G4, LatAm, Apac).
I will leave that to those of you that are interested.
Just login to SDRView and SEFView and see for yourself.