- Time to re-acquaint ourselves with the world’s 4th/5th largest cleared swap market – the mighty Aussie dollar.
- August is traditionally a quiet month, so does quality come to the fore when execution is more difficult in thin markets?
- About 30% of new risk is transacted on a SEF. We take a look at the volumes.
How Large is the SEF Market in AUD?
Look away now from this week’s blog if you don’t like data or charts. I will throw out quite a few figures this week from the AUD swaps market.
First up – how much traded on-SEF in August 2017? Take this first chart with a pinch of salt…
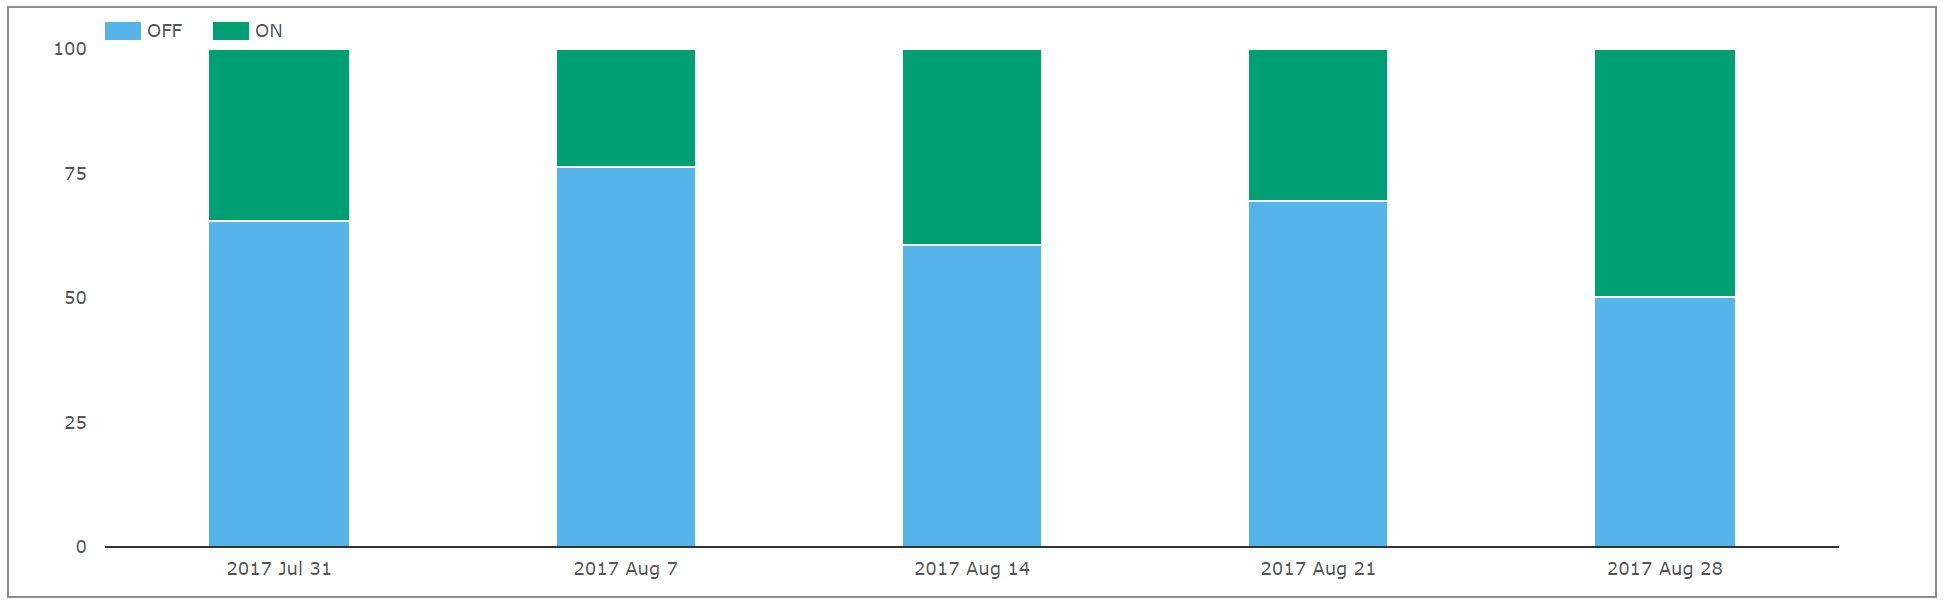 Showing;
- In notional terms, the split of weekly volume transacted on-SEF.
- On-SEF activity can account for up to 50% of volumes in any given week.
- For the month as a whole, 37.5% of notional was transacted on-SEF.
- That is an impressively high percentage of on-platform trading for a currency outside of an execution mandate.
- For reference, in August 2017, 62.4% of USD notionals were transacted on-SEF.
What is Trading On-SEF?
It is worth bearing in-mind the market structure in AUD. Due to the difficulties that internationals have in settling same-day AUD payments, FRAs do not really trade. Instead of FRAs, the market trades Single Period Swaps – economically equivalent (allowing for discounting), but settled at maturity of the trade as opposed to on the fixing date. This means that we see a lot of Single Period Swaps (which are FRAs for all intents and purposes) coming through in on-SEF trading volumes (thanks to the volume matching auctions run by ICAP’s Reset and tpMatch).
To make it easy for users to include/exclude these volumes (as they are associated with portfolio maintenance rather than price-forming transactions) we flag all Single Period Swaps as “List” traded. This is the same for JPY as well.
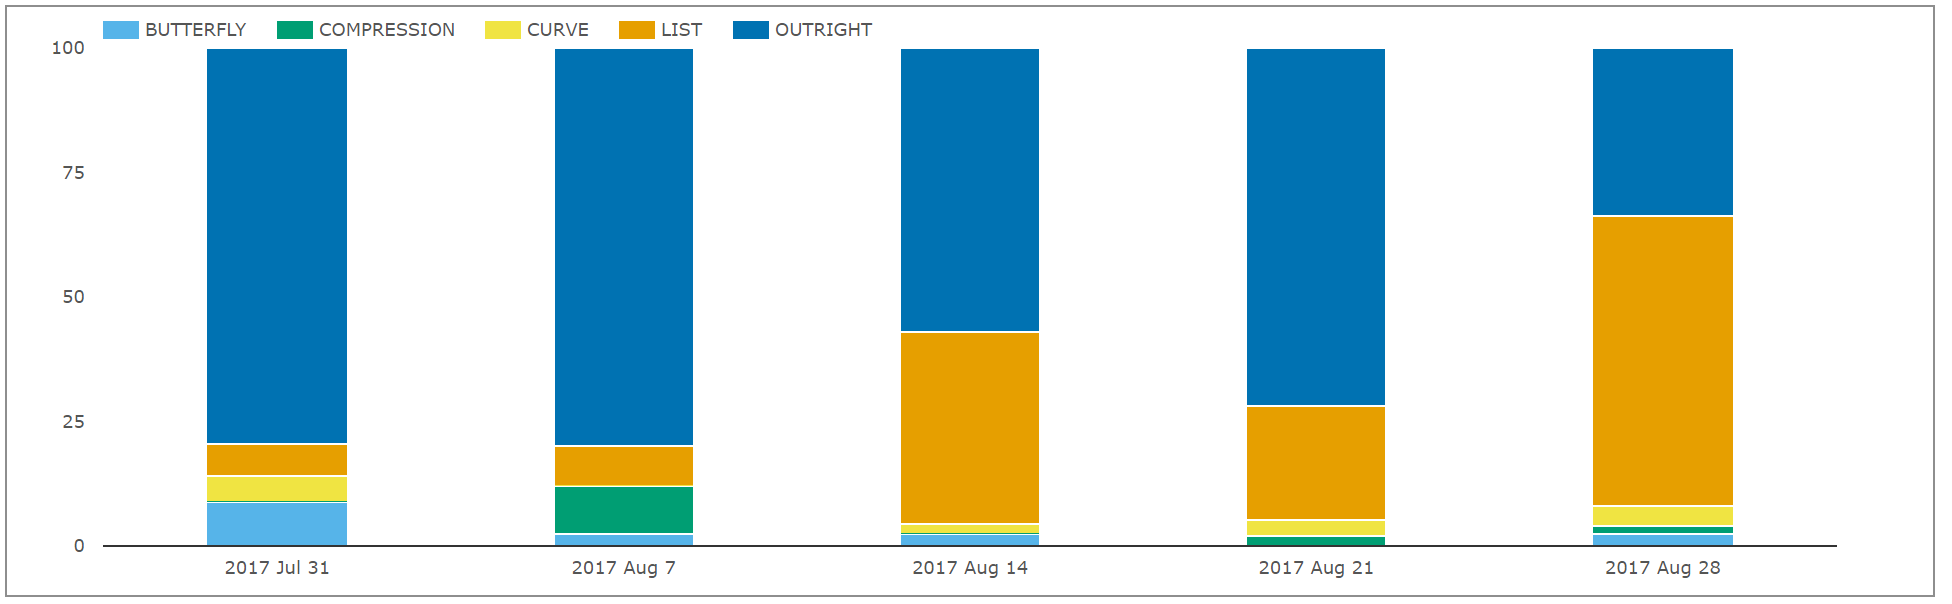
Showing;
- As we suspected, some large volumes are related to List trading and are hence large notional, short-dated FRA volumes in reality.
- Over and above these, we can see the dominance of Outright swap trading.
- Very few Butterflies, Curve trades or even Compression runs are identifiable in the AUD data. This paints a very different story to USD markets where we flag over half of all trades with some type of package.
Let’s Exclude List Trades
Excluding List trades from the first chart is a more accurate reflection of market activity on and off-SEF:
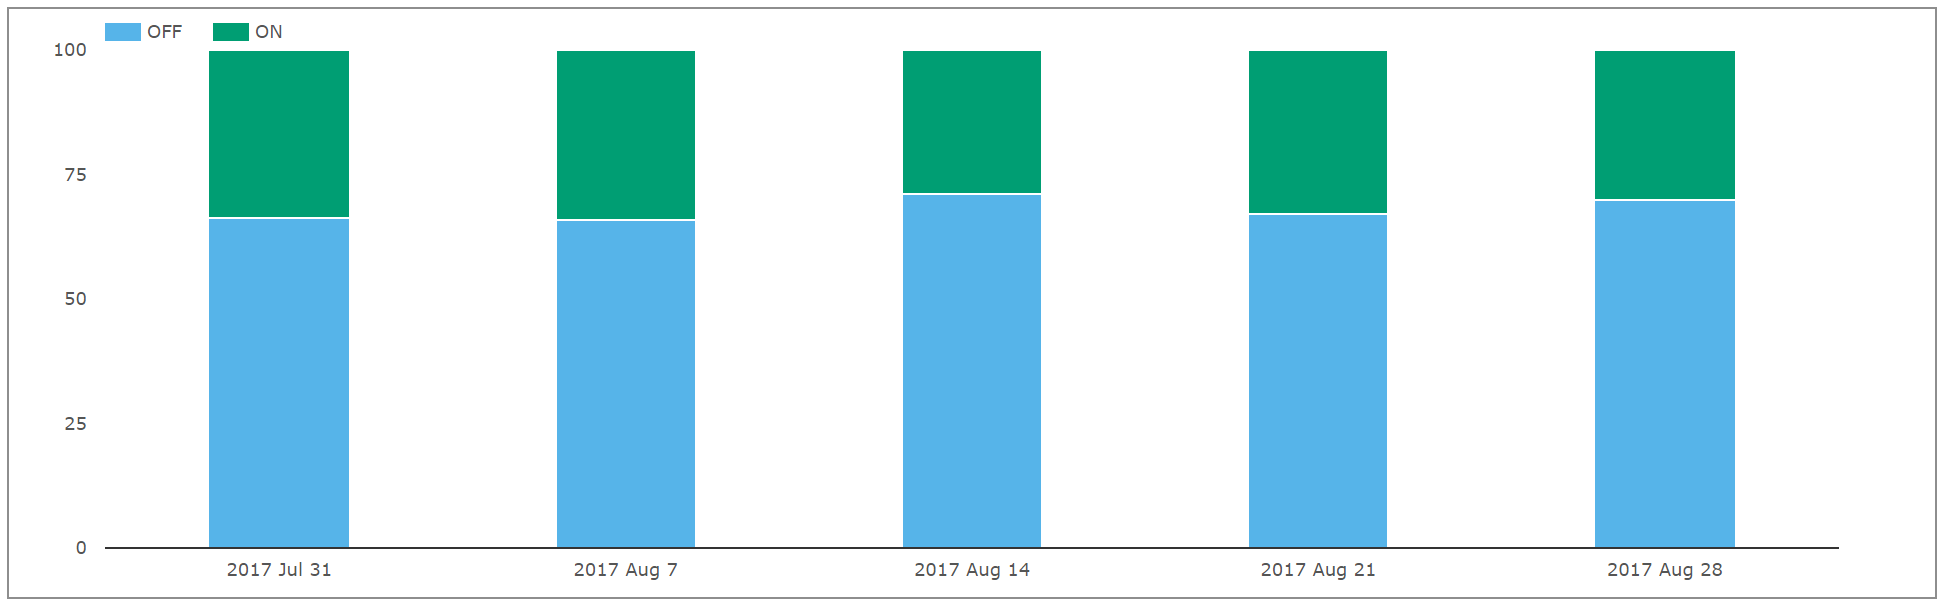
Showing;
- A consistent proportion of around 30% of new risk traded is transacted on-SEF.
- This feels more in-line with anecdotal evidence from our clients.
Let’s Look at the Tenor Profile
Is there a preference to transact long dated trades off-SEF and short-dated trades (including single period swaps) on-SEF?
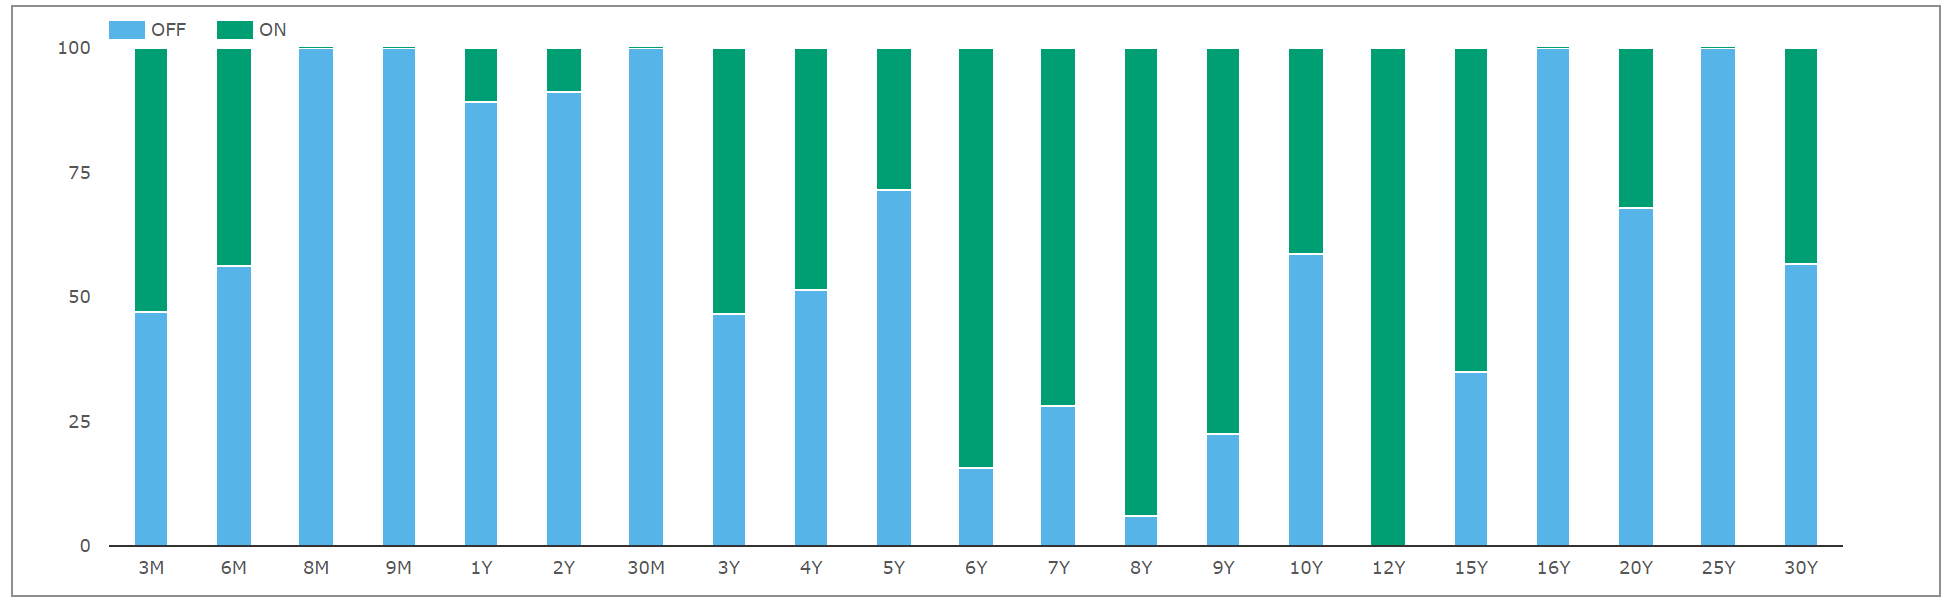
In theory, shorter dated instruments are more liquid, more easily standardised and therefore more suited to one-size fits all execution methodologies. Therefore, we should see a tenor bias in SEF trading right? Our chart shows the opposite for AUD trading in August 2017:
- 81% of risk shorter than 2 years was traded off-SEF.
- 60% of risk between 2 and 5 years was traded off-SEF.
- 47% of 5-10y risk was traded off-SEF.
- 38% of 10-30y risk was traded off-SEF!
Maybe this suggests a bias towards internationals (Americans) being more active in longer dated markets? It would be interesting to look at this trend over time….one for our users to drill into.
Who are the large SEF players?
Which SEFs have the largest volumes? Again, we’ll keep to August 2017 data for our snapshot:
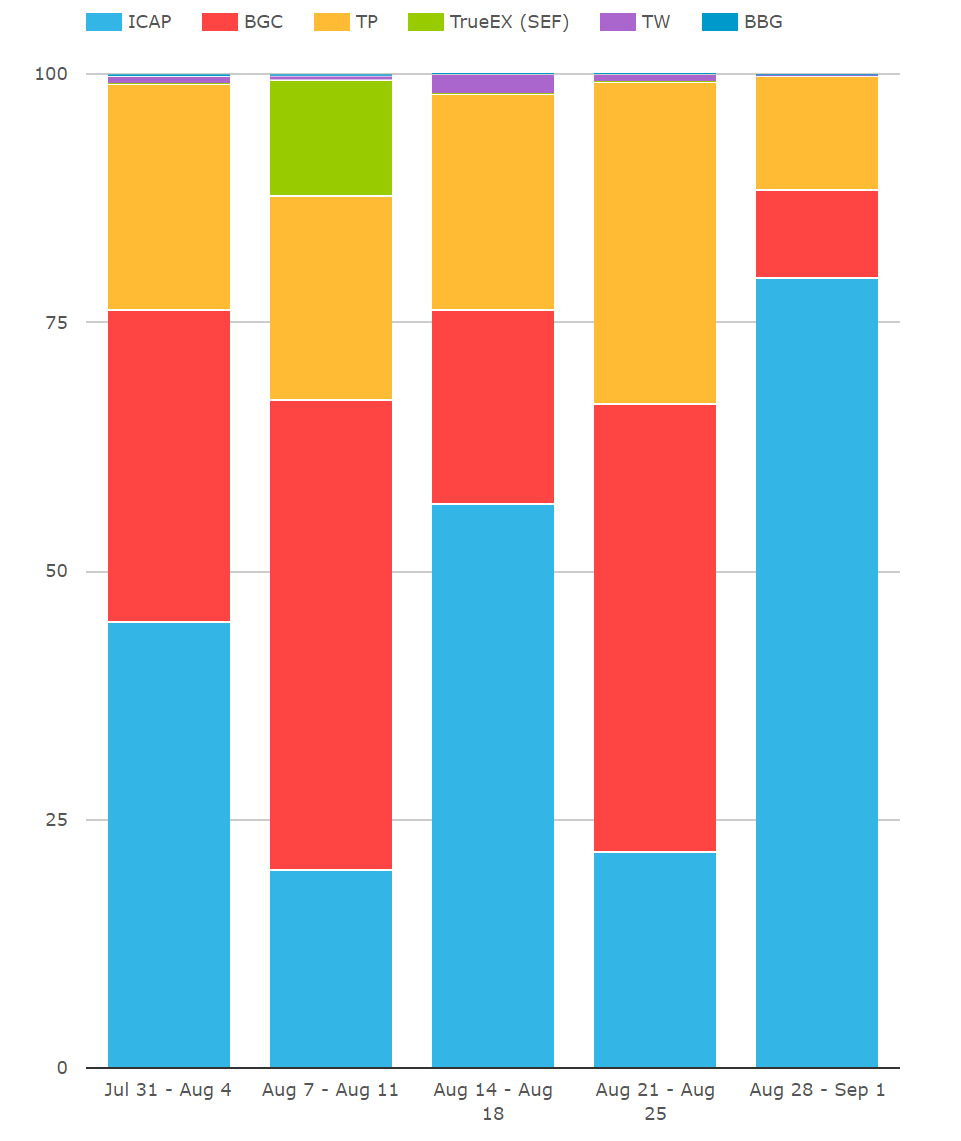
Showing;
- The weekly market share (by notional) of each SEF for vanilla, Fixed Float AUD IRS.
- Remember that these numbers include Single-Period-Swaps, hence ICAP show a large spike in market share during the final week when there was the large Reset run mentioned previously.
- ICAP, BGC and TP consistently have the lion’s share of the market.
- Over and above this there are two interesting observations to make.
- Unlike USD swap markets, BBG and Tradeweb have hardly any volume. This is clearly not a Dealer to Client market. Almost all on-SEF volumes in AUD are inter-dealer.
- TrueEX show a significant volume in the middle of the month. These are flagged with “SEF Package” as a mark-up, so consistent with our previous analysis, we assume these are Compression related. Great to see the innovation in this space.
D2C SEFs – what is the story?
I would love to hear from our readers any thoughts on why the D2C SEFs do not have much success in AUD markets. It is in stark contrast to markets where an execution mandate exists. Is this the sole reason or something more structural? One to ponder…..
Trade by Trade analysis – combining SDR data with SEF data
Finally, a note on the sheer number of vanilla trades reported to SDRs in AUD swaps:
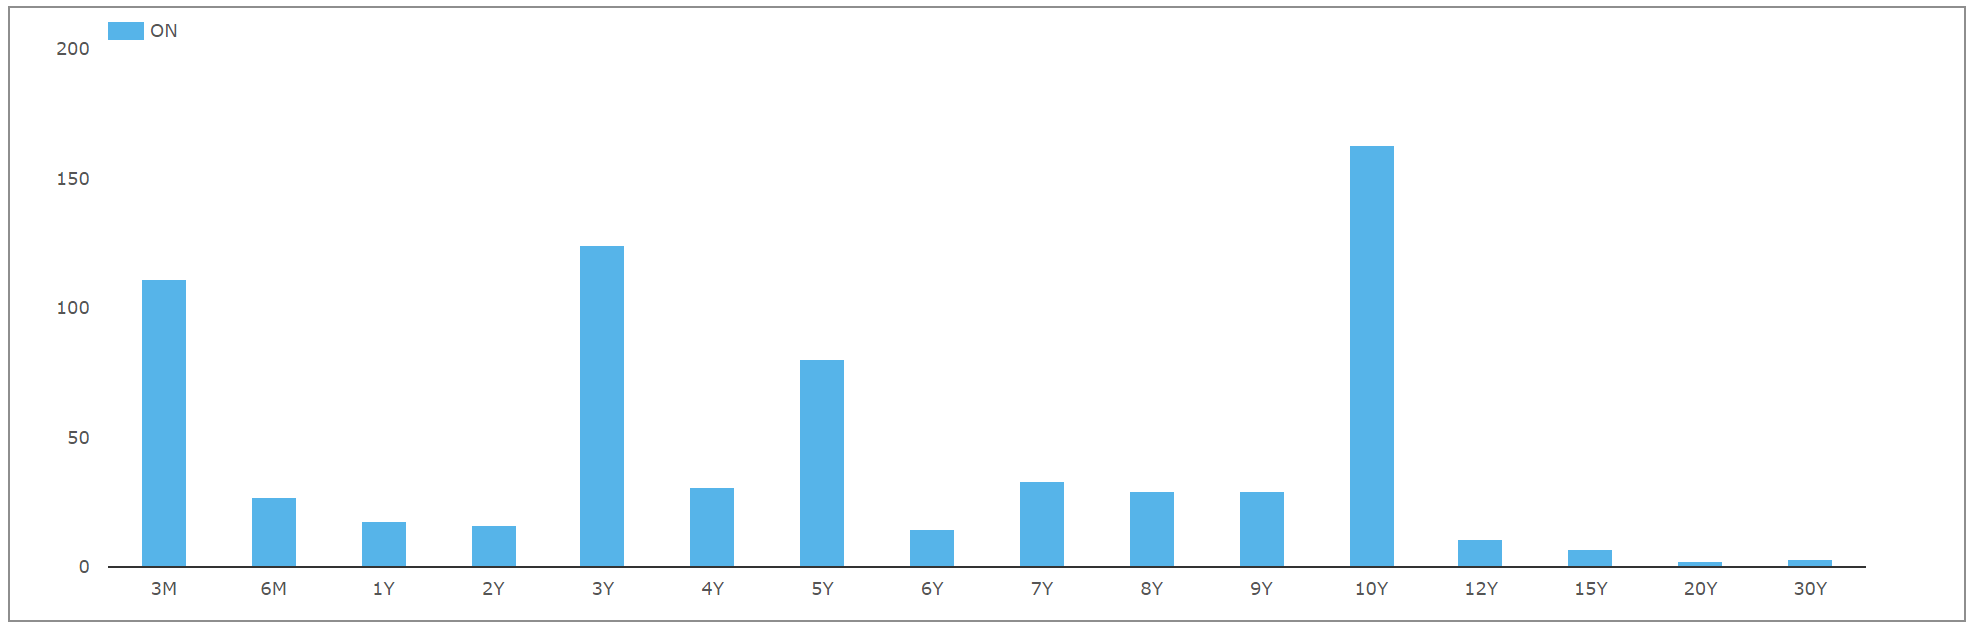
The AUD swap market is really diverse. Have a look at the above chart which shows the number of trades transacted per tenor bucket on a SEF during August 2017. There are peaks in frequency for 3m, 3y, 5y and 10y tenors, but never more than 200 trades in a single tenor. There were 699 trades reported in total.
When we look at the SEF data, we see 395 different volume reports from the SEFs. This means that to track SEF data via SDR trade-by-trade data, we have to match 699 trades to 395 possible SEF combinations. This is fairly straight-forward. Particularly when you consider the in-depth mark-ups that SEFs also provide for AUD swaps:
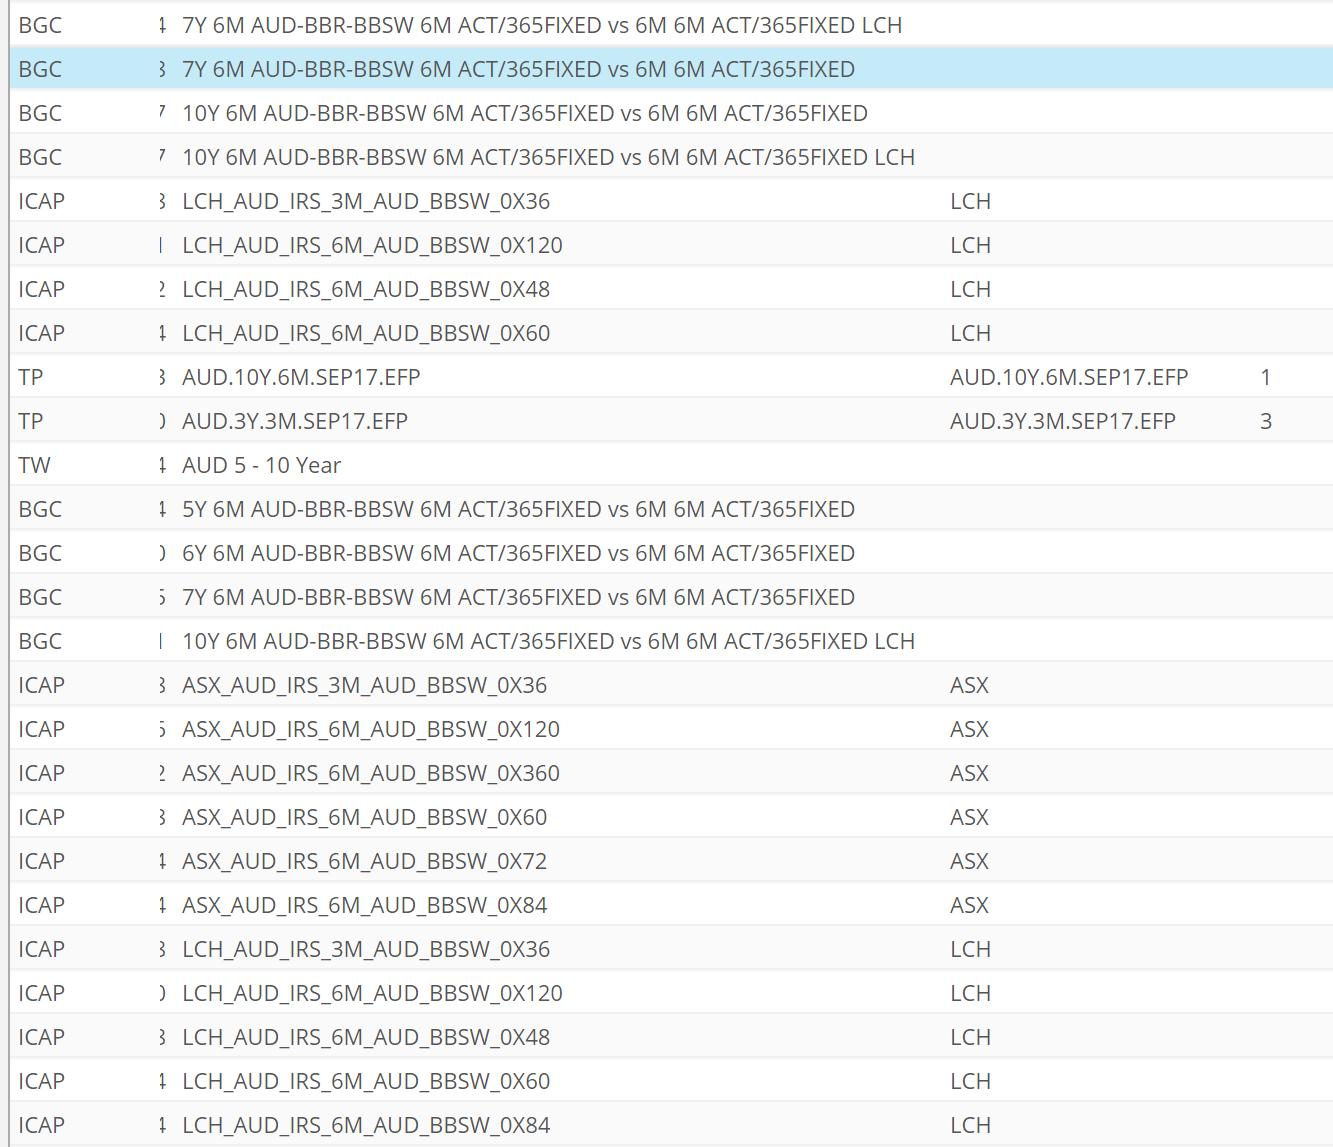
Meaning;
- Data augmentation can work both ways but it is most intuitive to think of flagging SDR trade-by-trade data with the SEF venue on which it was transacted.
- Over and above this, using SEF data allows us to also flag (in some cases) the CCP it was cleared at – LCH or ASX.
- We can also easily spot Single Period Swaps.
- We can even note if the trade was transacted as an EFP – an invoice spread versus one of the bond futures traded in Australia.
Overall, combining the data sources allows enrichment and further transparency. We will continue to work on this development and encourage our readers to get in touch to see the fruits of our labour!
In Summary
- 30% of new risk is traded on-SEF in AUD markets.
- There appears to be better liquidity on-SEF in longer dated tenors.
- The SEF market is almost exclusively interdealer.
- There is some evidence of Compression from TrueEx, but we do not see as much as other markets.
- Combining SEF and SDR data offers further market insights.