Our loyal readers know the form by now, so let’s kick straight into our monthly review of all things Swap and SEF-related. The highlights:
- American markets successfully fought off the Summer lull, aided and abetted by significant volatility in the second half of August.
- SEF Volumes were 50% higher than last August in USD swaps.
- Clearing Houses weren’t quite so lucky, as a European laissez-faire attitude led to global cleared volumes falling by around 20%.
- Compression activity was strong, particularly on the TrueEx SEF.
- Bloomberg grabbed market share from Tradeweb in the D2C SEF Wars.
- Whilst ICAP benefited from a widening CCP Basis to record impressive volumes and take number one spot in the D2D SEF rankings.
Market Moves
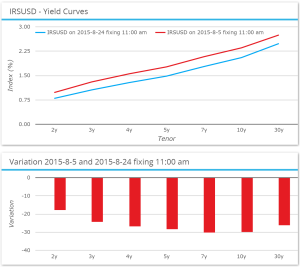

Although of course, the moves from the 1st to the 31st were somewhat less – “only” 10.5bp in 10 years as we sold-off into month end and the Jackson Hole shindig.
USD IRS On-SEF Volumes
This volatility probably helped stoke the fire under volumes this month. Last year, August 2014 saw a 12% drop in (USD IRS, On-SEF ) volumes compared to July 2014 and were 35% lower than September 2014. Clear evidence of a Summer-lull. But in Summer 2015, the lull has not been so pronounced, with volumes in August 2015 basically flat to July 2015 and 25% higher than the same month last year:
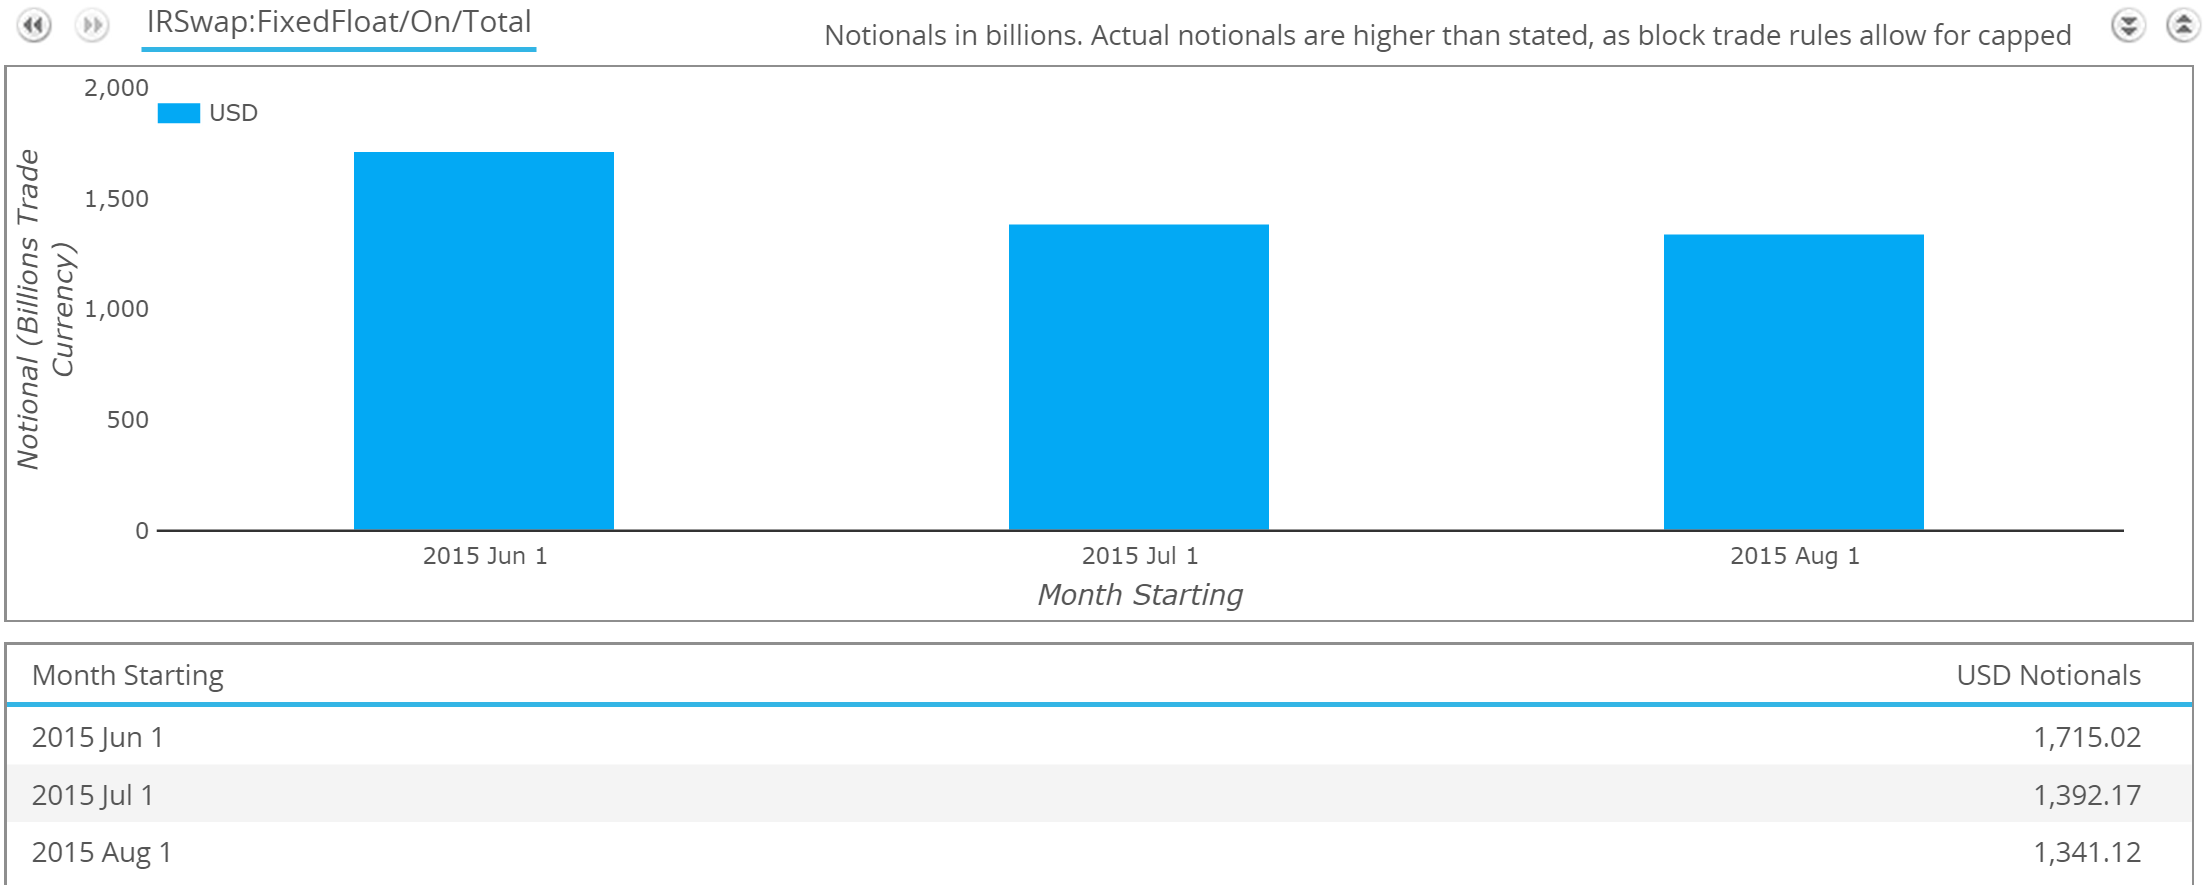
So despite some of the commentary this month suggesting SEFs are struggling to grow volumes, looking at the real-time data shows a healthier picture.
SEFView
Switching to SEFView allow us to look at the total August volumes, without being hobbled by cap-sizes on block trades. Here, we see that volumes have been slightly lower than July across all of USD, EUR, GBP and JPY rates products:
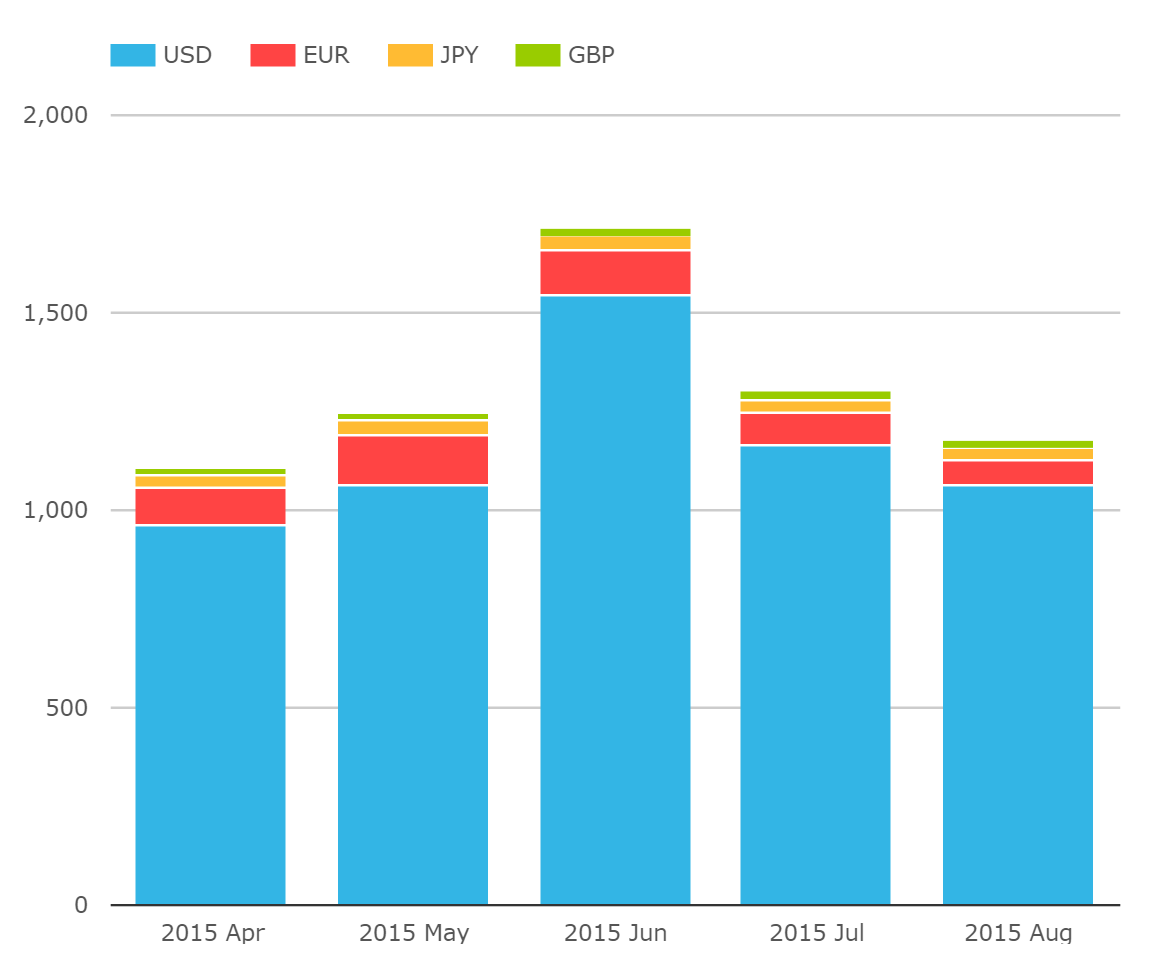
It is well worth noting that:
- USD Volumes were higher than both April and May – an impressive performance for a Summer month.
- EUR Volumes are far more impacted by the Summer lull. EUR volumes are running at half of their May and June levels.
- Compared to August 2014, USD volumes were UP 51%!
- Compared to August 2014, EUR volumes were down 13%.
Remember previously that the SDR data suggested USD volumes were only up by 25% compared to last year. This highlights another impressive performance for a Summer month – namely, the continued activity in block trading. We would normally expect a reduction in block-trading in thinner markets. That has not been the case in August 2015. There were over 1400 block-trades on-SEF this month, comparable to May and just 100 shy of July’s figure. Pretty impressive stuff.
Global Cleared Volumes
Whilst the SEF activity may have continued to be healthy in August, we can’t say the same for the industry as a whole. From CCPView, looking across the global CCP universe, we saw a large drop last month:

Showing:
- Across all rates products and all currencies, there was a 20% drop in volumes in August.
- And yet, SDRView still shows approximately 50% of volumes trading on-SEF across USD, EUR, GBP and JPY products. This shows that total volumes reported to the SDRs were fairy constant this month as well.
- Given that we know SEF volumes were broadly in-line with previous months, we therefore know that the drop in CCP volumes is due to a drop in trading activity for the non-SDR market participants.
- The evidence therefore suggests that the Summer lull this year has been a largely European affair.
- The US Persons who are largely responsible for the SDR and SEF data have therefore not enjoyed a Summer break at all. Remember that when your London colleagues are complaining about how “bad” the Summer has been….
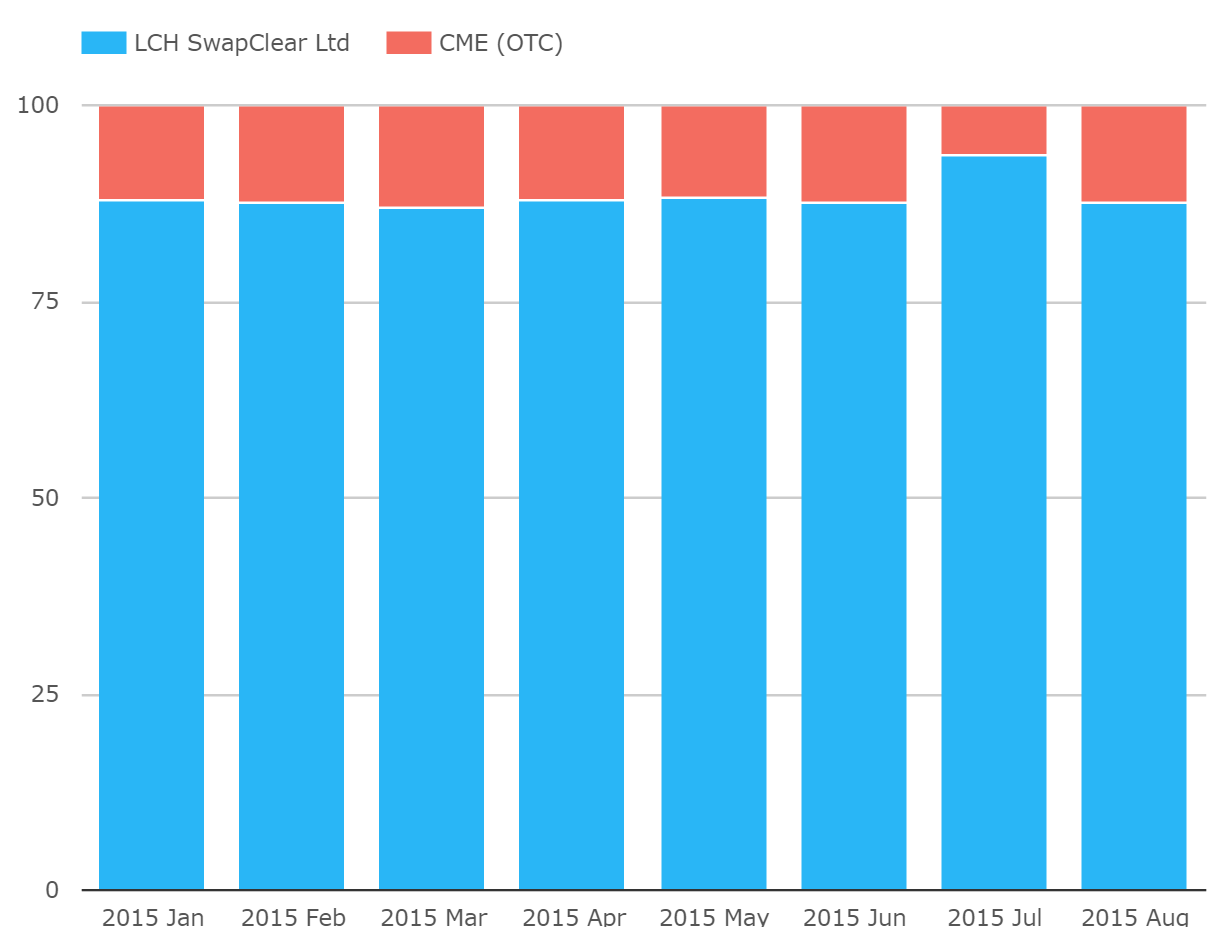
With that in mind, we might expect CME to have had a better month than LCH – all else being equal. Amir noted last month that the CME’s share of client clearing in USD swaps had dropped to a recent low of 37%. Well, maybe the European hiatus of trading has helped them this month, as we are back towards the 50/50 levels that were evident in Q2.

But we also note that the CCP Basis has widened again this month. So whilst Client volumes are certainly relevant, it’s worth bearing in mind the overall market share metrics that LCH enjoy and how stable this has been at around 78%. This helps explain why liquidity is so concentrated:
CCP Basis
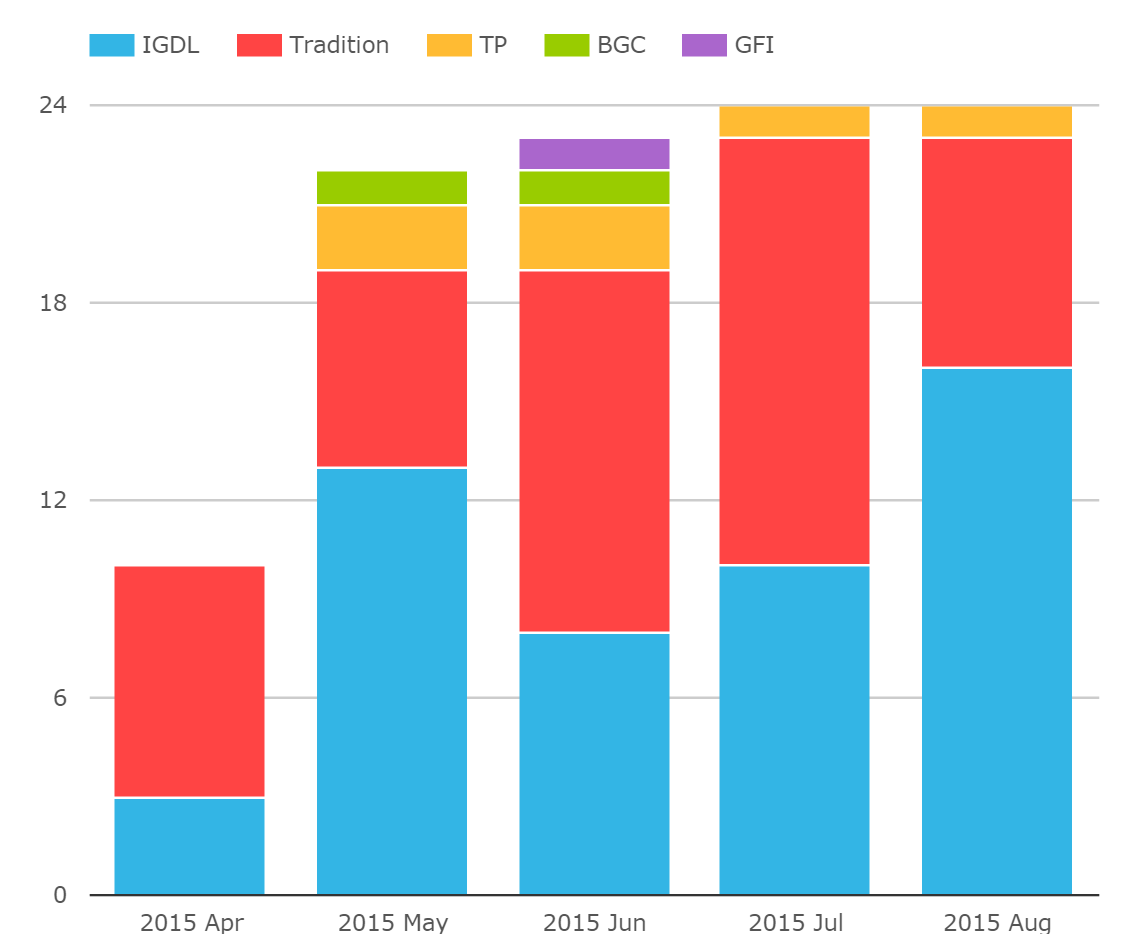
Expanding upon the subject of CCP Basis, we can update the market-share readings per SEF for this growing corner of the market. Volumes were the same as last month, with ICAP seeing a huge rebound in volumes – enough to overtake Trads as the number one venue on a year to date basis. The story is similar whether looked at on a DV01 or Notional basis:
New Custom View
Just as we’ve developed new tools to look at this CCP Basis, we’ve also developed a new, customisable view as part of our SDRView Researcher product. It’s well worth a visit if you’ve ever felt limited by our previous queries. From this page, you can change all of our parameters and see some very interesting charts as a result. For instance, ever wondered how the composition of the market changes from month-to-month? We can easily see this by filtering by package type:
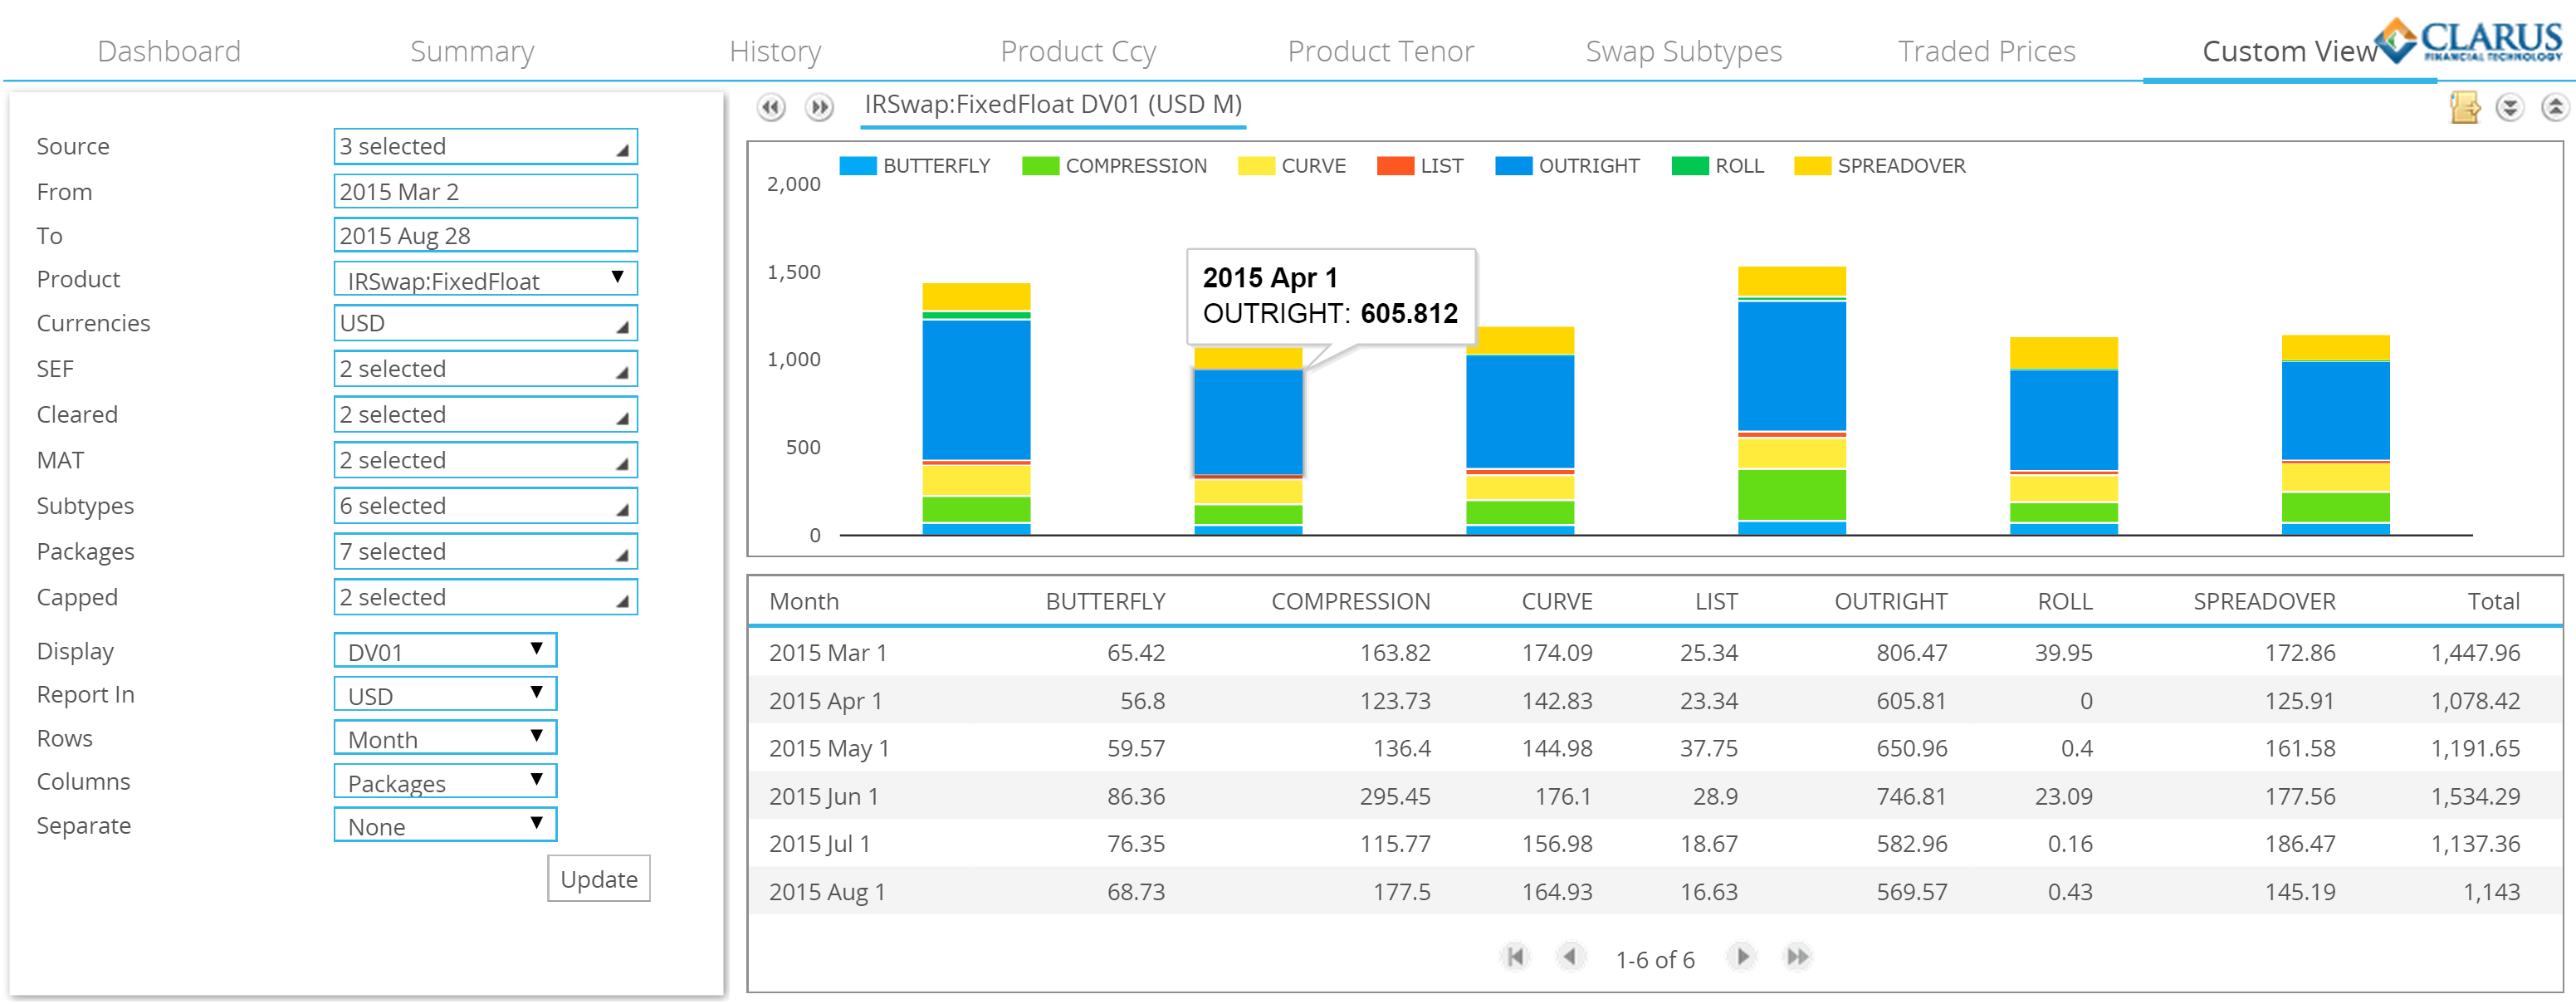
And a quick export to Excel shows that, on a percentage basis, Compression activity was significantly higher than average in August:
(The eagle-eyed amongst you will also note that we now break-out IMM rolls as part of our package identification algorithms. This will be particularly interesting going into the Sep roll this month.)
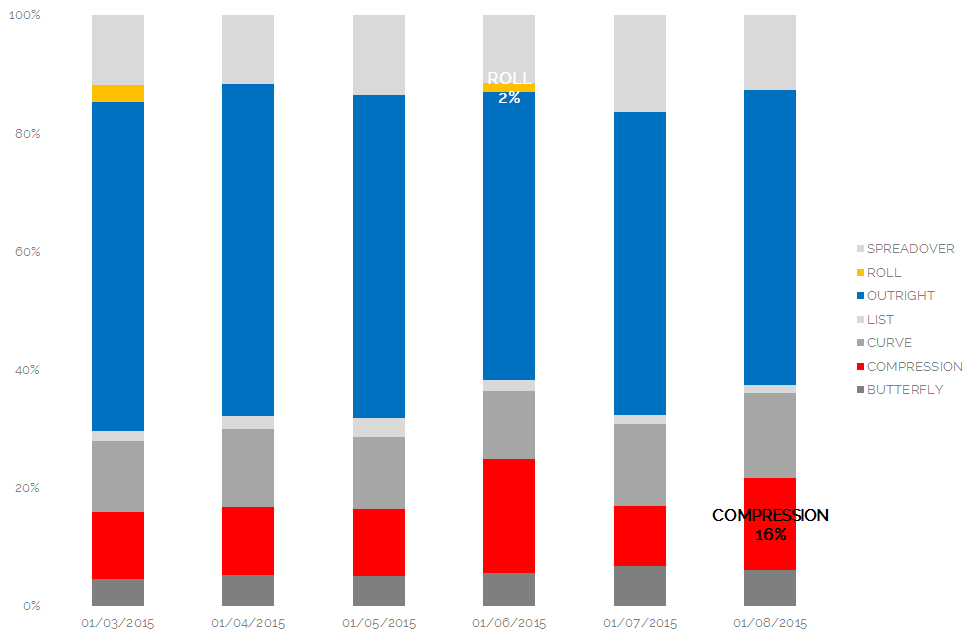
Again using the CustomView, we can explore this change in Compression volume over a longer time-window:
Showing:
- August Compression volumes were the second highest ever recorded, and the highest ever outside of an IMM-roll month.
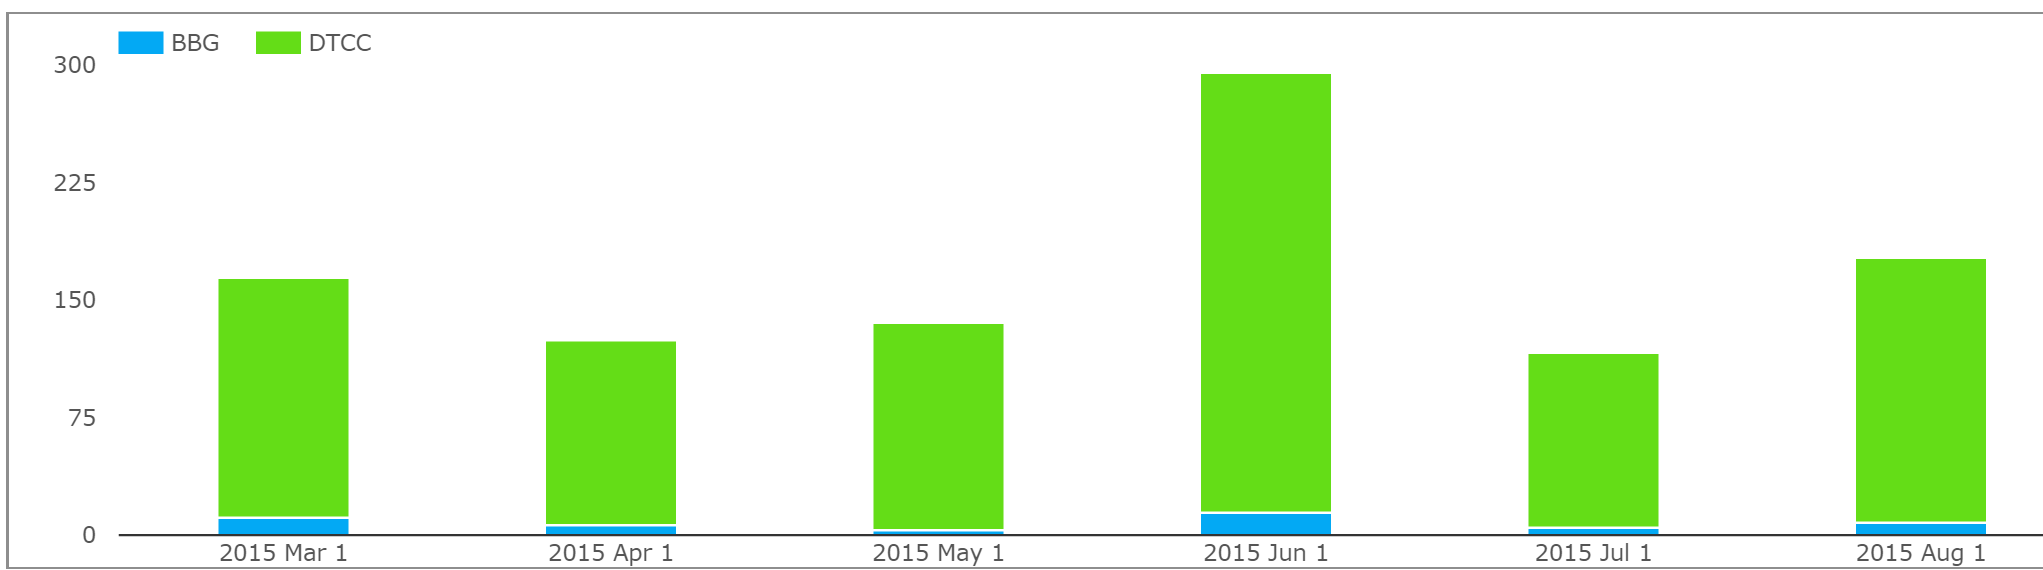
- The vast majority of these Compression volumes were reported to the DTCC SDR, suggesting that much of this activity was transacted on either Tradeweb or TrueEx, rather than on the Bloomberg SEF.
- Both Bloomberg and TrueEx have recently changed their reporting standards and no-longer mark-up their Compression volumes. We find this reduction in transparency disappointing. But fear not, as we continue to cross-reference their reports with our SDRView data, allowing us to estimate Compression volumes. More on that below….
SEF Market Share ex-Compression
And almost as if on cue, that brings us nicely to the SEF market-share metrics. Reproducing our monthly table again:
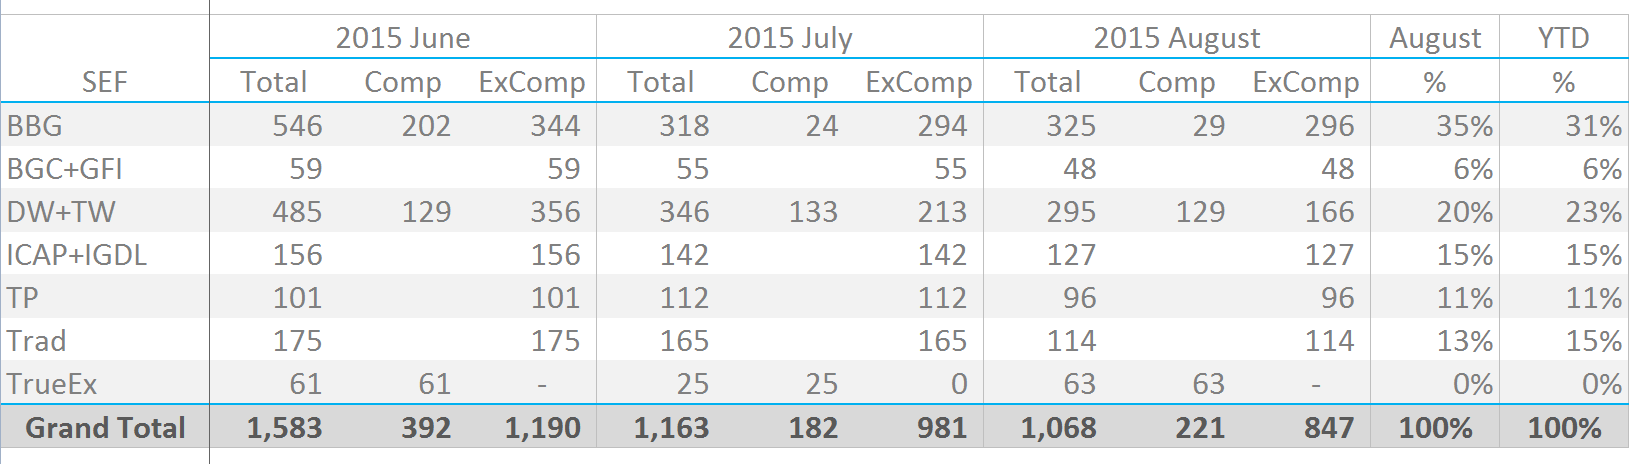
Before we look at the individual SEF performances, a quick note on the table above and the August “Compression” volumes:
- We are a little cruel and assign all TrueEx volume as Compression. Given their change in reporting, this is pretty much our only option – bear in mind that this is consistent with the prior months, so is a very fair assumption to make.
- In addition, we can see that all of the “off-the-run” dated swaps on the Bloomberg SEF were transacted at the same time as one or more other off-the-run swaps – a typical hallmark of Compression transactions. We can therefore assign all off-the-run swaps on BSEF as Compression volume.
- So despite the SEF’s attempts to obfuscate the picture this month with some reporting changes, the combination of data within SEFView and SDRView allows us to accurately assess Compression volumes.
And what does the table show for the SEF landscape last month?
- BSEF had an exceptional month, outperforming their year-to-date market share by 5%.
- Strangely, this wasn’t reflected on the other major Dealer-to-Client platform, Tradeweb. Instead, Tradeweb underperformed this month, with a drop of 3% compared to their typical market share.
- The obvious conclusion is therefore that BSEF won market share from Tradeweb this month.
- But is this because of a customer distribution bias? Is there a skew across the two platforms, with Tradeweb enjoying a more European-bias and hence suffering an August lull?
- And a worthy nod to TrueEx, who had an excellent month and may have been largely responsible for the spike in Compression volumes.
In Dealer-To-Dealer land, not too much changed:
- ICAP are at number one with 15%. This is likely due to their strong performance in CCP Basis markets – clearly the Clarus webinar helped them out!
- Trads had a bad month, but are still level-pegging on a Year-to-Date basis with a 15% market share.
- Tulletts come in third and BGC/GFI fourth. The stability of their franchises really is something to behold!
If we were being consistent, we might think that ICAP’s strong performance this month was due to a more US-centric franchise. But the IDB’s are typically all global in reach, so I’m not so confident on this.
The only thing for it is to tune in next month to see what Tradeweb and Trads are going to do when they return from their Summer holidays!