Much has been written about the demise of the FCM in America. I pulled some numbers to see if I could get my head around it, and to check on the overall health of the ones that remain.
CFTC Data
The foundation for my analysis is the CFTC monthly reporting showing the capital requirements and amount of funds on hand at each of the countries clearing firms. I would occasionally have a look at the list to gauge the strength of particular FCMs. The available reports date back to February of 2002; and after years of occasionally referencing the most recent report, I decided to pull down all the data to see if I could spot anything.
COUNTING THE DATA
The first thing you’d notice when looking at the past 13 years of reports is there is less FCMs on the list these days. So first instinct was to simply count the number of FCMs over the past 13 years, as I’ve shown below:
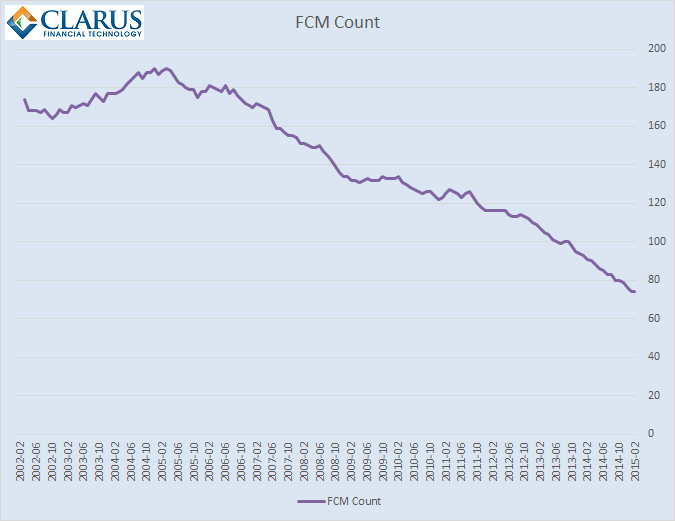
Quite telling. The count peaks at 190 in March 2005, and currently stands at 74.
JUST SWAPS DATA
The mix of the data is also quite interesting. Given that we at Clarus are “swaps” guys, we concern ourselves with the FCM’s that have a swap business. Looking at the current month’s data, of the 74 FCMs, only 20 of them have a customer requirement in Cleared Swaps. However, even that might be generous:
- If I remove the FCMs with under $1 million worth of required margin (roughly the amount required to support a single $10mm 30Yr swap), that list drops to 18.
- If I remove the FCMs with under $10 million worth of required margin, the list drops to 14.
- FCMs with over $100 million of client funds: 12
- FCMs with over $1 billion: 10
- The largest is Credit Suisse, with nearly $13 billion of Customer Cleared Swap required.
AMOUNT OF MARGIN REQURED IN SWAPS
My next instinct was to then see the behavior of the amount of required swap margins. I anticipated that cleared swap margins would show a gradual upward trend. Reason being:
- Swap clearing has been mandated for the duration of the CFTC swap reporting (the latter began Jan 2014)
- Many clients were new to clearing in 2013, hence their legacy portfolios may not have been cleared
- So we should see incremental additions of client cleared swaps from clients
I was correct in direction but slightly off in magnitude. As shown in the chart below, required swap margins have leapt from $25 billion to nearly $53 billion in the 14 month period.
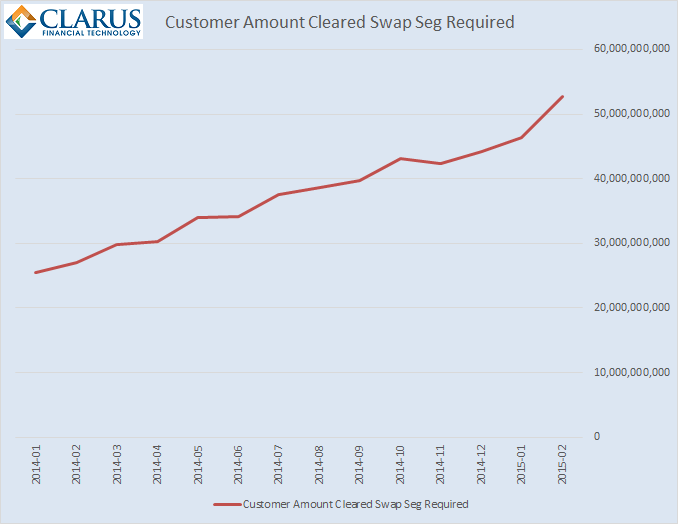
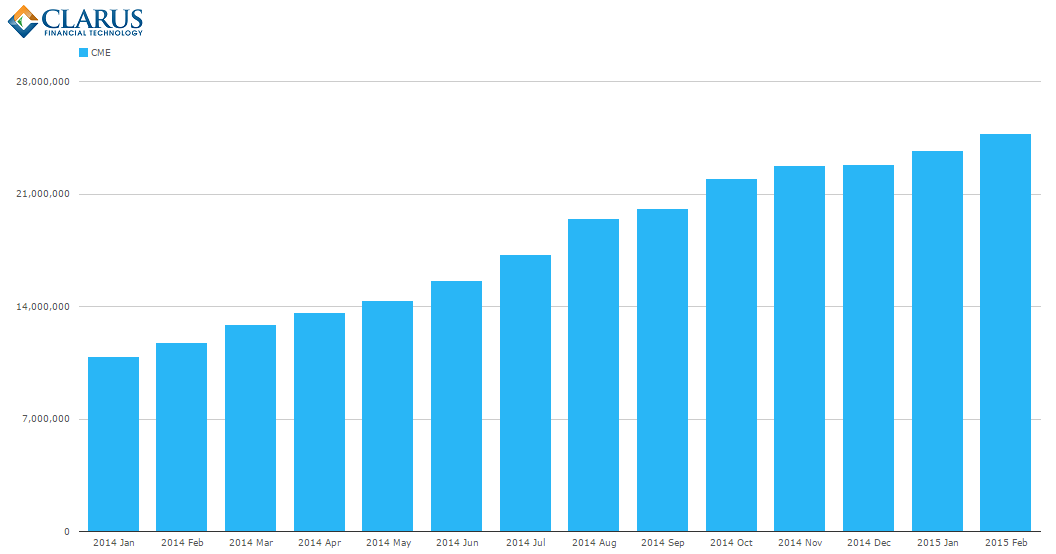
A quick sanity check of CME cleared Interest Rate Swap OI using CCPView corroborates at least part of this. Open interest grew from $11 trillion to $25 trillion in the same period. I should note that swap margins (in the chart above) are aligned with the amount of risk cleared, and OI here is in notional terms; so while you cannot directly compare, it is a reasonable justification.
WHAT IS REPORTED
The monthly CFTC report is quite easy to digest. It nicely reports each FCM’s:
- Adjusted Net Capital and Net Capital Requirement
- Amount of customer funds it has received within each regulatory bucket:
- “Seg” – Listed futures and options.
- “30.7” – Listed futures and options outside of the USA.
- “Cleared Swap” – Over the counter rates, credit and FX.
- For each of these regulatory buckets, it also then lists out:
- Of the customer funds pledged, how much is “Required”. Think of required as the DCO minimum margin requirements.
- How much excess funds, above this requirement, is on hand.
- “Target Residual Interest”. For this, I’ll go into more detail below.
RESIDUAL INTEREST
I find this number the most interesting. This amount of cash is a buffer the FCM makes sure it has sitting around for bad days. It represents the amount the FCM believes it needs to support daily changes (for example losses) in their clients’ accounts. While this is a simplified view, you can either believe me, or go read the Commodity Exchange Act for yourself.
First you have to realize that if an FCM finds itself without enough funds to support their required customer funds, they are “under-seg”. Under-seg is not good. This rings of MF Global and Peregrine.
To avoid going under-seg, firms have this residual interest buffer sitting around so that if their clients do not pay them, they will have enough cash to meet daily obligations. More realistically, I’d believe it’s more simply to cover the amount of time between paying obligations to the DCO vs receiving funds from the clients.
But how do you measure this? How does an FCM estimate what their “worst-case” requirements should be?
The answer is you stress test. This is done by stressing curves, and observing the change in both Initial margin and Variation margin, to come up with an estimate of your potential obligations. In the screen below, I have used CHARM to do just that, this is looking at changes to my obligations, per account, per scenario:
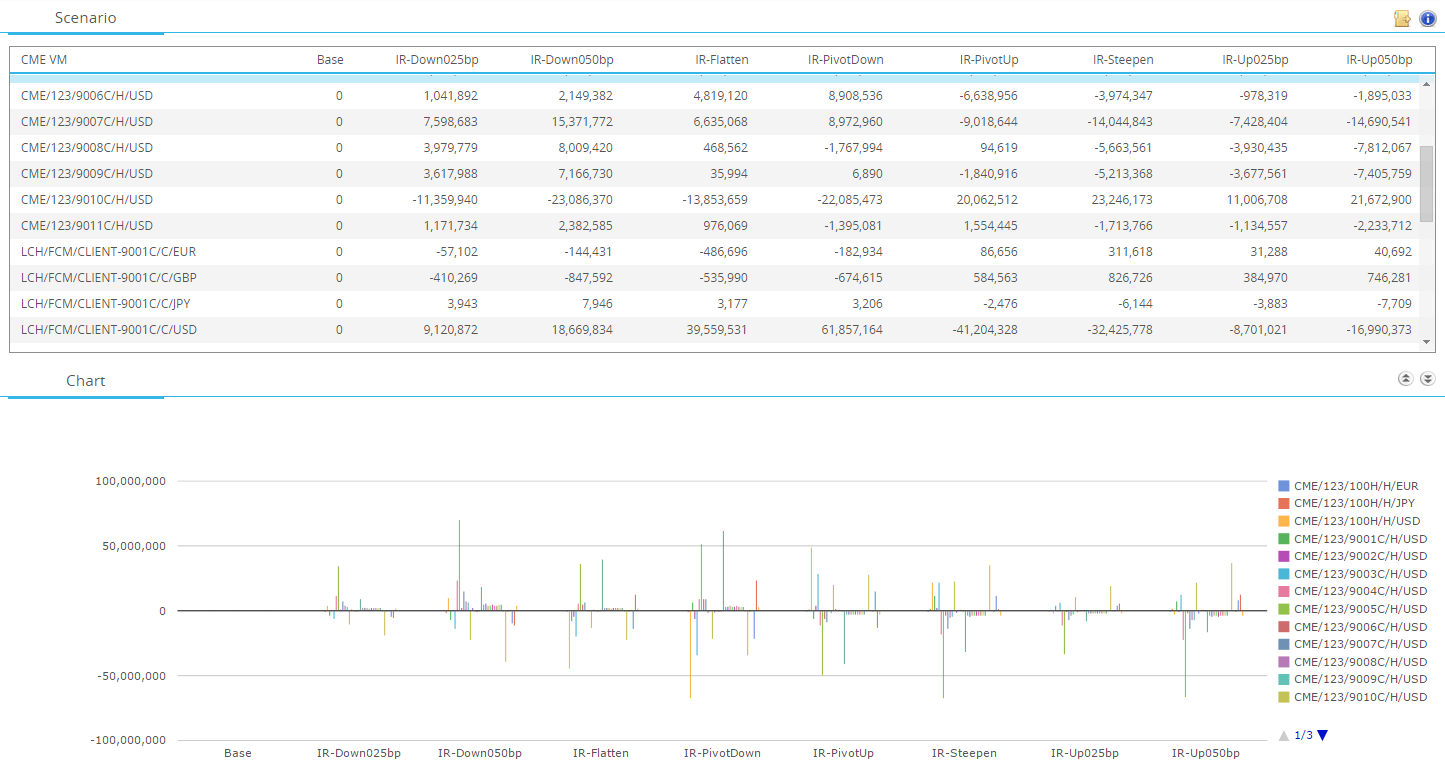
Of course we can’t stop there. Client segregation rules state that the FCM cannot offset one client’s loss with another client’s gains. It makes perfect sense – the clients you are concerned about are the ones that made a loss. You can’t be covering Clients ABC’s losses with Client DEF’s gains. This is the foundation of segregation.
In America we have LSOC, and in Europe there is the equivalent of LSOC as well as full segregation, maybe others. The differences in them come down to operational, bookkeeping, and legal issues. But point is, we can’t just sum up the scenarios. We need to look at the sum of the client losses (actually the sum of the client increased obligations across VM and IM).
I show the differences between a simple scenario result across all client accounts, and the LSOC based residual interest requirements:
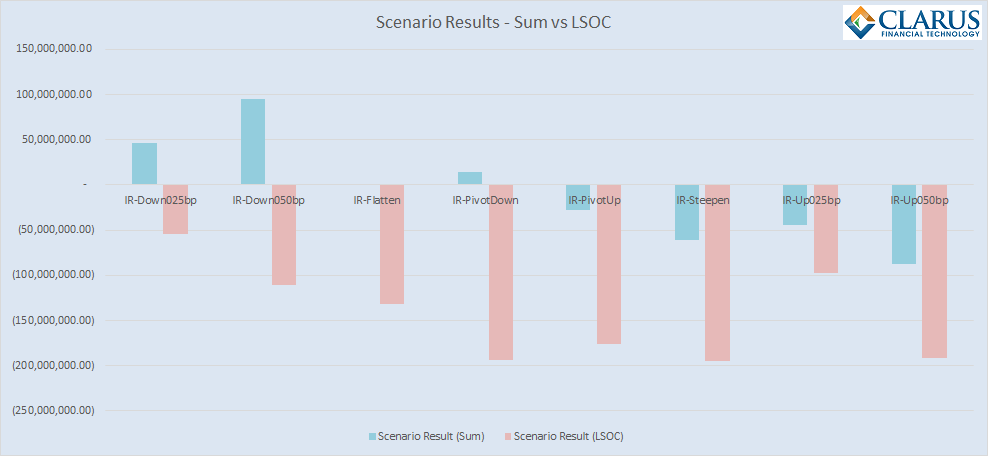
In this example, we can see that our +50 basis point shock is the largest net loss, accounting for an $87 million dollar loss across all of the client accounts. However, under the LSOC approach, the Curve Steepener scenario has the largest loss, approximately $195 million. I will not preach these 8 scenarios as being the ones to use for estimating client losses, but I will definitely preach this exercise as a valuable tool in determining the Target Residual Interest.
CAVEAT & SALES PITCH
One thing to make clear however. No matter how good your estimate is, an FCM still needs to estimate the actual losses during a busy day, on demand. I believe our CHARM product is the only viable service out there that can do this for swaps in any kind of reliable manner.
HOW BIG IS THIS
We noted that there are 20 swap-clearing FCMs. How much residual interest do they hold? Phrased another way, how much collective margins do the FCMs deem necessary to hold in excess for their clients, to cater for a big day in the swap market?
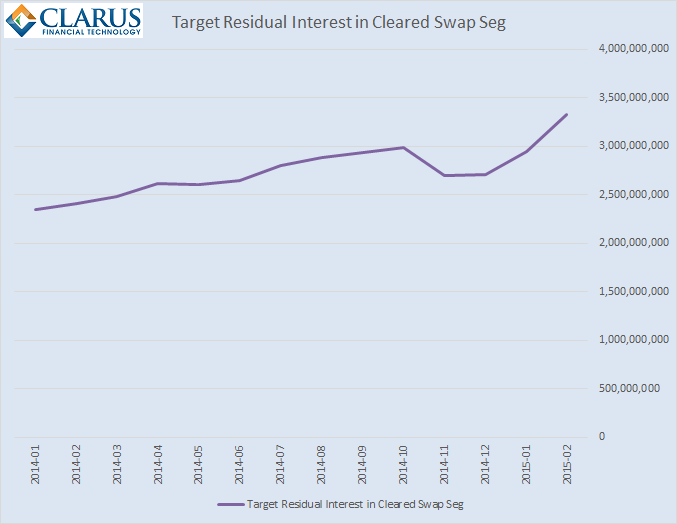
Based on this chart, just over $3 billion.
I like this number. We get so used to talking about trillions of notional in the swap market. But this says that the collective losses of client accounts, as projected by FCM’s internal risk policies, comes out to $3 billion. That’s not to say that is a cap, or FCM’s would fail if a day was larger. FCM’s still manage risk intraday and organize funding from morning and into the night.
But if you compare $3 billion to the losses in the equity markets, it seems tiny. The US equity markets lost over $1 trillion in market value on a single day in September 2008. Granted that is a market cap loss, and we are comparing it to losses in a zero-sum derivatives world, but it gives perspective and removes the scary “trillion” word from the swaps market.
SUMMARY
To wrap this up, just remember:
- The number of FCMs continues to shrink
- FCMs handling Cleared Swaps are a small portion of that
- The amount of client funds to support cleared swaps has double in the last year
- Residual interest is the buffer FCM’s have on hand to cover client losses
- Stress testing margins is the appropriate way to size this buffer
Tod – this is a fascinating piece of analysis, esp the decline in number of total FCMs contrasting with the rise in swap margin.
I am currently putting together a paper on the rise of collateral utilities, triggered especially by the non-cleared margin regs. I’m wondering if I might quote one or two of your charts, with full credit of course?
Thanks
David