- We look at the Standardised Schedule of Initial Margin for non-centrally cleared derivatives
- Cross Currency Swaps are a large part of the uncleared market that we did not look at last week
- We therefore take a look at the July volumes to estimate Initial Margin requirements for cross currency swaps
Margin Requirements for non-centrally cleared derivatives
The Basel Committee on Banking Supervision, in conjunction with the board of IOSCO, published this paper in March 2015. I will use the section on Cross Currency Swaps to estimate how much Initial Margin may be posted over time.
Cross Currency Swaps are mentioned only 7 times in the document, but the impacts for Initial Margin models are significant. Under Part B: Key Principles and Requirements, Requirement 1 outlines the instruments and risks to be margined. For Cross Currency Swaps there are some interesting carve-outs:
![]()
For the purposes of today’s analysis, we are going to follow the “In practice…” advice from above and apply the interest rate portion of the standardised Initial Margin Schedule to calculate some IM figures.
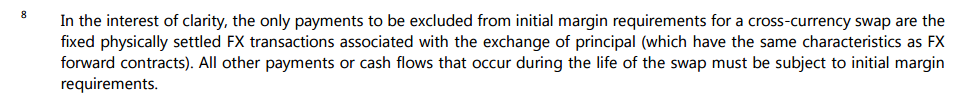
Standardised Initial Margin Schedule
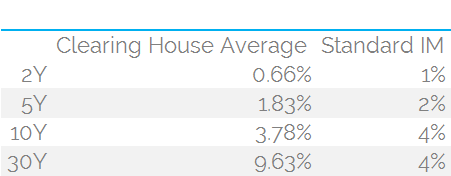
We will be using the following table from the aforementioned document:
Tying the two parts of the guidance together means that:
- For Cross Currency Swaps maturing in less than two years, we apply a 1% Initial Margin amount
- For Cross Currency Swaps maturing in less than five years (but greater than 2) we apply a 2% Initial Margin amount
- For Cross Currency Swaps maturing in greater than five years, we apply a 4% Initial Margin amount
Comparisons
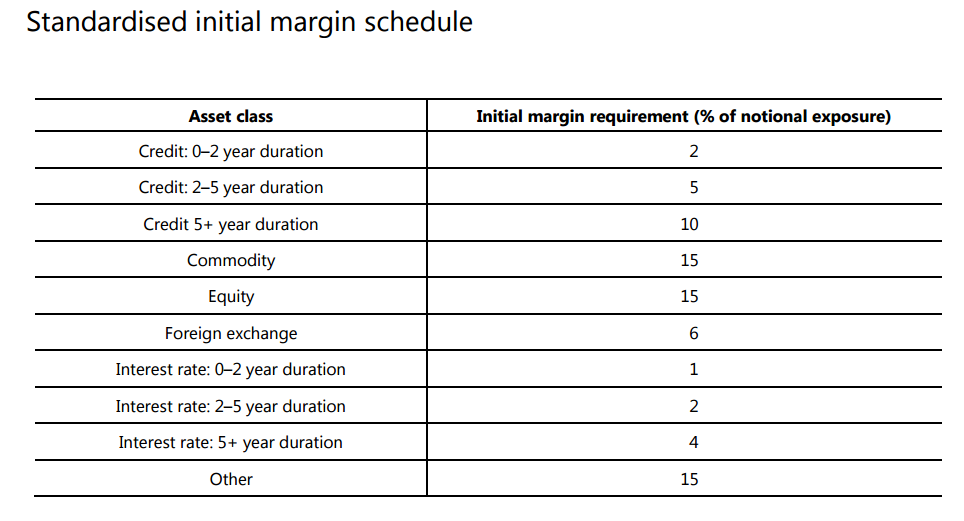
Before we run some simulated numbers for July volumes, let’s do a comparison of how this standardised schedule stacks up against cleared IRS trades. Using CHARM, we can run the numbers for a 2 year, 5 year, 10 year and 30 year swap in USD:
Showing;
- On a standalone basis, IM is lower for 2y, 5y and 10y swaps at a Clearing House
- However, for 30 year swaps, IM is actually lower under the Standardised IM schedule than at a clearing house.
Is this second point really true in practice?
The Importance of Netting
As we discovered last week, the crux of Uncleared IM numbers is how netting can (or cannot) be applied. This is where the application of the Standardised IM schedule gets interesting. Requirement 3 for Initial Margin outlines the degree of netting that is possible under the Standardised schedule, and includes this humdinger of a footnote:
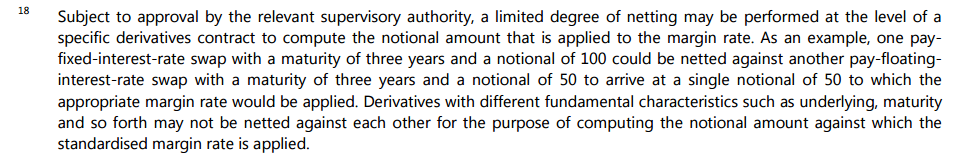
Let me highlight the crucial part here:
Derivatives with different fundamental characteristics such as….maturity…may not be netted against each other
This seems pretty important to me:
- Under the standardised Initial Margin schedule, we cannot net trades within the maturity buckets of 0-2y, 2y-5y and 5y plus maturities.
- Unless trades have matching maturity dates (which has to be pretty unlikely?), IM will be the gross amount between counterparties.
- I am not sure how strict we should interpret a difference in maturity – is one day enough? I’ll leave that for our readers to comment on.
- This restriction on netting is fundamentally different to how CCPs calculate IM across a portfolio.
Volumes
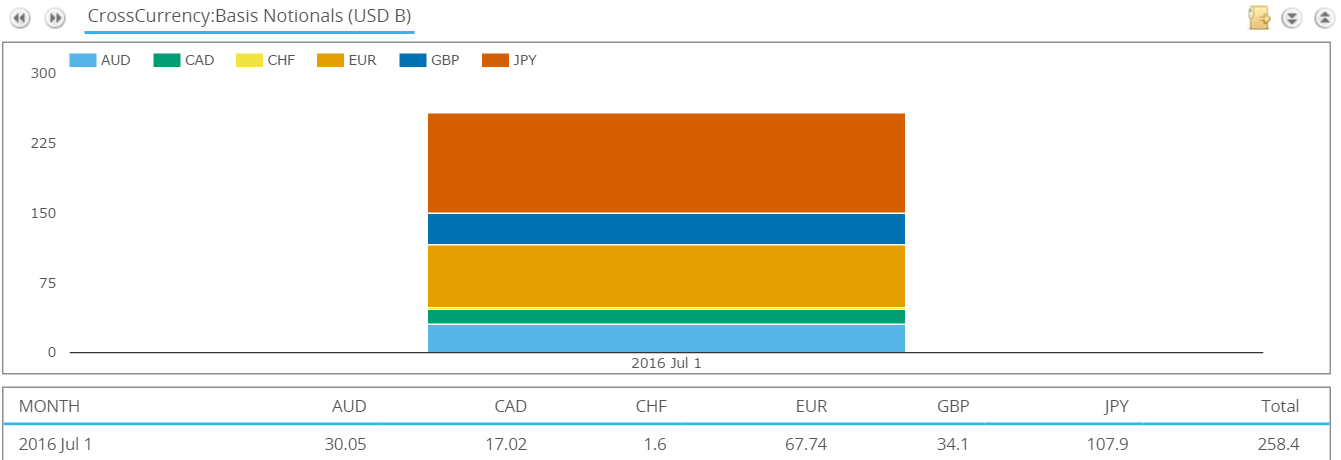
With that background in place, let’s run some numbers on Cross Currency Swaps. For July 2015, we saw the following volumes:
Showing;
- Over $258 billion in notional traded for floating-floating cross currency swaps (a.k.a “basis”).
- JPY/USD was the most traded currency pair, accounting for $108bn
- EUR/USD was second with $68bn
For our analysis on the six main currency pairs, we will only consider basis trades. This makes the population most likely to be interbank trades (clients normally trade fixed-float and particular dates). Therefore, the counterparties are likely to be subject to the Uncleared Margin Rules (UMRs).
The Overall Market
Taking into account the limited amount of netting allowed, our first port of call is to calculate the theoretical IM for the whole market if all trades were conducted between only two dealers. In this case, we randomly assign payers and receivers to the SDR trades from SDRView Researcher, remembering that:
- We do not know the direction of each trade from the SDR
- We do not know the identities of the counterparties to the trades from the SDR
This gives us the following tenor profile of trades:
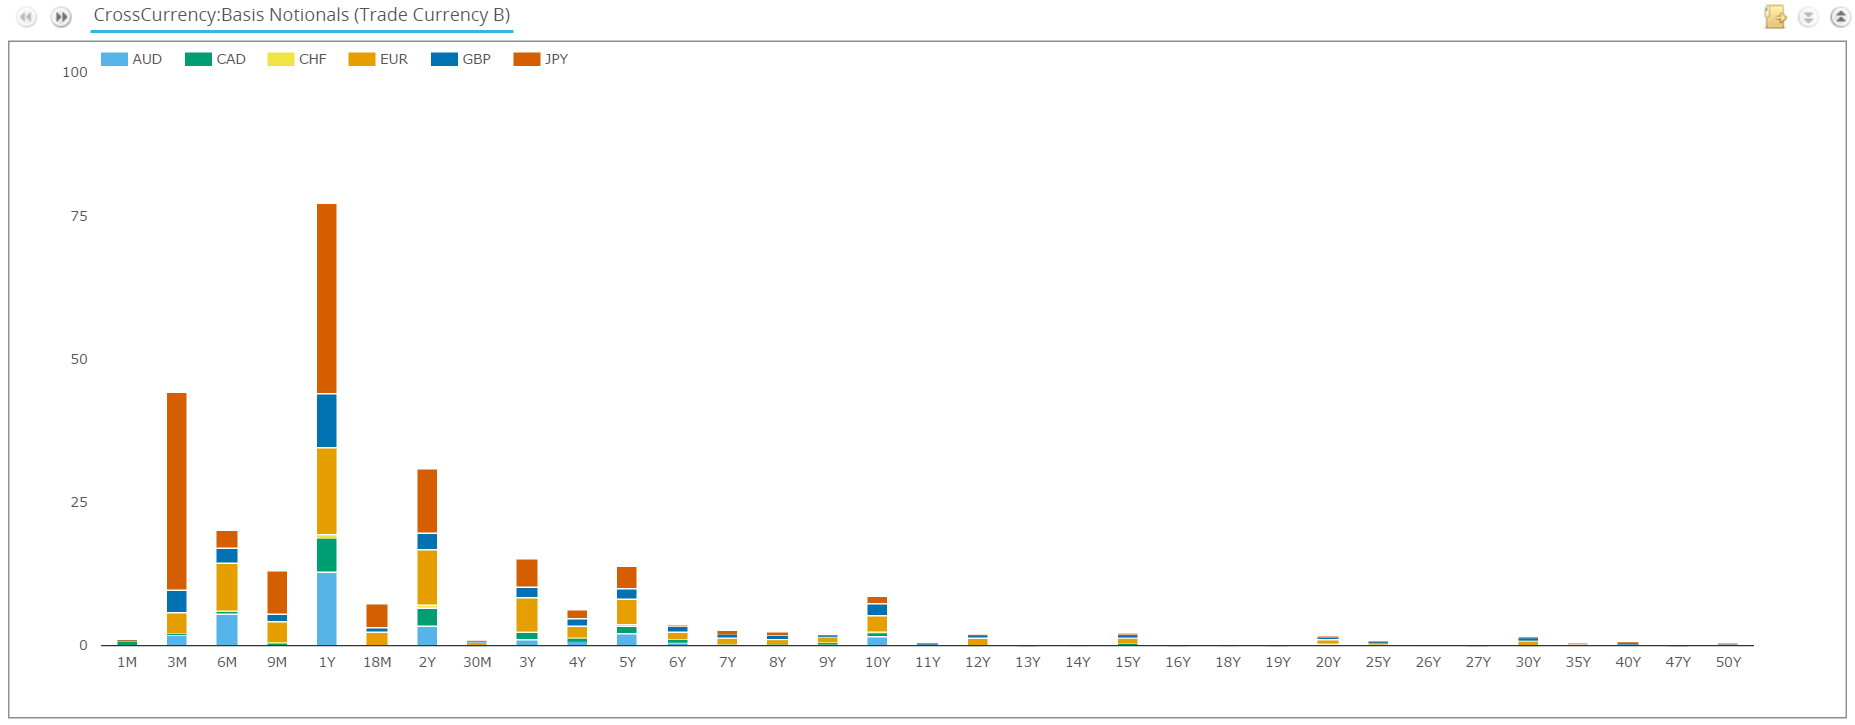 Which has;
- A Gross Notional of $258.4bn (which is all basis trades done in July 2016)
- A Net Notional of $14.27bn across all currency pairs
- The net notional across maturities is $15.4bn. This applies full netting between maturities within a currency pair, but no netting across a currency pair.
- But of course we can only net across exactly matching dates for a given currency pair.
- Therefore, the notional to which IM is applied is actually $141.07bn.
- So the limited netting opportunities result in a halving of gross notional (glass half full interpretation) or a 9.2-times increase compared to full maturity netting (glass half empty interpretation).
- An IM requirement of $2.78bn.
- This compares to an IM requirement of just $0.247bn if it was possible to net across maturities.
The Dealer to Dealer Market
As we did last week, let us now acknowledge that there are around 15 active dealers in Cross Currency swaps. We need to therefore randomly assign the SDR trades to each of one of the 15 dealers. The IM results for each dealer are hence significantly higher – because we cannot net risks across counterparties, only between counterparties. What effect does this have on IM? See the table below:
As I said last week, this effect is not necessarily intuitive. But by splitting the same amount of risk between a dealer network, there is less netting of risks possible.
Last week, we saw a 7-8 times increase in IM as a result of this reduced netting – because risks between counterparties cannot be netted, only risks within counterparties.
This week, we see an increase in IM from $2.78bn to $4.49bn.
This is less than a doubling of IM.
This is due to the fact that less netting within counterparties is possible than for an internal model such as HistVar that we looked at last week.
The Final Step
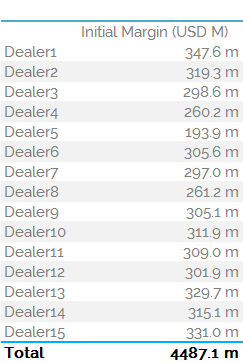
Following last week’s methodology again, we need to now look at a single Dealer’s portfolio. The IM figure of $4.49bn above is only an intermediate step. This assumes that each dealer only trades with one other counterparty – not really a fair assumption to make, irrespective of how concentrated cross currency basis liquidity may be.
Therefore, let’s assume that Dealer1 trades with another 14 dealers. Remember that netting is only possible for trades between the same counterparties. Introducing more counterparties in a portfolio, for a given amount of risk, therefore reduces the amount of netting possible. What is the effect on Dealer1’s IM from this reduction in netting?
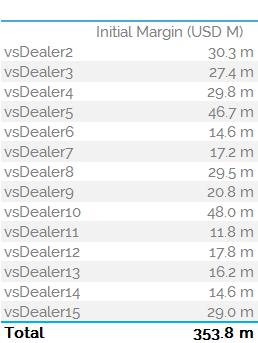 Finally, we appear to be getting to the limits of netting here. The IM is only marginally higher than we saw for Dealer1’s standalone portfolio – increasing from $347.6m to $353.8m (see table).
This is much lower than we saw from our results last week.
I therefore continued the analysis for all 15 dealers to see if there is a large sampling bias in these “grossing up” concepts.
Finally – a limit to netting
The final results are shown below.
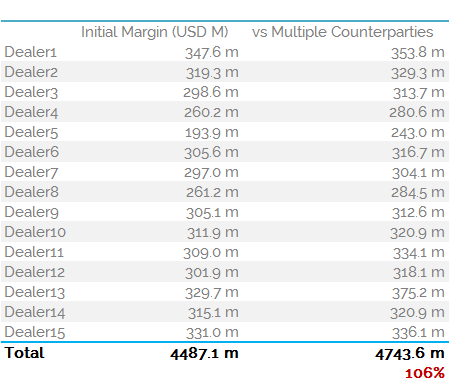
The table highlights that there is not much netting going on per dealer. This is somewhat down to the small number of trades each dealer has – between 100 and 120. When split across 6 currency pairs and 15 dealers, we can appreciate that there will not be too many offsetting trades.
Remember that our interpretation of the standardised IM schedule demands a matching maturity date.
In Summary
- Cross Currency Swaps in major currencies are not currently offered for clearing and will be impacted by the upcoming UMRs.
- If the Standardised IM Schedule were used, it suggests an industry IM requirement of $4.5-5 Billion.
- The actual IM number will likely be much lower due to the adoption of ISDA SIMM (and internal models?) that allow for netting of similar risks across maturities.
- The limited amount of netting allowed within the Standardised IM schedule will limit the uptake of this approach.
- This analysis again highlights the importance of netting. This time it is across similar risks, not just counterparties.