It’s been 18 months since I last looked at FCM rankings, so it’s about time we hit the refresh button. Let’s have a look at the most recent data.
Headline Stats
Lets start with some headline metrics. First, just a simple count of registered FCM’s, and then counts of FCM’s with any activity in the different regulatory buckets (eg Futures/Seg, Swap, etc):
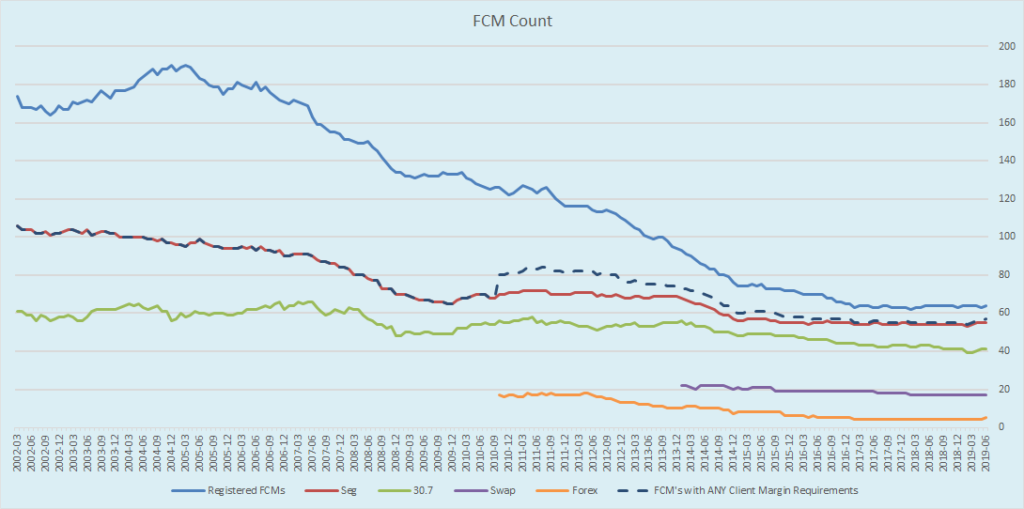
Generally speaking, the trend has continued since 18 months ago:
- There are no new swaps participants, though Merrill Lynch seems to have changed their name twice! First to BofAML then to BofA.
- The amount of FCM’s with ANY swaps margins is down to 17 (from 18 as of Dec 2017)
- A few new FCMs with Futures clearing: Natwest, Direct Access and IG US.
- The only other new entrant is Bakkt, which is up to something in bitcoin land.
Next, lets look at the amount of client margins required:
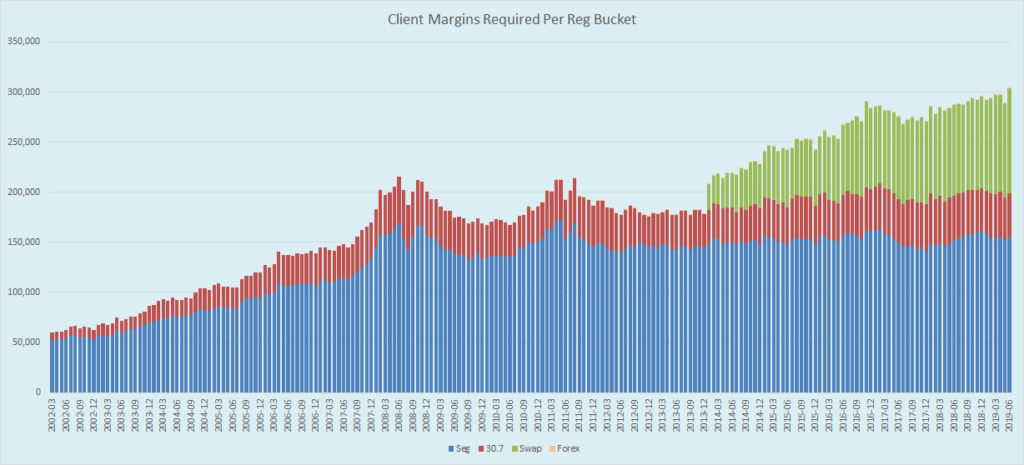
In the 18 months since my last post:
- Seg margins are up roughly 10%, to $154 bn (from $141 bn)
- Swap margins are up over 25%, to $104 bn (from $83 bn)
- Swap margins, in the most recent June 2019 report, were the highest on record, and up 10% in just one month (from May 2019)
LEAGUE TABLES
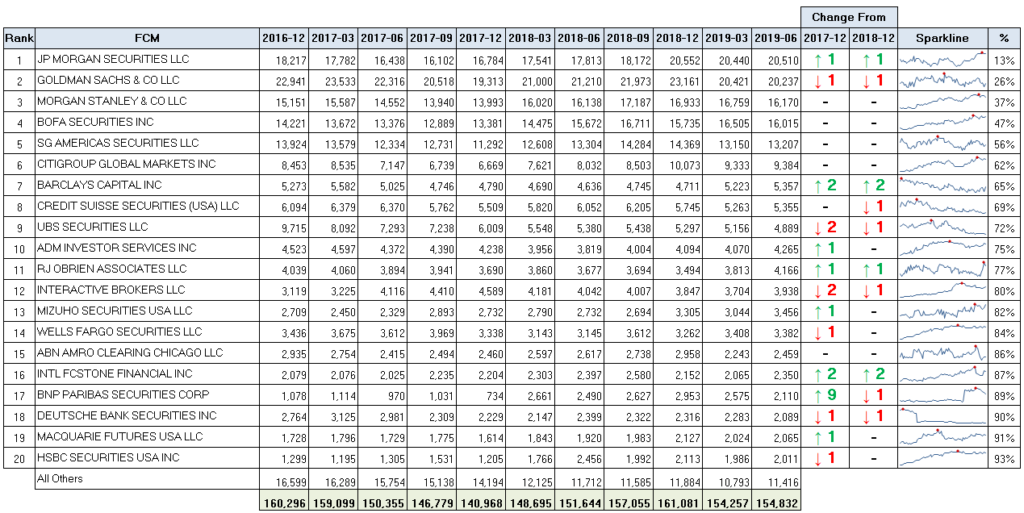
Starting with swaps as usual:
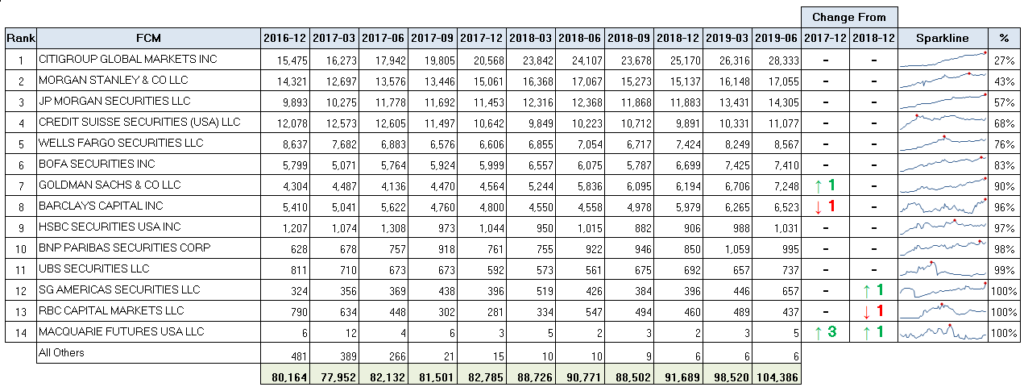
I’m showing 2 ½ years of quarterly data here now in these tables. And I show changes in rankings from Dec 2017 and Dec 2018. For swaps we can glean a few things:
- Citigroup has retained their dominant position, and their share of the market has increased to 27%
- The only notable shuffle in the ranks has happened between Goldman and Barclays.
- The sparklines are always interesting – they reflect the monthly data points since the inception of swap data in 2014. Firms like Citi and JPM have a nice smooth upward trend.
- You can see the sheer amount of margins here – with a total of $104 bn in required swaps margins in June 2019, a new record high.
- There are a total of 17 FCMs
with any swaps margins (I only show 14 here to save embarrassment). But note how we get to:
- 2/3rd of the market by the top 4
- 90% market concentration by #7
- 100% of the market by #12.
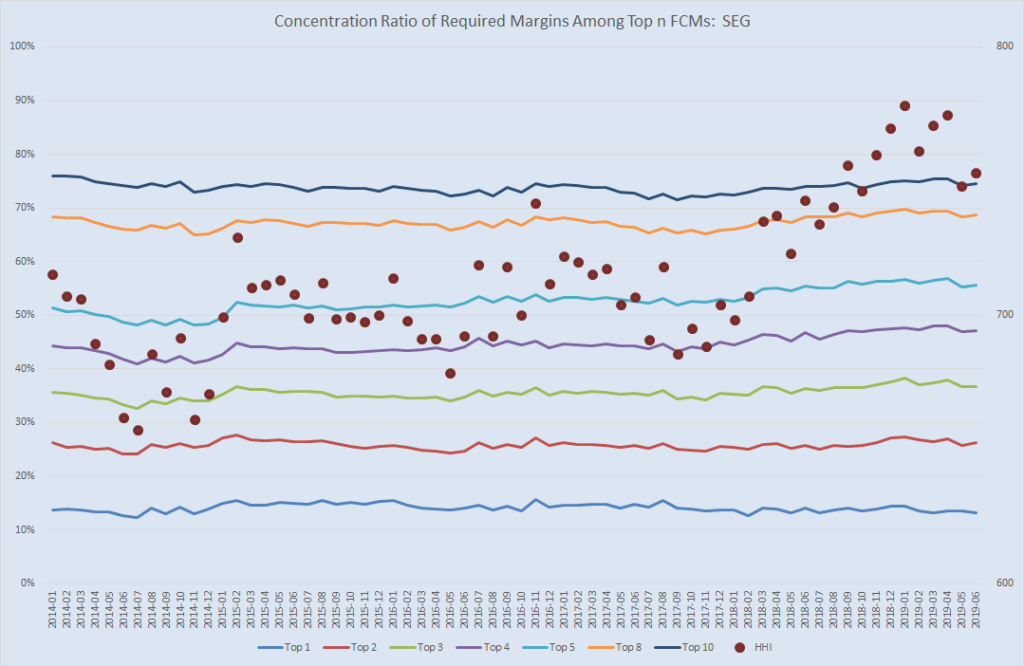
Speaking of which, lets whip out the HHI concentration metric (Herfindahl-Hirschman Index) to see how market concentration has evolved:
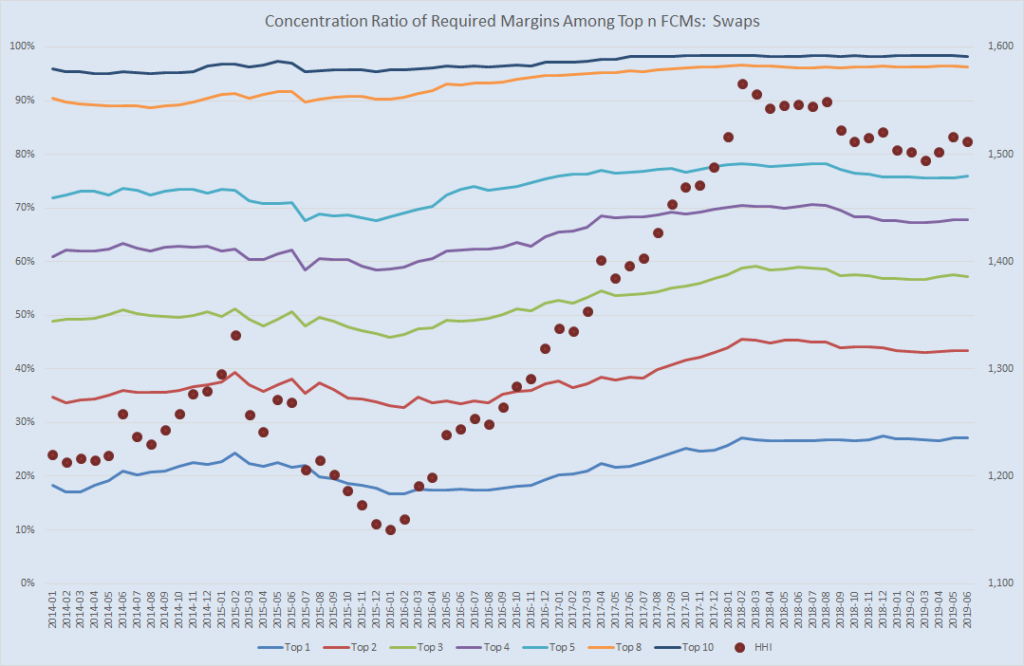
The HHI dots:
- This metric peaked at 1,566 in February 2018, and has been in a fairly consistent, modest decline since then.
- Currently sits at 1,512.
- The US DOJ says that an HHI reading of less than 1,500 is a competitive marketplace. So, the FCM space seems right around the mark.
Now onto the league table for Seg Funds:
Again, the number are fairly static over the 18 months. JPM overtook Goldmans in the most recent quarter at the top.
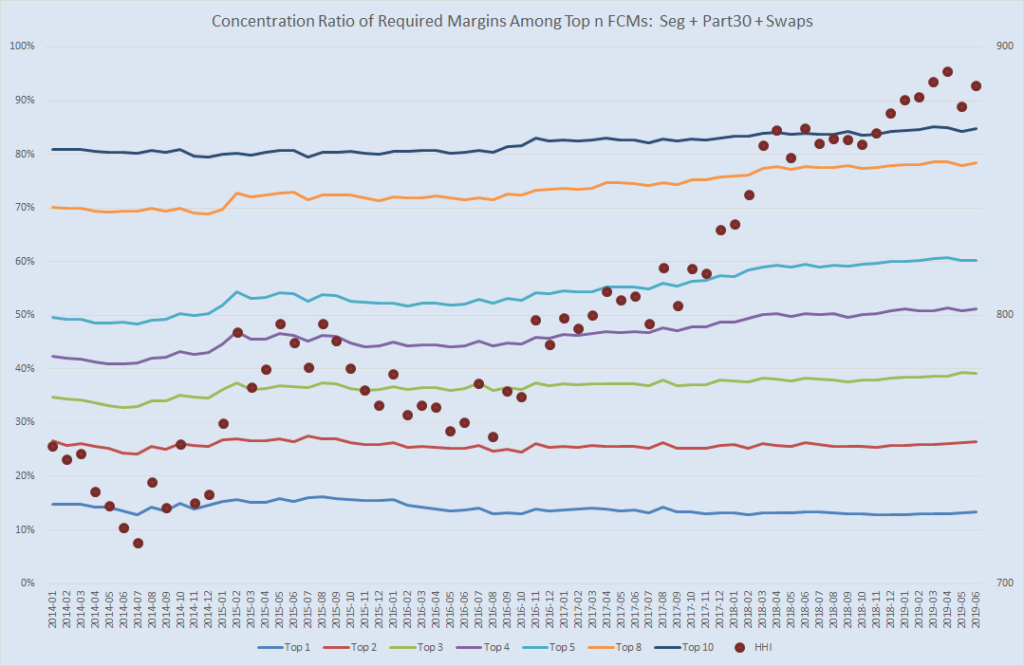
And the HHI shows this market is much more competitive. Part of this due to the fact that there are smaller clients participating in futures, and hence some FCM’s catering to market segments.
Finally, we can look at an overall assessment of required margins across Swaps, Futures and 30.7:
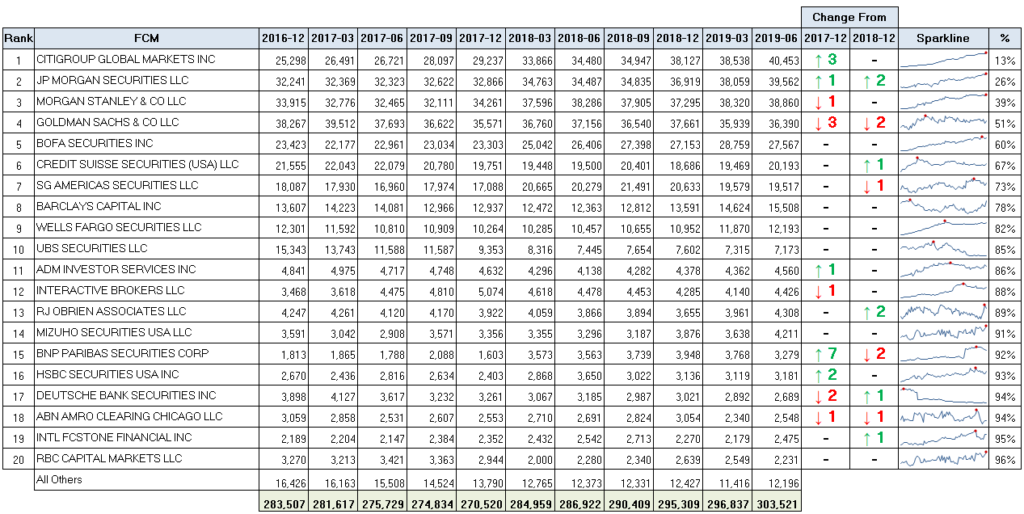
Showing that Citigroup has leapt up 3 spots. Worth noting as well that futures margins are also at an all-time high, tripping the $300 bn mark for the first time.
And the HHI Concentration chart below for good measure.
SUMMARY
It seems not a heck of a lot has changed in the 18 months since I last looked at this data.
In full disclosure, I was inspired to look into the latest data after reading Amir’s recent blog on the narrowing of the CME-LCH basis spread. I caught myself wondering whether the change in spreads might be somehow reflected in the amount of margins being posted in the US swap buckets.
Further, I wondered whether the general reduction in swap rates has caused any changes in behavior by the buy side (eg maybe there are more clients looking to receive fixed now?). Also, has the recent market volatility had an impact on swap and futures margins?
I don’t think I’m able to answer any of that, but there seems to be something driving the increase in margins. Regardless of the reason, it was a good excuse to pull some numbers and check out the league tables.
>I don’t think I’m able to answer any of that, but there seems to be something >driving the increase in margins. Regardless of the reason, it was a good excuse to >pull some numbers and check out the league tables.
I’d bet the farm this is largely driven by the various financial firms looking to minimise bilateral notional/ margin WRT to UMR