If you are in the derivatives industry, you’ve probably heard that the clearing broker market is overly concentrated.
The theory goes something like this:
- Many FCMs, particularly for swaps, have shut down their business (think Deutsche, Nomura, RBS, State Street, etc)
- This leads to a lack of choice
- The usual consequences of such (remaining firms are costlier, less agile, more selective, etc)
While I will not claim to be guilty of proliferating this, I have been publishing a quarterly update of FCM rankings, along with a gauge of market concentration. My most recent article for example cited the following concentrations of FCM client required swaps margins:
- Top 3 control 52.2% (up from 50.1% in Sep)
- Top 5 control 75.4% (up from 73.7%)
- Top 10 control 97.2% (up from 95.7%)
With a few caveats, this is saying that the top 3 firms have over half of the swaps. Is that good? Bad? Excessive?
Fast forward to the FIA event in March, and yet again I heard concerns from various folks that such concentration needs to be looked at, and addressed.
I set out to get to the bottom of this. Or at least further down the rabbit hole.
Defining Concentration
After some googling, there seems to be a couple ways (at least) of defining market concentration.
- Concentration Ratio. Your run-of-the-mill calculation as I’ve done in my FCM articles. Common metrics here are the “Four-Firm” and the “Eight-Firm” concentration Ratio (concentration by top 4 and 8 firms respectively). I found varying rules-of-thumb for qualifying these ratios, but generally speaking:
- A Four-Firm Concentration Ratio of:
- > 80% is “High” and is fairly certain to be an oligopoly or monopoly
- > 50% is “Medium” and perhaps an oligopoly
- < 50% is Low, and considered competitive
- Though I did stumble upon a couple websites that claimed that in the UK, a concentration ratio of over 25% by a single firm was deemed a monopoly!?
- A Four-Firm Concentration Ratio of:
- Herfindahl-Hirschman Index (HHI). This measure seems to be more broadly accepted. HHI takes the square of each participant’s market share and adds them up. Some points about HHI:
- A pure monopoly would have an HHI reading of 10,000 (100 market share squared).
- An un-concentrated market with for example 50 participants, each with 2% share would have an overall HHI of 200 (50 * 22 = 200).
- The lower the HHI, the more competitive
- The Department of Justice appears to subscribe to this concept, here, and seems to say:
- HHI of less than 1,500 is a competitive marketplace
- HHI in the range of 1,500 – 2,500 is moderately concentrated
- HHI in excess of 2,500 are highly concentrated.
Great, so let’s go figure out how this applies to FCM data.
FCM Data
I took the FCM swaps data since inception of reporting (2014) and determined concentration ratios and HHI index for the industry. Here is what I found:
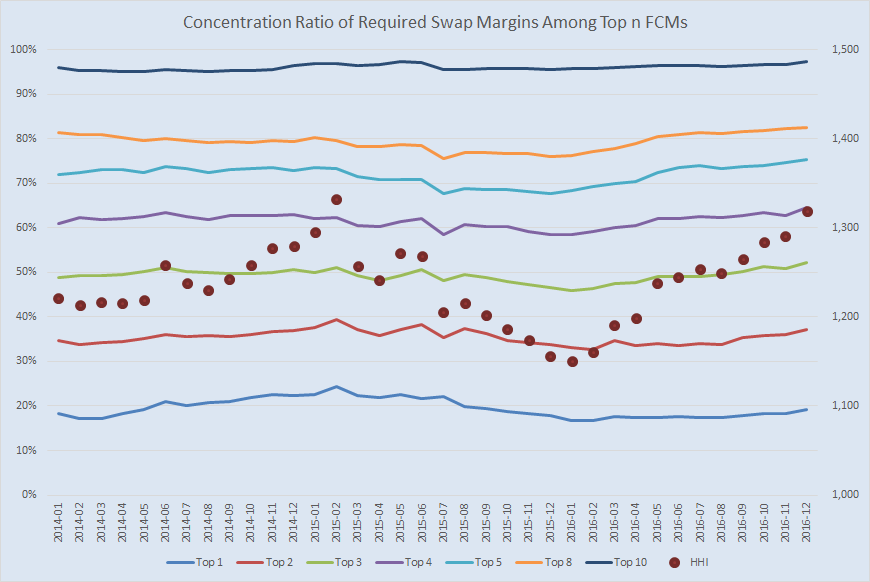
Showing us:
- The HHI has ranged from 1,151 to 1,332. (Currently at 1,319)
- All the concentration ratios seem to be back at 2014 levels:
- The top FCM market share (“Top 1”) ranged from 17% – 24%. (Currently at 19%)
- Top 4 FCMs (Four-Firm Concentration) ranged from 59% – 65%. (Currently at 65%)
- Top 5 FCMs (Five-Firm Concentration) ranged from 68% – 75%. (Currently at 75%)
- Top 8 FCMs (Eight-Firm Concentration) ranged from 95% – 97%. (Currently at 97%)
Great, so what do we do with that? Let’s see:
- An HHI peaking at 1,332 is clearly in the “Competitive” range. You can all sleep easier now.
- The Four-Firm concentration ratio peaking at 65% is a bit more unclear. This would land us in the “Medium” range. However, I really struggled to find any credible qualification of the four-firm concentration ratio. I suspect the FCM industry just has too few participants to have concentration ratios mean much.
I would also note that the “big exits” of FCMs in the swaps space really hasn’t impacted the concentrations. I would surmise that as each of these stepped out, their business was consumed equitably by the remaining firms.
Comparative Fodder
Why don’t we compare these concentrations to other industries. Admittedly I’m just pulling data from websites at this point, but:
- Worldwide Smartphone Units Shipped Q3 2016 (source):
- Apple 17.9%
- Samsung 17.8%
- Huawei 9.5%
- OPPO 6.2%
- Smartphone OS, Share of US sales, Q4 2015 (source):
- Android 59.1%
- iOS 39.1%
- Social Network Market share in UK (source)
- Facebook 78%
- Twitter 7%
- Pinterest 7%
- Desktop Search Engine Requests in the US (source):
- Google 79.88%
- Bing 9.9%
- Yahoo 8.34%
- AOL 0.84%
- DuckDuckGo (what the heck!?) 0.41%
And if we recall that the five-firm concentration ratio of FCMs is 75%, let’s compare that to some five-firm concentration ratios from the UK (source):
- Sugar: 99%
- Tobacco products: 99%
- Gas distribution: 82%
- Oils and fats: 88%
- Confectionery: 81%
- Man-made fibres: 79%
- Coal extraction: 79%
- Soft drinks and mineral waters: 75%
So there you have it. The UK Confectionary industry is more concentrated than the FCM industry. Time for a Cadbury Creme Egg.
Caveats
There is a lot more data I could run on the FCM data. Be it for listed derivatives, or for the total FCM business.
And notably, the metrics I am using is not a revenue, or processing trade counts, but the amount of collateral required to support clients. Hence one large client at a firm might account for the same as 100’s of smaller clients.
Also, comparing the FCM market to the mobile device market is perhaps unfair. When it comes to phones, I’m not sure I want more choices than iOS and Android. I’m satisfied that these two behemoths are competing and innovating enough.
Summary
So what is this perception that the FCM industry is too concentrated? I have to believe it’s not a case of too little choice. There are 19 active FCM’s clearing swaps. That seems like plenty.
I’m guessing here, but I believe the real issue is probably twofold:
- Access. Some firms struggle to get an FCM to taken them on board. Whereas Cadbury never turned down my business for a Fruit and Nut bar.
- Cost. The FCM business, particularly for swaps, is not a glamorous gig. They’re constrained by regulations and capital, and are hence having to find creative ways to share the burdens with their clients in the forms of maintenance fees, surcharges and monthly minimums.
In both cases, however, I just don’t see how more FCM’s would help. Would it make sense for a new startup FCM to come out and take on clients with poor credit and charge less fees?
The root of the problem must be further up the foodchain. I’d be interested in some objective comments here or over email.
But we can all sleep easier knowing that Herfindahl and Hirschman have deemed the industry competitive.