The latest batch of FCM data has been assembled. Lets dig in.
We start with the number of FCMs that are registered, by various metrics:
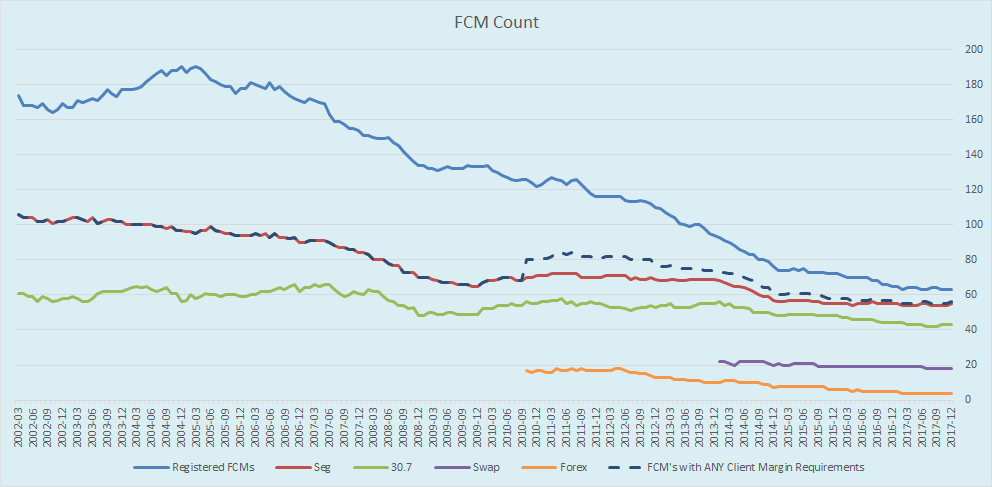
Showing us:
- The number of FCMs registered dropped by 1 firm, from 64 to 63, with the removal of ETRADE Securities (leaving just ETRADE Futures)
- The number of FCM’s with any client margins ticked up by 1 to 56
Next, the amount of customer funds that are required to support derivatives, in millions of US dollars:
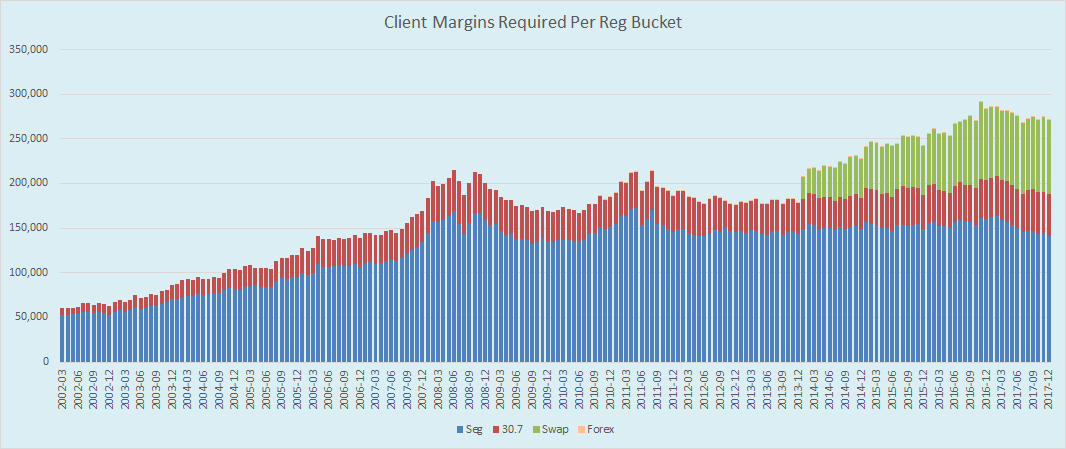
The overall change for the quarter is negligable, however a small shift by required funds:
- Seg funds dropped $6bn to $140bn, its lowest monthly number since May 2012
- Both Swaps and 30.7 funds trended slightly upwards
- The result being a slight drop in total required customer funds, currently sitting at $271bn
Swap League Table
Starting as usual with the Swap league table:
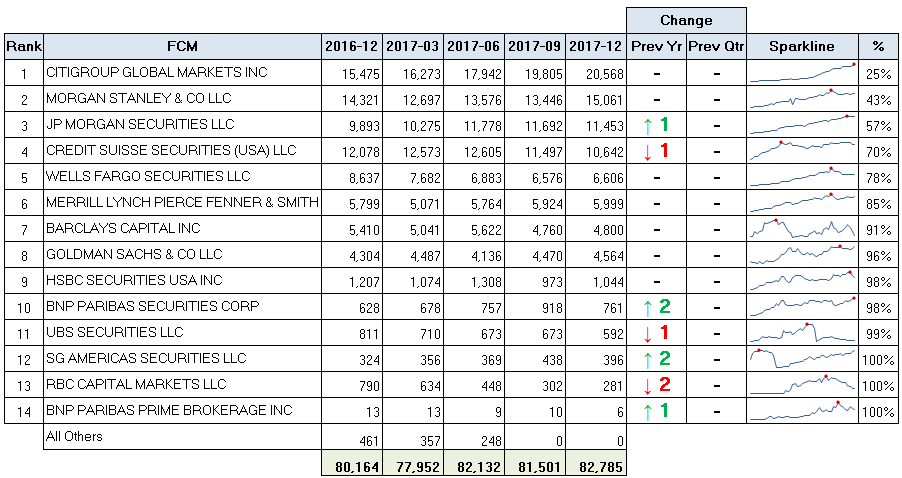
This marks the first time we have not seen a quarterly change in the FCM rankings.
What should be noticeable is the increase in funds within the top 2. The astute readers will notice that the cumulative % share (far right column above) is slowly grinding higher. Citi now has exactly 1 quarter of the swap business.
This becomes more clear with the Concentration Ratio analysis below:
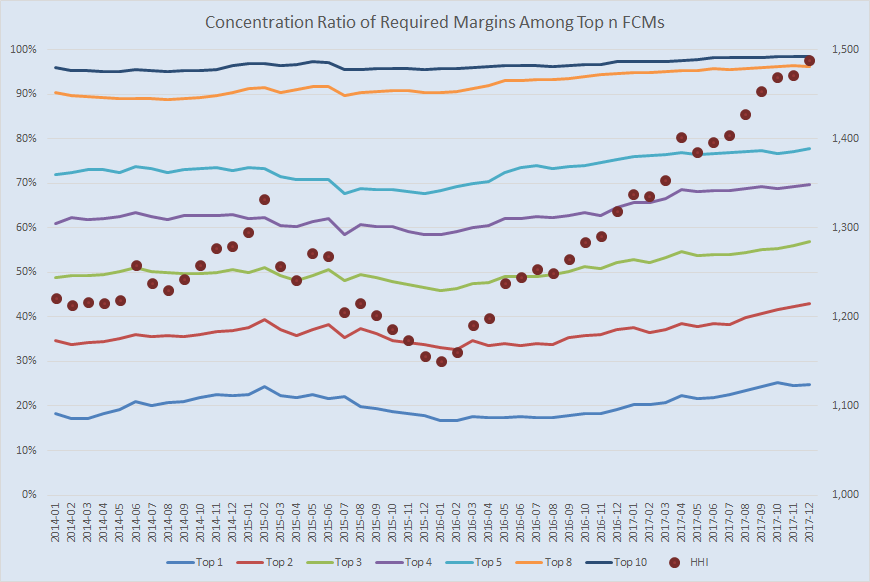
This shows us that the HHI concentration metric (Herfindahl-Hirschman Index) has now hit a record high of 1488. I always point out that the US DOJ seems to feel that readings under 1500 are still competitive, but wow, we’re getting close!
Seg League Table
Next is the Seg Futures league table.
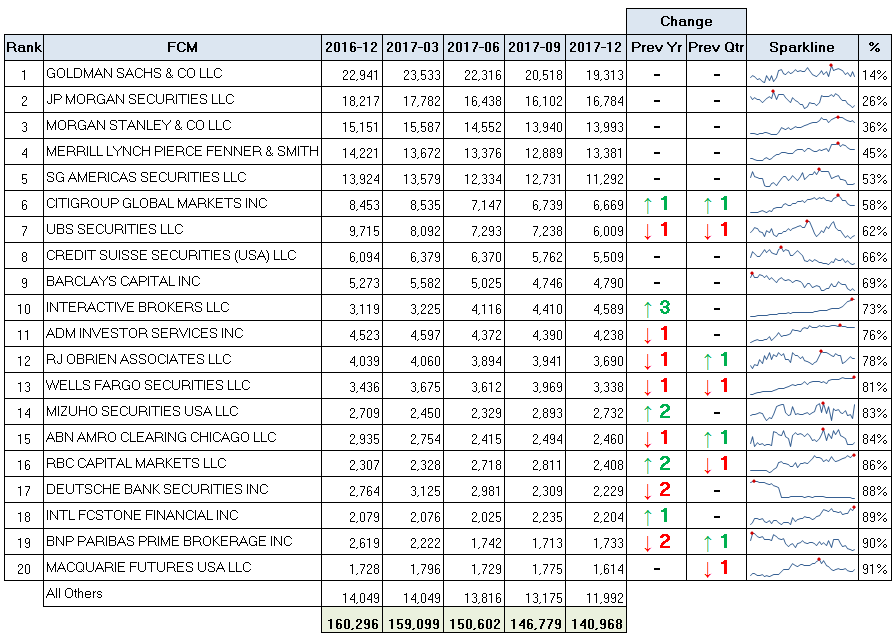
- All of the institutional FCMs have seen reduced Seg margins over the past 1 year
- The total amount of Seg margins has reduced from 160mm to 140mm
- Citigroup moved up in Futures this quarter to #6 (despite a reduction in client required funds)
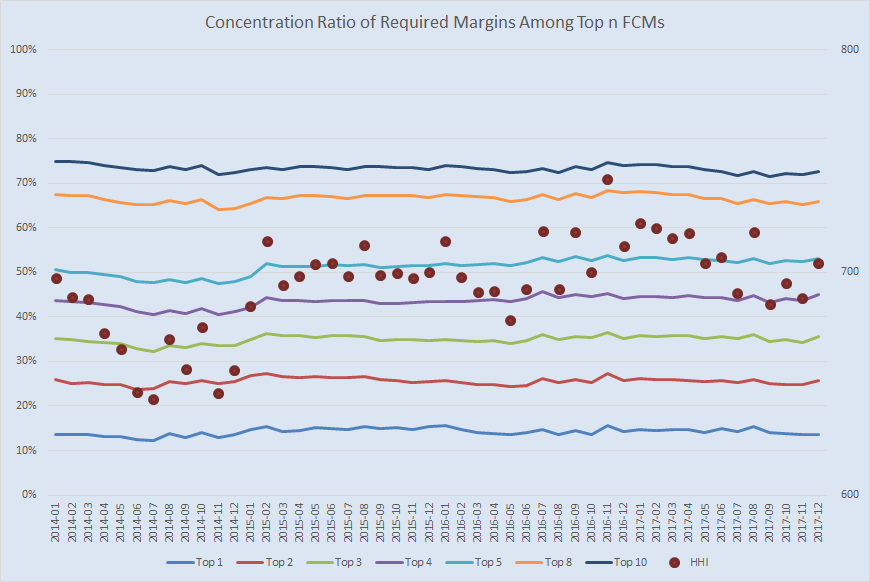
The concentration story here much more palatable:
Overall Combined League Table
Combining swaps, seg futures, and 30.7 (foreign futures) into one pot: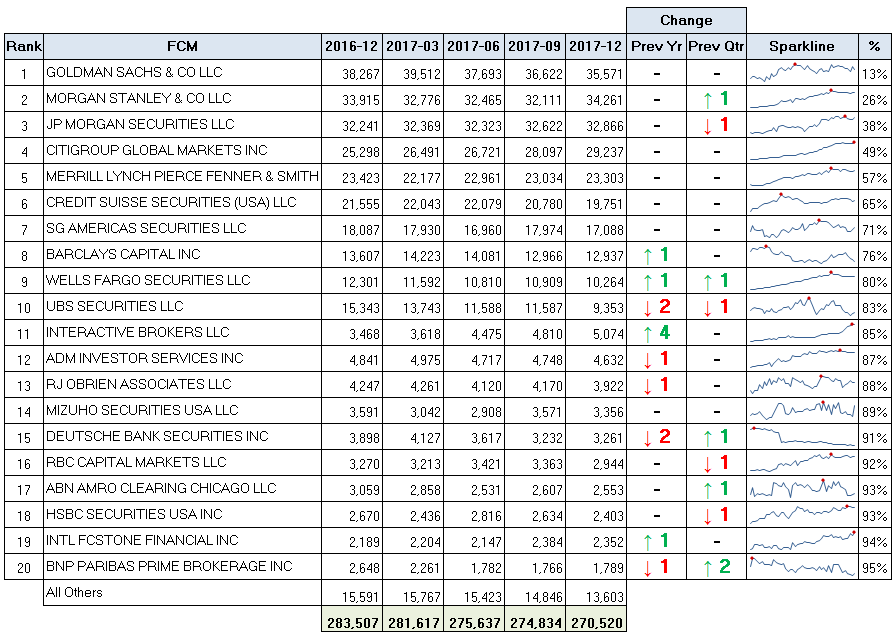
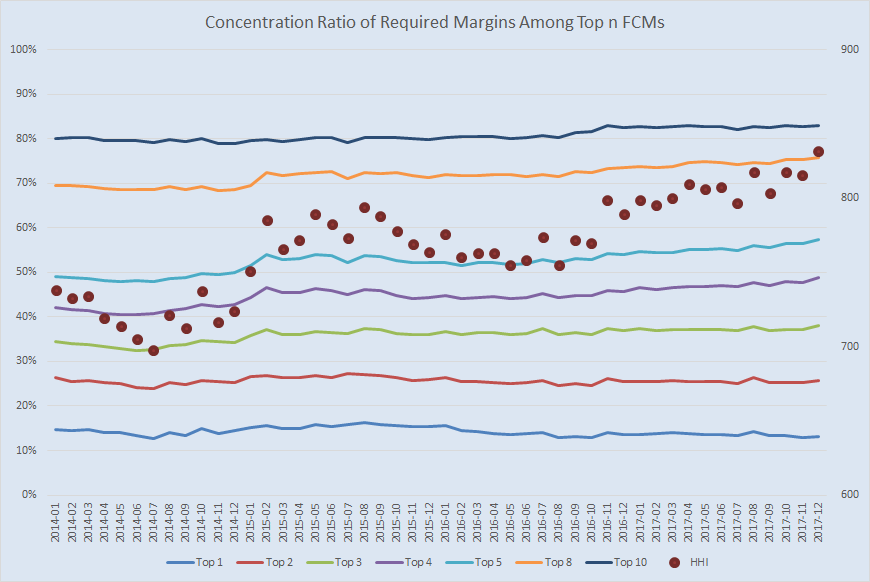
And the Concentration ratios:
Summary
What I glean from this quarters data:
- Goldman Sachs remain #1 overall.
- JP Morgan, Morgan Stanley, and Citi all roughly the same overall size
- Citigroup the notable standout, with significantly more client funds in Swaps vs Seg Futures
- Swaps business has become more concentrated. But is this a problem?
I will note that I watched some of Powell’s testimony today, and the subject of the Supplementary Leverage Ratio came up multiple times. He was pretty clear they intend to recalibrate this. Perhaps that is good news for the competitive nature of FCMs.